1. Executive Summary
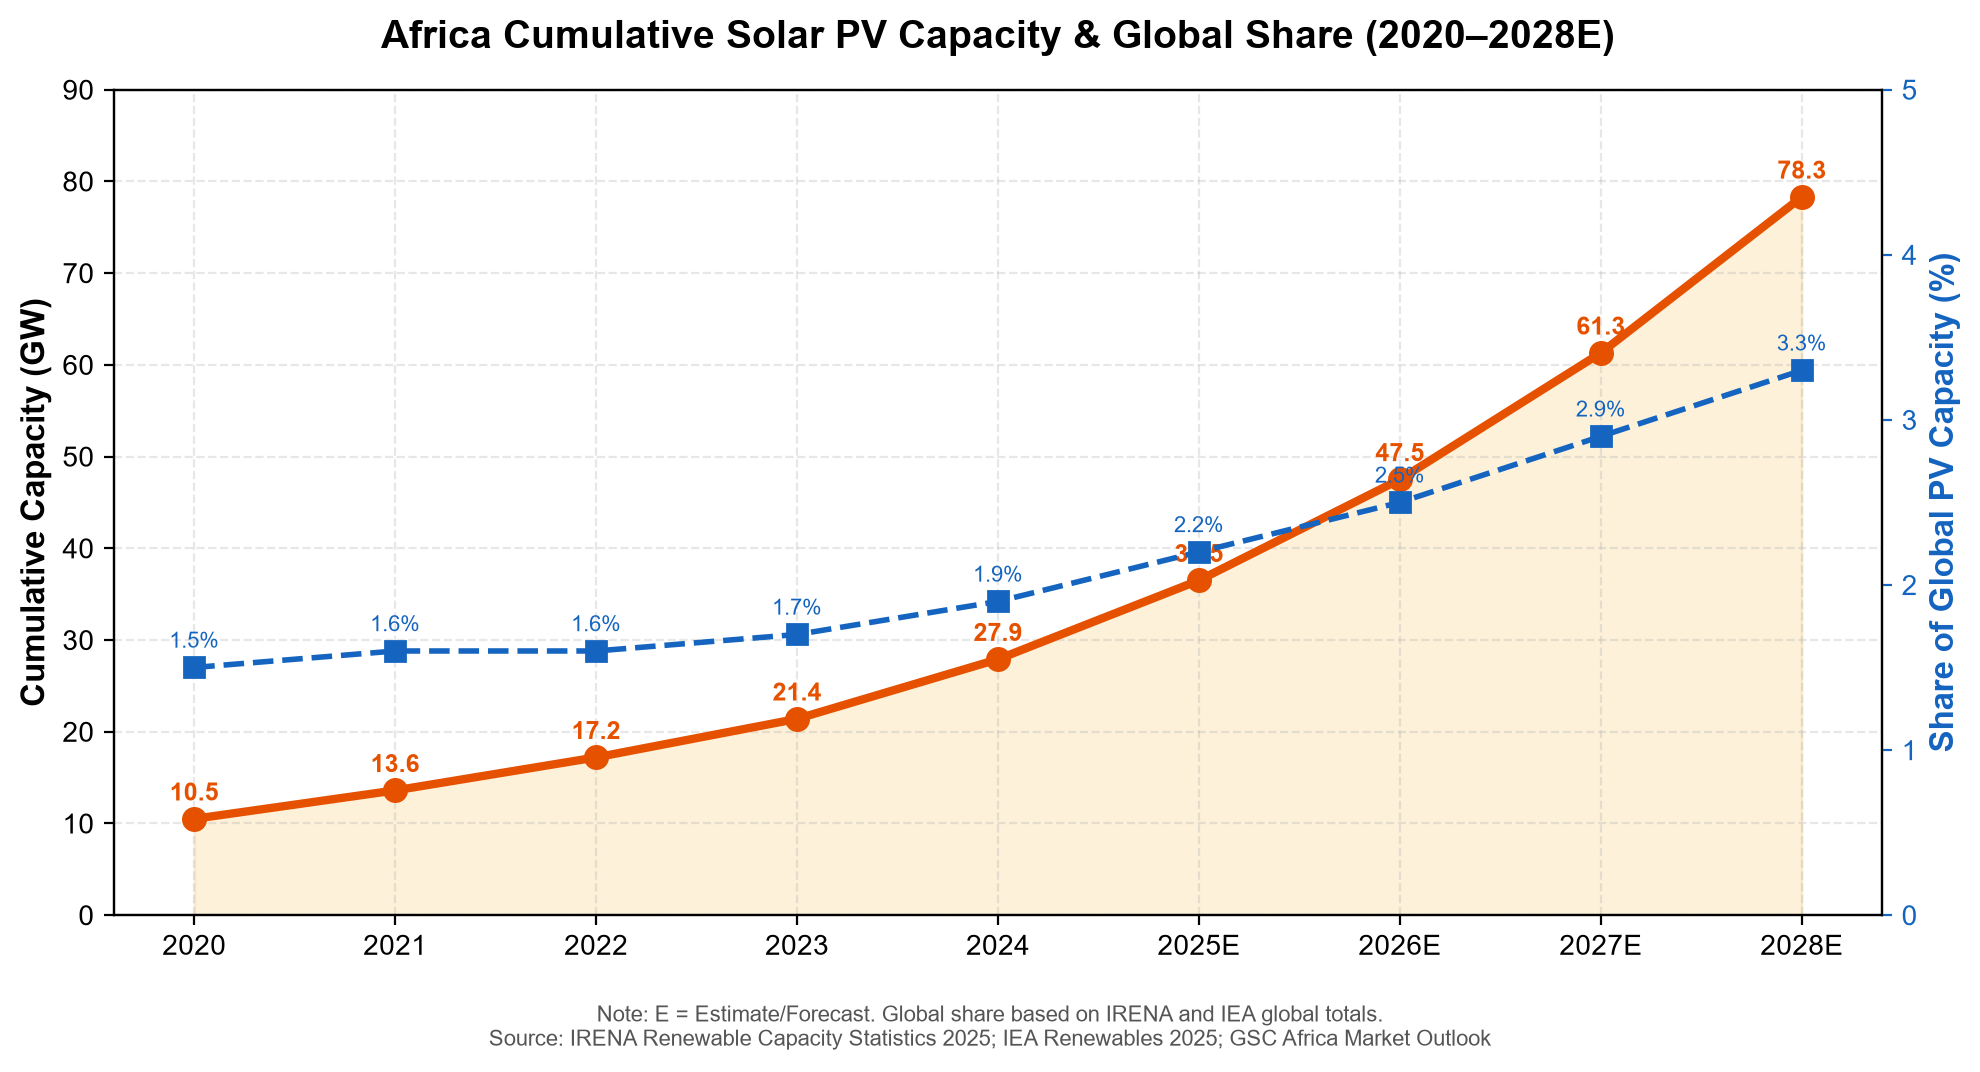
Africa's solar photovoltaic (PV) market has entered a period of accelerated structural growth, transforming from a nascent, aid-dependent sector into one of the world's most promising PV frontiers. Annual installations surged to an estimated 6.5 GW in 2024 — up 55% year-on-year — pushing cumulative installed capacity to approximately 27.9 GW, representing 1.9% of the global total and marking the continent's first significant step toward closing its vast energy access gap.
This report provides a comprehensive analysis of the African PV market across the 2020–2024 historical period and the 2025–2028 forecast horizon. It delivers data-driven insights on market size, growth trajectories, country-level dynamics, supply-demand balances, technology evolution, competitive positioning, pricing trends, energy storage integration, policy frameworks, and project pipelines.
Key Findings:
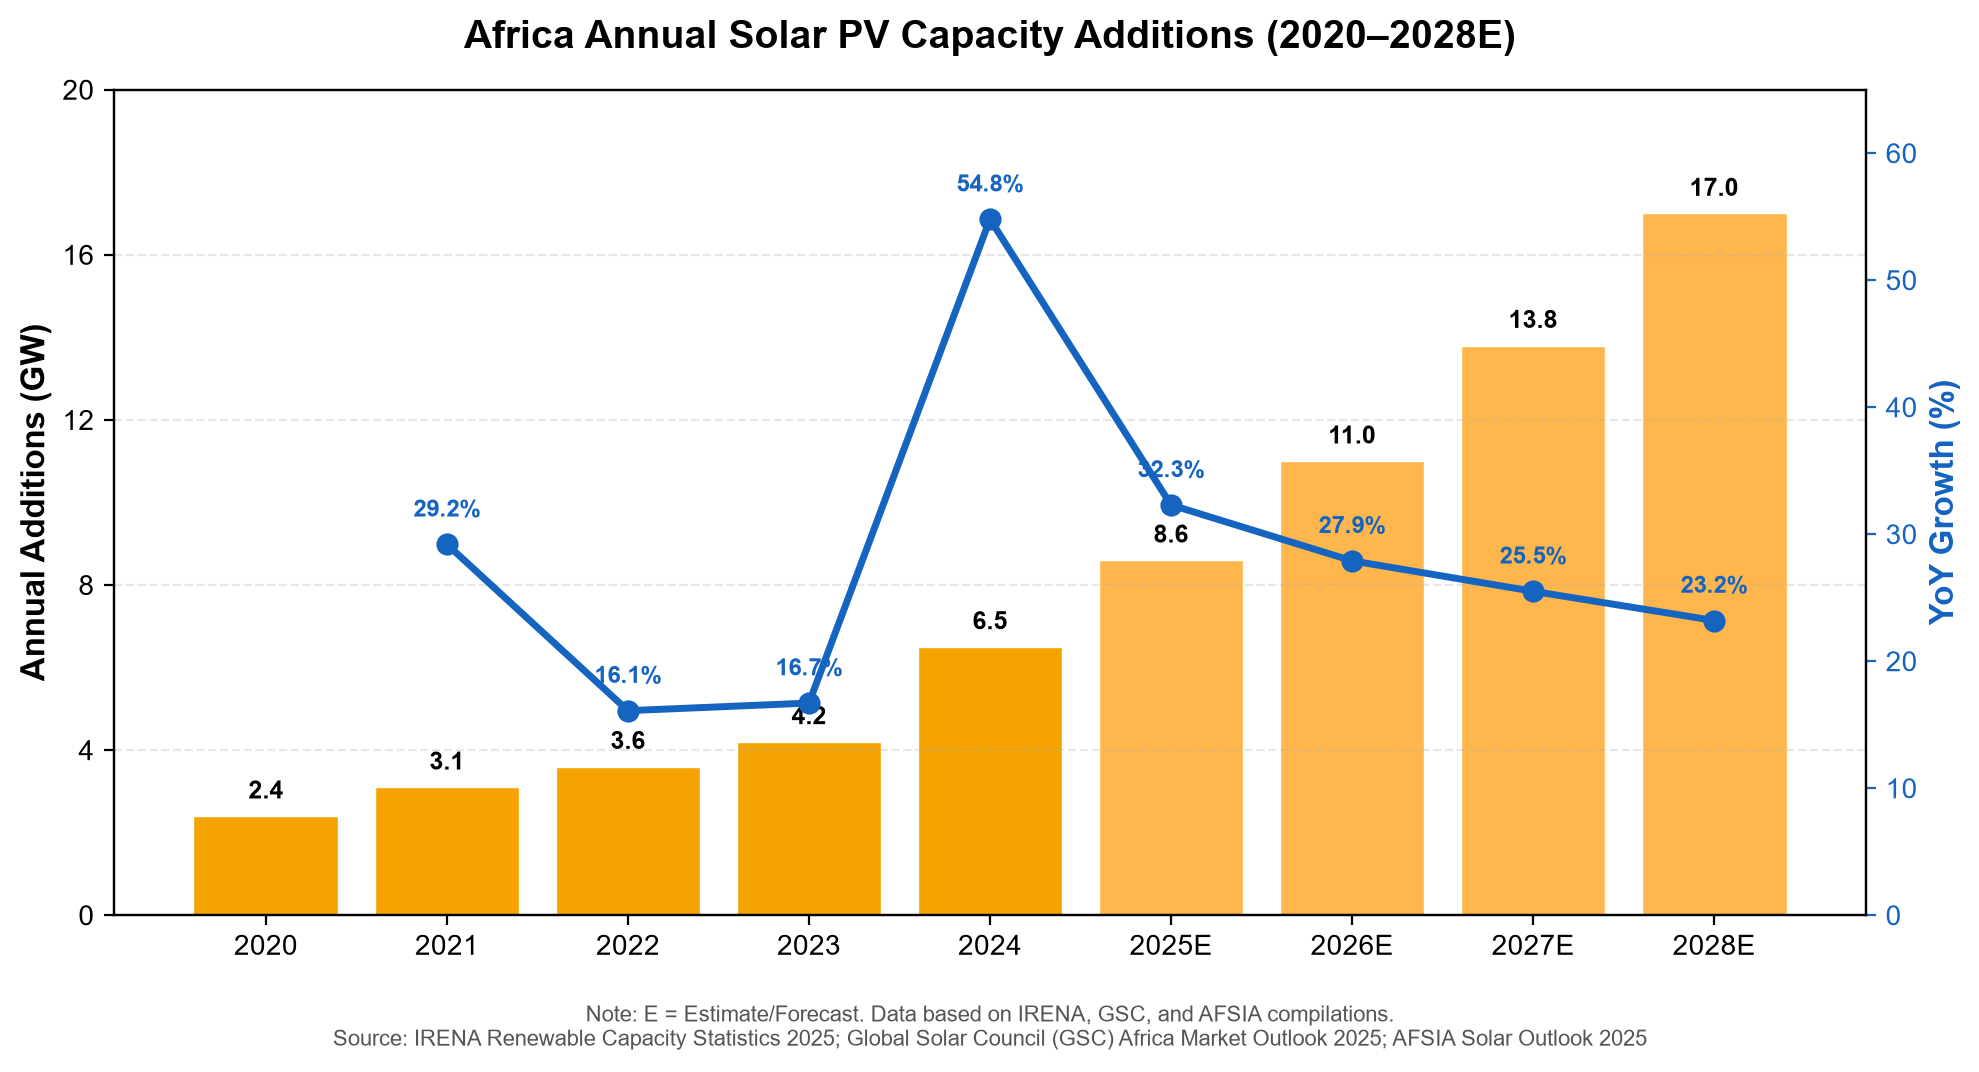
• Market Size: Africa’s solar PV market added an estimated 6.5 GW in 2024, with the cumulative base reaching 27.9 GW. The market is projected to add 8.6 GW in 2025 and accelerate to 17.0 GW annually by 2028, driven by falling module prices, energy security imperatives, and improving regulatory frameworks.
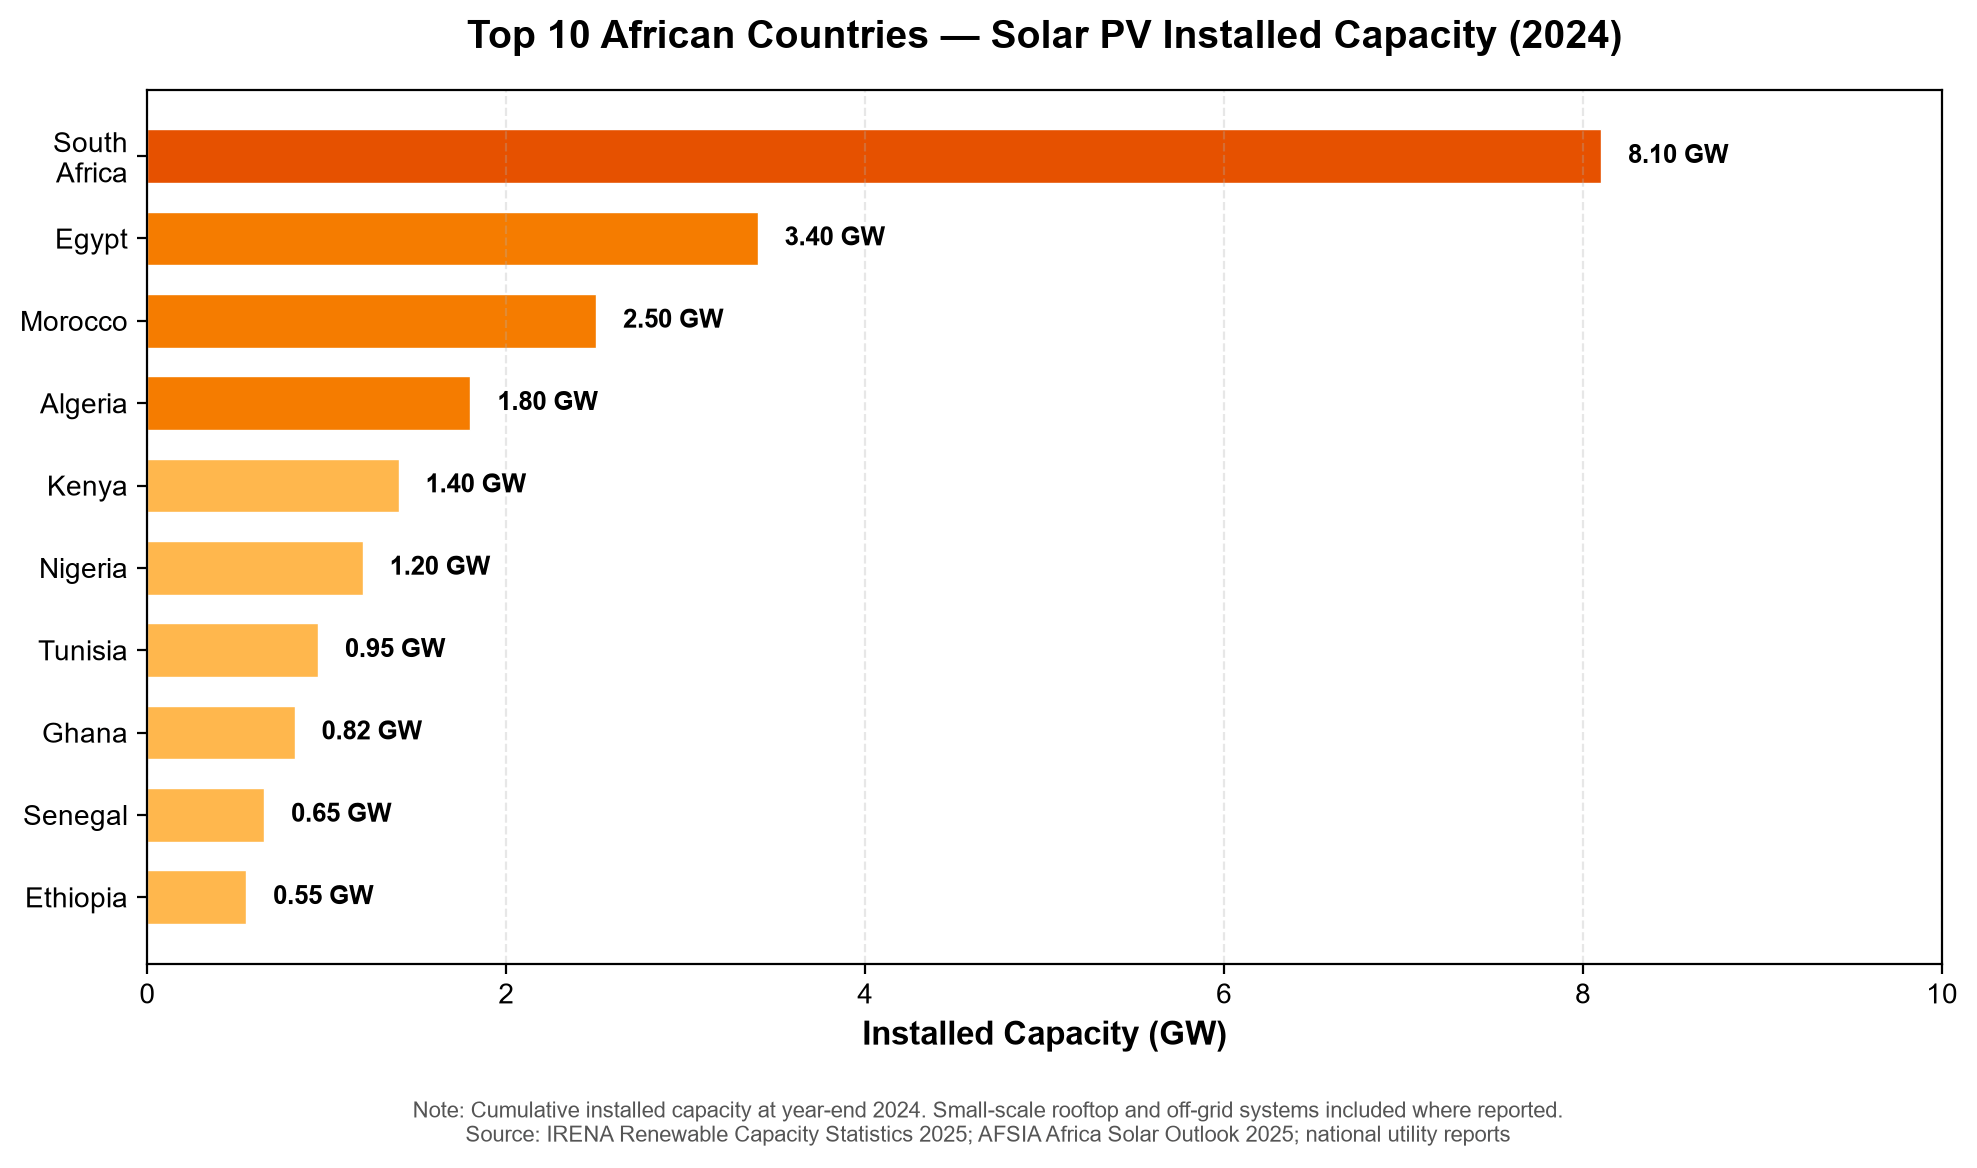
• Regional Leaders: South Africa dominates with 8.1 GW installed (29% of Africa’s total), followed by Egypt (3.4 GW), Morocco (2.5 GW), and Algeria (1.8 GW). However, the growth frontier is shifting toward Nigeria, Kenya, and the broader Sub-Saharan region where electricity access deficits create enormous latent demand.
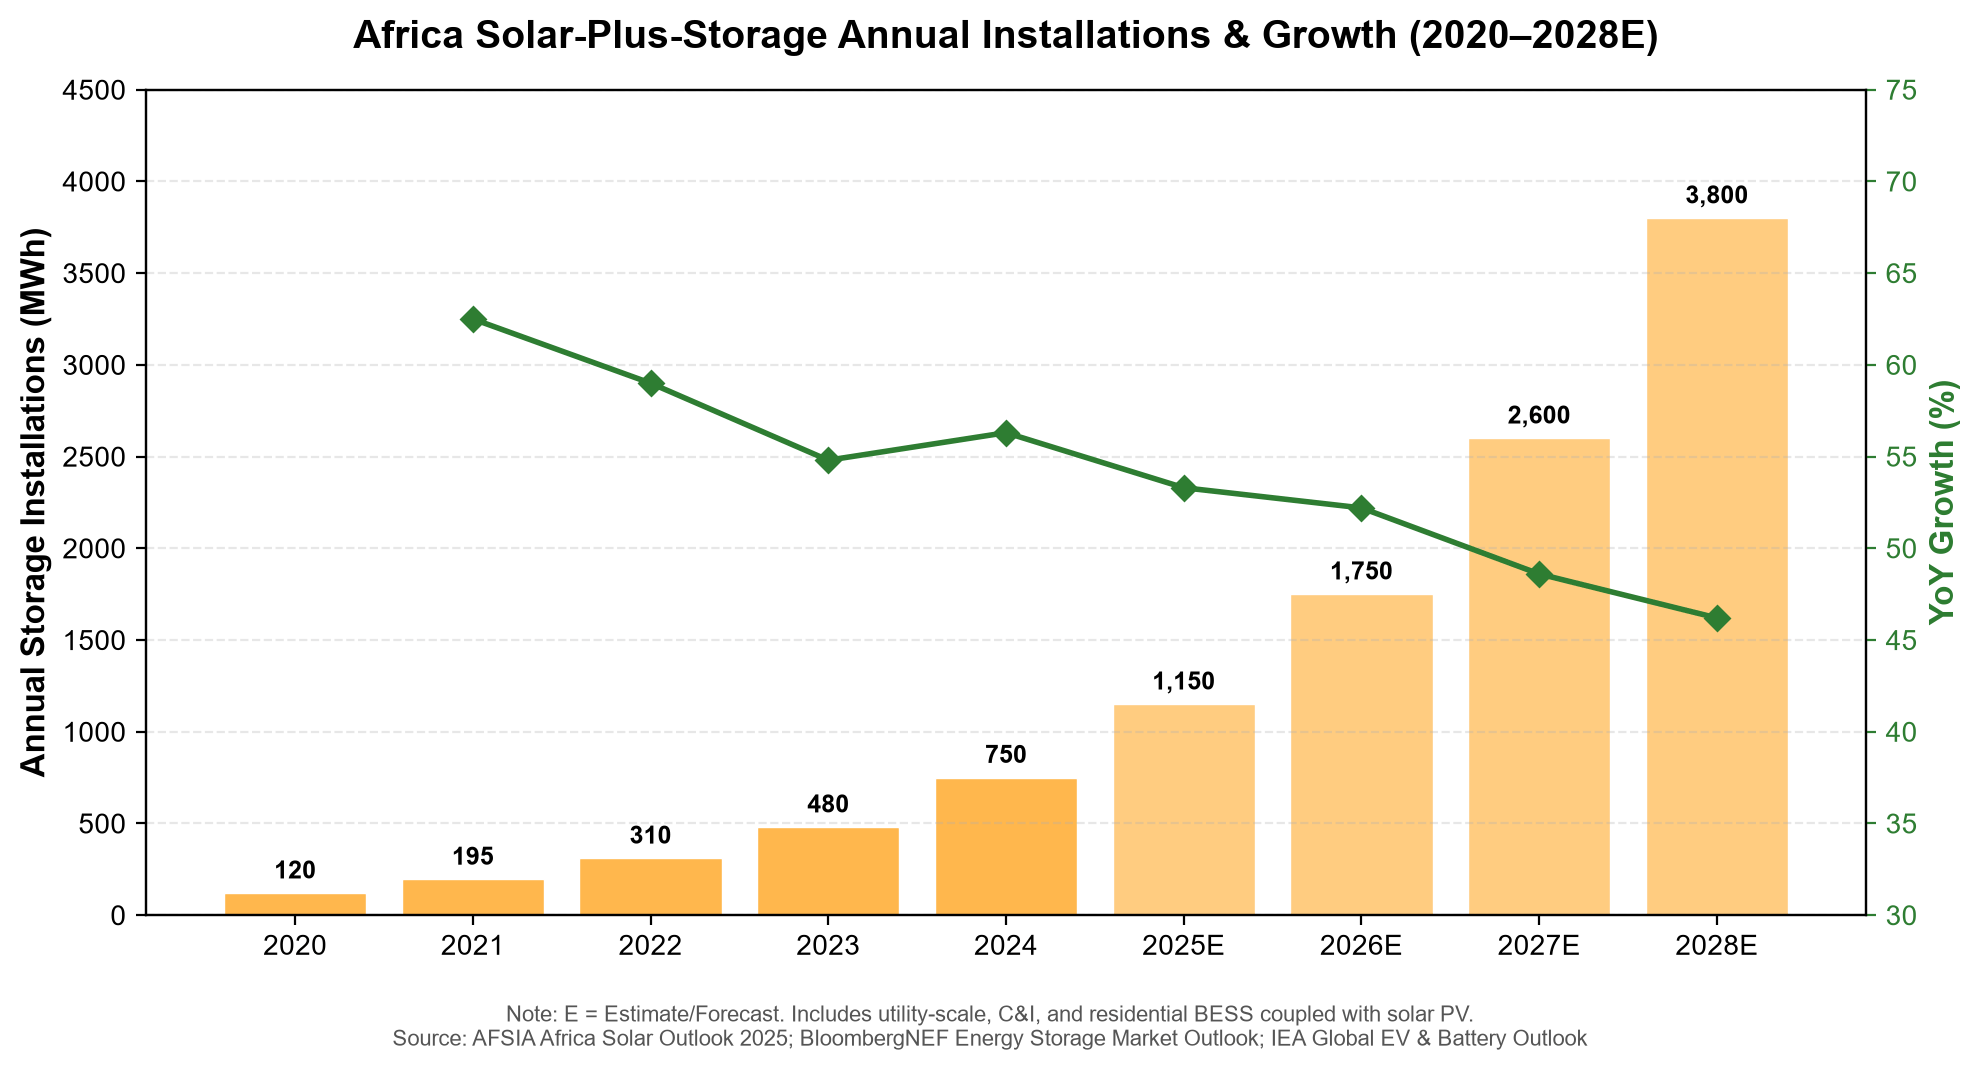
• Energy Storage: Solar-plus-storage is the defining trend of the current cycle. Annual BESS installations paired with solar reached approximately 750 MWh in 2024 and are projected to exceed 3,800 MWh by 2028, a compound annual growth rate of 50% as grid constraints, declining battery costs, and C&I self-consumption economics converge.
• Competitive Dynamics: Chinese manufacturers (LONGi, Jinko, Trina, JA Solar) supply an estimated 75–80% of modules to the African market. Tier-1 international developers (Scatec, ACWA Power, AMEA Power, TotalEnergies) dominate the utility-scale segment, while local EPC contractors and distributors are gaining ground in C&I and residential segments.
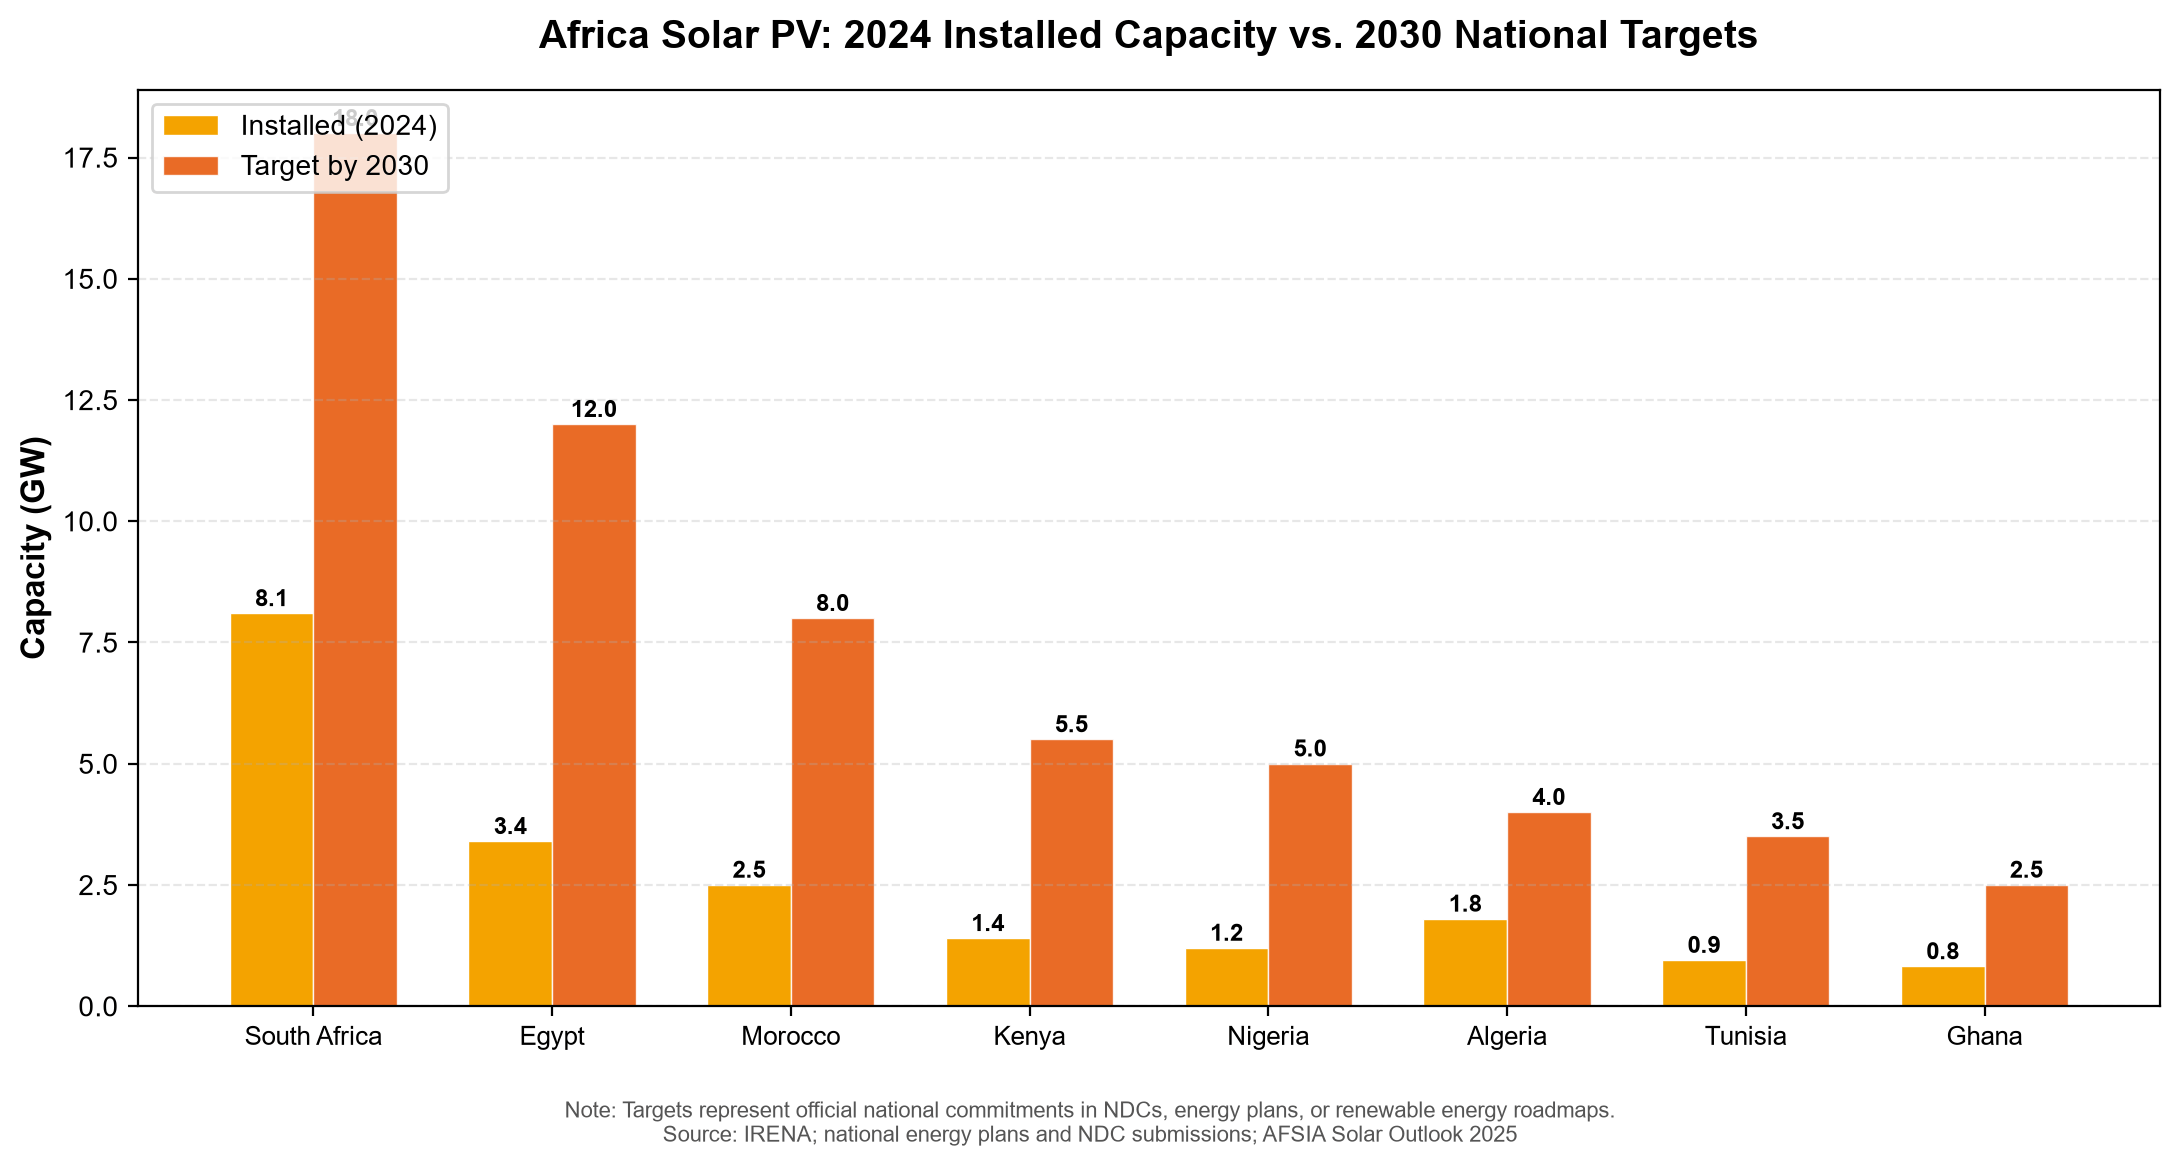
• Investment & Policy: National renewable energy targets across Africa collectively aim for over 50 GW of solar PV by 2030. Project pipelines tracked by AFSIA exceed 30 GW across all development phases. Realizing these targets will require an estimated USD 35–45 billion in cumulative investment through 2030.
• Risks: Currency volatility, offtaker credit risk, grid absorption constraints, policy inconsistency, and logistical bottlenecks in landlocked markets remain significant challenges. Nevertheless, the risk-reward profile has improved markedly as module costs have fallen below USD 0.12/W and DFIs have expanded guarantee and blended finance instruments.
2. Market Overview
2.1 Global Context: Africa in the Worldwide PV Landscape
The global solar PV market installed an estimated 460–480 GW in 2024, bringing total global capacity to over 1,500 GW. China alone accounted for approximately 55% of annual additions, followed by the European Union, the United States, and India. Africa’s 6.5 GW represented roughly 1.4% of global annual additions — a share that, while still modest, has nearly doubled from 0.8% in 2020.
Africa’s share of global cumulative capacity stood at 1.9% in 2024, up from 1.5% in 2020. While the continent lags behind Asia, Europe, and North America in absolute terms, its growth rate of 30–55% year-on-year in recent years far exceeds the global average of 25–30%. This divergence reflects Africa’s low base effect, the declining cost of solar technology, and the continent’s unparalleled solar irradiation resource — most African countries receive 1,800–2,500 kWh/m²/year of global horizontal irradiation (GHI), making PV one of the most cost-effective generation options available.
Africa’s total electricity generation capacity is approximately 245 GW across all sources, of which solar PV now accounts for roughly 11%. However, the effective utilization rate of the continent’s thermal and hydro fleets remains well below nameplate capacity due to aging infrastructure, fuel supply disruptions, and hydrological variability. This chronic underperformance reinforces the economic case for solar as a fast-to-deploy, modular, and increasingly cost-competitive alternative.
2.2 Installed Capacity & Growth Trajectory
Africa’s cumulative solar PV capacity has grown from approximately 10.5 GW at end-2020 to 27.9 GW at end-2024, representing a compound annual growth rate (CAGR) of 27.7% over the four-year period. The installed base is projected to reach 36.5 GW by end-2025, 47.5 GW by end-2026, 61.3 GW by end-2027, and 78.3 GW by end-2028, implying a forward CAGR of 29.4%.
Table: Africa Solar PV: Key Market Indicators (2020–2028E)
|
Indicator |
2020 |
2021 |
2022 |
2023 |
2024 |
2025E |
2028E |
|
Cumulative Capacity (GW) |
10.5 |
13.6 |
17.2 |
21.4 |
27.9 |
36.5 |
78.3 |
|
Annual Additions (GW) |
2.4 |
3.1 |
3.6 |
4.2 |
6.5 |
8.6 |
17.0 |
|
YoY Growth Rate (%) |
— |
29.2 |
16.1 |
16.7 |
54.8 |
32.3 |
23.2 |
|
Global Market Share (%) |
1.5 |
1.6 |
1.6 |
1.7 |
1.9 |
2.2 |
3.3 |
|
Solar + Storage (MWh) |
120 |
195 |
310 |
480 |
750 |
1,150 |
3,800 |
|
Avg. Module Price ($/W) |
0.22 |
0.25 |
0.27 |
0.18 |
0.11 |
0.09 |
0.07-0.09 |
Source: IRENA Renewable Capacity Statistics 2025; GSC Africa Market Outlook 2025; AFSIA Solar Outlook 2025; BloombergNEF; PVInsights (E = Estimate/Forecast)
The inflection point in 2024 — when annual additions jumped from 4.2 GW to 6.5 GW (+55% YoY) — reflects the convergence of several structural factors: the global module price crash (polysilicon oversupply driving module prices below USD 0.12/W delivered to Africa), the post-COVID normalization of logistics and installation activity, and the growing pipeline of utility-scale projects reaching financial close under improved regulatory conditions. These dynamics have fundamentally reshaped the outlook for
These dynamics have fundamentally reshaped the outlook for Photovoltaic Power Generation in Africa, which is now poised to become one of the fastest-growing regional PV markets globally over the 2025–2028 period.
3. Country-Level Analysis
3.1 South Africa — The Regional Powerhouse
South Africa remains Africa’s dominant solar PV market, with 8.1 GW of cumulative installed capacity at end-2024, accounting for 29% of the continent’s total. The country added approximately 2.0 GW in 2024, driven primarily by the Renewable Energy Independent Power Producer Procurement Programme (REIPPPP) and, increasingly, private-sector self-generation outside the formal procurement framework.
The structural driver of South Africa’s PV market is load-shedding: Eskom, the state utility, has been unable to meet demand reliably, with rolling blackouts exceeding 280 days in 2023. This has catalyzed a massive shift toward embedded generation. By end-2024, an estimated 5.5 GW of rooftop and C&I solar had been installed outside the REIPPPP framework — a segment that barely existed in 2020. The government’s decision to remove the licensing threshold for embedded generation (previously 1 MW, then raised to 100 MW, then removed entirely) has been transformative.
Looking ahead, South Africa’s Integrated Resource Plan (IRP) targets 18 GW of solar PV by 2030. The pipeline of utility-scale projects under the Risk Mitigation IPP Procurement Programme (RMIPPPP) and REIPPPP Bid Window 7 exceeds 6 GW. However, grid connection constraints in the Northern Cape — the country’s best solar resource region — represent a critical bottleneck that will require an estimated ZAR 70–100 billion (USD 3.8–5.4 billion) in transmission investment.
3.2 Egypt — The North African Giant Awakening
Egypt has emerged as Africa’s second-largest solar PV market, with 3.4 GW installed at end-2024. The Benban Solar Park (1.65 GW) in Aswan remains the continent’s largest single-site PV installation and a model for utility-scale solar deployment in emerging markets. Egypt added approximately 0.8 GW in 2024, split between new utility-scale projects and accelerating C&I adoption.
Egypt’s PV growth is underpinned by several favorable fundamentals: exceptional solar resources (GHI of 2,200–2,600 kWh/m²/year), a large and growing electricity demand base (peak load exceeding 35 GW), an established IPP framework with bankable power purchase agreements (PPAs), and strong government commitment under the Integrated Sustainable Energy Strategy (ISES) 2035, which targets 42% renewable electricity by 2035 with solar as the primary contributor.
The pipeline of projects under development exceeds 5 GW, including major schemes by ACWA Power, AMEA Power, Scatec, and Masdar. The government’s NWFE (Nexus of Water, Food and Energy) program has mobilized USD 10 billion in climate-aligned investment pledges, with solar and wind as primary beneficiaries. Egypt is also positioning itself as a green hydrogen hub, with multiple GW-scale solar projects linked to electrolyzer capacity in the Suez Canal Economic Zone.
3.3 Nigeria — The Sleeping Giant
Nigeria represents arguably the largest untapped solar PV opportunity in Africa. With a population exceeding 220 million, an electrification rate of only 55–60%, and chronic grid instability, the latent demand for decentralized solar solutions is enormous. Yet the country’s grid-connected PV capacity remains below 1.2 GW — a figure wildly disproportionate to its potential.
The Nigerian PV market is evolving along two distinct tracks. The first is the off-grid/mini-grid segment, which has attracted significant development finance and impact investment: the Nigeria Electrification Project (NEP), backed by the World Bank and African Development Bank, has deployed over 500,000 solar home systems. The second is the nascent utility-scale segment, where the government’s Energising Access to Quality Healthcare and Energising Education Programmes, combined with the removal of fuel subsidies (which previously undermined solar’s economic case), are beginning to unlock larger-scale deployment.
Nigeria’s Energy Transition Plan targets 30 GW of generation capacity by 2030, with solar contributing 6.5 GW. The revised Electricity Act (2023) has devolved regulatory authority to states, creating a more flexible permitting environment. Nevertheless, currency risk (the Naira depreciated by over 60% against the USD in 2023–2024), offtaker creditworthiness, and import logistics remain significant barriers.
3.4 North Africa: Morocco, Algeria, and Tunisia
Morocco (2.5 GW installed) has long been the regional standard-bearer for renewable energy policy, with the Noor Ouarzazate complex as its flagship. The country targets 52% renewable electricity by 2030 and is developing the Noor Midelt hybrid solar CSP-PV complex, which will add 1.6 GW of capacity. Morocco’s integration with the European electricity market via cross-border interconnections and its emerging green hydrogen strategy position solar as a strategic export industry.
Algeria (1.8 GW installed) has accelerated deployment under the Solar 1000 and Solar 2000 programs, aiming for 15 GW of renewable capacity by 2035. The state utility Sonelgaz is the primary offtaker, and recent regulatory reforms allow private-sector participation. Algeria’s vast desert territory and proximity to European markets make it a long-term candidate for GW-scale solar export schemes.
Tunisia (0.95 GW) operates a concession-based IPP regime and targets 30% renewable electricity by 2030. The market has been slower to scale than its Maghreb neighbors due to political instability and fiscal constraints, but the 500 MW Tataouine and 200 MW Kairouan projects signal renewed momentum.
3.5 Sub-Saharan Africa: Kenya, Ghana, Senegal, Ethiopia
Kenya (1.4 GW installed) is East Africa’s PV leader, benefiting from a well-structured feed-in tariff regime, strong geothermal baseload (which provides grid stability for variable solar), and a dynamic off-grid solar sector. The Kenya Off-Grid Solar Access Project (KOSAP) has extended electricity access to over 1 million households through standalone solar systems.
Ghana (0.82 GW), Senegal (0.65 GW), and Ethiopia (0.55 GW) represent the next tier of Sub-Saharan markets. Ghana’s Scaling Solar program and the Bui Solar Park demonstrate the viability of competitively procured utility-scale solar in West Africa. Senegal’s Senergy 2 and scaling of C&I solar under net-metering provisions show steady progress. Ethiopia, despite abundant hydropower resources, is diversifying into solar to address seasonal hydrological variability, with the Scaling Solar program targeting 500 MW.
Table: Africa Solar PV: Country-Level Capacity, Targets & Drivers
|
Country |
Installed (GW, 2024) |
2024 Additions (GW) |
2030 Target (GW) |
Primary Segment |
Key Enabler / Barrier |
|
South Africa |
8.1 |
2.0 |
18.0 |
Utility + C&I |
Enabler: REIPPPP / Barrier: Grid |
|
Egypt |
3.4 |
0.8 |
12.0 |
Utility + Green H₂ |
Enabler: Benban legacy / Barrier: Subsidies |
|
Morocco |
2.5 |
0.4 |
8.0 |
Utility + CSP |
Enabler: Noor record / Barrier: Financing |
|
Algeria |
1.8 |
0.5 |
4.0 |
Utility |
Enabler: Solar 2000 / Barrier: Bureaucracy |
|
Kenya |
1.4 |
0.3 |
5.5 |
Off-Grid + IPP |
Enabler: Geothermal baseload / Barrier: Grid |
|
Nigeria |
1.2 |
0.25 |
6.5 |
Off-Grid/Mini-Grid |
Enabler: NEP / Barrier: FX & offtaker |
|
Tunisia |
0.95 |
0.15 |
3.5 |
IPP Concession |
Enabler: Concession / Barrier: Fiscal |
|
Ghana |
0.82 |
0.15 |
2.5 |
Utility + C&I |
Enabler: Scaling Solar / Barrier: Debt |
|
Senegal |
0.65 |
0.12 |
2.0 |
Utility + C&I |
Enabler: Net metering / Barrier: Grid |
|
Ethiopia |
0.55 |
0.10 |
2.0 |
IPP + Off-Grid |
Enabler: Scaling Solar / Barrier: FX |
Source: IRENA; AFSIA; GSC; national energy plans; IEA Africa Energy Outlook 2025
4. Supply & Demand Dynamics
The African PV supply chain is heavily import-dependent, with an estimated 85–90% of modules, inverters, and balance-of-system components sourced from outside the continent — primarily from China, which supplies approximately 75–80% of modules entering African markets. The remaining 15–20% is split between Indian, Southeast Asian, and a small but growing share of Turkish and Middle Eastern manufacturers.
Module supply to Africa has benefited disproportionately from the global oversupply that emerged in 2023–2024. With polysilicon prices collapsing from over USD 40/kg in early 2023 to below USD 6/kg by mid-2024, and global module production capacity exceeding 1,100 GW against demand of approximately 500 GW, African buyers have enjoyed historically unprecedented pricing: module landed costs in major African ports fell to USD 0.10–0.12/W by Q4 2024, down from USD 0.25–0.27/W in 2022.
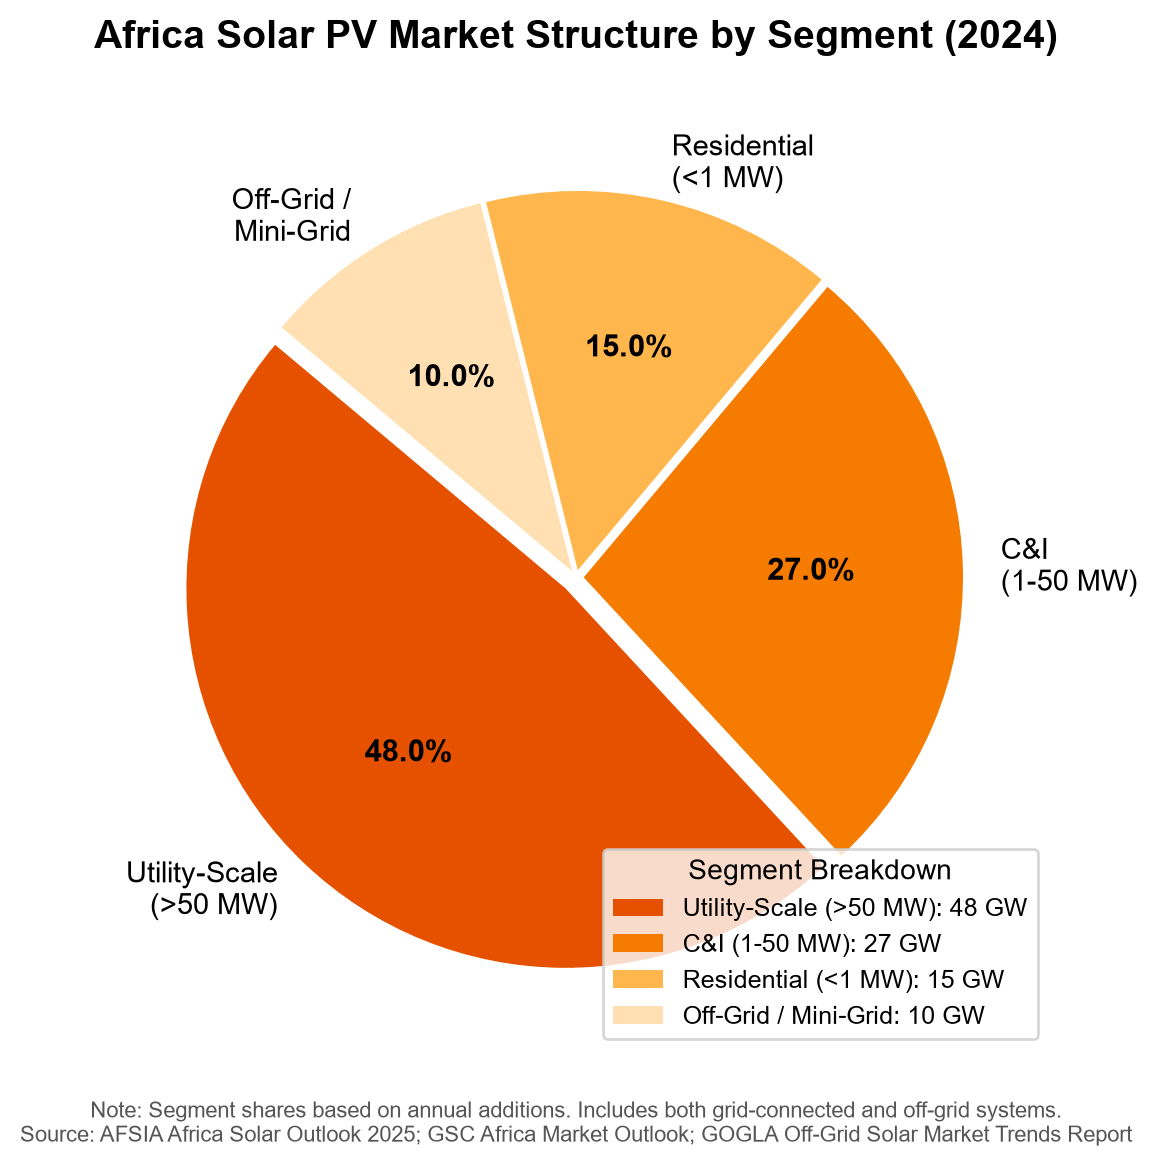
On the demand side, Africa’s PV market is driven by four structurally distinct segments:
• Utility-Scale (48% of 2024 additions): Driven by IPP procurement programs, bilateral PPAs with utilities and large offtakers, and, increasingly, merchant projects selling into wholesale markets. Average project size has grown from 20–50 MW in 2020 to 50–200 MW in 2024, with several 500 MW+ projects under development.
• Commercial & Industrial — C&I (27%): The fastest-growing segment in percentage terms, driven by self-consumption economics as commercial electricity tariffs rise and reliability erodes. South Africa, Kenya, Nigeria, and Ghana lead this segment. Payback periods of 3–5 years are common, and the removal of licensing thresholds has unlocked a pipeline of 500 kW to 50 MW installations.
• Residential (15%): Concentrated in South Africa (where load-shedding has driven household solar-plus-battery adoption), North African urban centers, and, increasingly, the middle-income segments of Kenya, Ghana, and Côte d’Ivoire. The availability of asset finance and pay-as-you-go (PAYG) models is expanding the addressable market.
• Off-Grid / Mini-Grid (10%): Serving the approximately 570 million Africans who lack electricity access. GOGLA reports that the African off-grid solar sector reached over 400 million people with improved energy access by 2024.
5. Technology Roadmap & Industry Chain
The African PV technology landscape mirrors global trends but with market-specific adaptations reflecting local climatic, logistical, and economic conditions.
5.1 Module Technology
Monocrystalline PERC (passivated emitter and rear contact) modules dominate the African market, accounting for over 90% of module shipments in 2024, up from approximately 70% in 2020. The transition from polycrystalline to mono PERC has been accelerated by the narrowing price premium (now effectively zero) and the superior performance of mono PERC in high-temperature environments, where lower temperature coefficients provide meaningful yield advantages.
TOPCon (tunnel oxide passivated contact) modules, which offer 22–24% module efficiency compared to 20–22% for PERC, are entering the African market through major Chinese suppliers but remain a premium product with limited adoption outside utility-scale projects with international developers. HJT modules remain negligible in the African market.
Bifacial modules are gaining traction for utility-scale ground-mount installations, particularly in desert and semi-arid regions where high ground albedo (15–30% reflectance from sand and light-colored soil) can boost energy yield by 5–12%. Approximately 25–30% of new utility-scale capacity installed in 2024 used bifacial modules, up from under 10% in 2021.
The sharp decline in global Photovoltaic Modules pricing has been the single most transformative factor for the African market, with delivered costs falling below USD 0.12/W for the first time in history, fundamentally improving the economic case for solar deployment across all market segments and geographies.
5.2 Inverters & Balance of System
The African inverter market is dominated by Chinese manufacturers (Huawei, Sungrow, Growatt) for string inverters in the C&I and residential segments, and by a mix of Chinese and Western suppliers (SMA, Power Electronics, TMEIC) for central inverters in the utility-scale segment. Huawei’s market share in the African C&I inverter segment is estimated at 30–35%, driven by competitive pricing, strong local distribution networks, and integrated smart PV solutions.
The shift toward 1,500V DC system architecture is well underway in utility-scale projects, reducing balance-of-system costs by an estimated 10–15%. Single-axis tracking systems are deployed on approximately 35% of new utility-scale capacity, up from 20% in 2020, with bifacial modules on trackers delivering particularly strong LCOE improvements in high-DNI locations.
5.3 Local Manufacturing
Africa’s solar PV manufacturing base remains minimal but is showing the first signs of development. Egypt has the most established assembly capacity, with the Arab Organization for Industrialization (AOI) operating a 200 MW module assembly line. Morocco’s industrial acceleration zones have attracted interest from Chinese and European manufacturers considering near-shoring for the European market. South Africa’s designation of solar modules under its local content requirements (now at 40–65%) has prompted investment announcements, though none have yet reached commercial production at scale.
The African Continental Free Trade Area (AfCFTA), once fully implemented, could provide a framework for regional manufacturing hubs serving continental demand. However, the economics of local assembly remain challenged by small domestic market sizes, high input costs, limited skilled labor, and competition from Chinese modules priced below USD 0.12/W.
Table: Africa Solar PV Technology Roadmap & Adoption Trends
|
Technology |
Current Share (2024) |
Trend |
Key Supplier Regions |
Africa-Specific Notes |
|
Mono PERC Modules |
90%+ |
Mature/Declining |
China (80%+), India, SE Asia |
Dominant; price collapse driving rapid adoption |
|
TOPCon Modules |
5-8% |
Growing rapidly |
China (Jinko, Trina, LONGi) |
Entering via utility-scale; premium narrowing |
|
Bifacial Modules |
25-30% of utility |
Growing |
China (LONGi, Jinko, JA) |
Desert albedo boosts yield 5-12% |
|
String Inverters |
70% of C&I |
Stable growth |
China (Huawei, Sungrow) |
Huawei ~30-35% C&I market share |
|
Central Inverters |
80% of utility |
Slow decline |
China + Europe (SMA, PE) |
Shift toward 1,500V architecture |
|
Single-Axis Trackers |
35% of utility |
Growing |
US/Spain (Nextracker, Soltec) |
Strong ROI with bifacial in high DNI |
|
Local Assembly |
<3% of supply |
Emerging |
Egypt, South Africa, Morocco |
Cost gap vs. Chinese imports: 30-50% |
Source: GSC; AFSIA; BloombergNEF; PVInsights; industry interviews
6. Competitive Landscape
The African solar PV competitive landscape is characterized by a clear segmentation between module supply (dominated by Asian manufacturers), project development (split between international IPPs and local developers), and EPC/installation (increasingly local).
6.1 Module Supply
Chinese Tier-1 manufacturers — LONGi Green Energy, JinkoSolar, Trina Solar, JA Solar, and Canadian Solar — collectively supply an estimated 70–75% of modules to the African market. LONGi and Jinko have been particularly aggressive in establishing distribution partnerships across the continent, with dedicated warehouses in South Africa, Kenya, Nigeria, and Egypt. Indian manufacturers (Waaree, Adani, Vikram Solar) and Southeast Asian producers account for most of the remainder.
Module brand preference in the African market is heavily price-driven, but warranty support and local after-sales service are increasingly important differentiators, particularly for C&I customers managing operational risk. LONGi and Jinko have the strongest brand recognition among African project developers.
6.2 Project Development
The African utility-scale PV development landscape features a mix of established international players and a growing cohort of regional developers:
• International Tier-1: Scatec (Norway) is the largest solar IPP in Africa by operational capacity, with major assets in South Africa, Egypt, and Mozambique. ACWA Power (Saudi Arabia) has a growing African portfolio anchored by projects in Egypt, Morocco, and South Africa. AMEA Power (UAE) has emerged as a significant developer with projects across North and West Africa. TotalEnergies, Engie, and EDF (France) maintain strategic African solar portfolios. Masdar (UAE) has announced an ambitious 10 GW African target.
• Regional Developers: Cennergi (South Africa), BioTherm Energy (South Africa), and Starsight Energy (Nigeria/Kenya) represent a growing class of Africa-headquartered developers with deep local market knowledge and increasingly sophisticated project execution capabilities.
6.3 EPC & Installation
The EPC segment is the most localized part of the value chain. South African EPC contractors (Murray & Roberts, WBHO, Consolidated Power Projects) have extensive utility-scale experience from REIPPPP rounds. In East Africa, companies like Solarcentury, PowerGen, and d.light dominate the C&I and mini-grid segments. Chinese EPC contractors (PowerChina, SEPCOIII, CEEC) are increasingly active on large-scale projects, often in conjunction with Chinese module supply and financing.
The residential and small C&I installation market is highly fragmented, with thousands of local installers. In South Africa alone, SAPVIA counts over 400 registered PV installers. Quality standardization remains a concern, with SAPVIA PV GreenCard and similar initiatives in Kenya and Nigeria attempting to establish professional certification frameworks.
7. Pricing & Cost Analysis
The economics of solar PV in Africa have been transformed by the global module price decline. Delivered module costs for African ports fell from an average of USD 0.25–0.27/W in 2022 to USD 0.10–0.12/W in Q4 2024, a decline of approximately 58%. This has fundamentally altered project economics across all market segments.
The dramatic reduction in the cost of Solar Panels — driven primarily by global polysilicon oversupply and manufacturing capacity expansion in China — has been the primary catalyst for Africa’s solar market acceleration, making utility-scale PV the cheapest source of new electricity in virtually every African market.
Table: Africa Solar PV System Cost Breakdown by Segment (2020–2024)
|
Cost Component |
2020 ($/W) |
2022 ($/W) |
2024 ($/W) |
Change (2022–24) |
|
PV Modules (landed African port) |
0.22 |
0.26 |
0.11 |
-58% |
|
Inverters |
0.06 |
0.07 |
0.05 |
-29% |
|
Mounting Structure |
0.06 |
0.07 |
0.06 |
-14% |
|
BOS (cables, combiner boxes, etc.) |
0.05 |
0.06 |
0.05 |
-17% |
|
Installation Labor |
0.08 |
0.09 |
0.08 |
-11% |
|
EPC Margin & Overhead |
0.07 |
0.08 |
0.06 |
-25% |
|
Development & Soft Costs |
0.06 |
0.07 |
0.06 |
-14% |
|
Total Installed Cost (Utility) |
0.60 |
0.70 |
0.47 |
-33% |
|
Total Installed Cost (C&I) |
0.75 |
0.88 |
0.58 |
-34% |
|
Total Installed Cost (Residential) |
1.10 |
1.25 |
0.85 |
-32% |
Source: IRENA Renewable Cost Database; BloombergNEF; GSC; AFSIA; developer surveys. All costs in nominal USD/W-DC.
At USD 0.47/W installed cost for utility-scale systems, the LCOE for African solar PV ranges from USD 0.025–0.045/kWh depending on irradiation, financing costs, and capacity factor. This places solar as the cheapest source of new electricity generation in virtually every African market — cheaper than new coal, gas, hydro, or nuclear, and increasingly competitive with the operating cost of existing thermal plants.
However, headline LCOE numbers mask significant market-specific cost premiums. Inland transport to landlocked markets (Chad, Niger, South Sudan, Rwanda, Burundi) can add USD 0.03–0.06/W. Currency depreciation and hedging costs can inflate effective project costs by 15–25% over the project lifecycle. Import duties and VAT on solar equipment, though increasingly waived, still apply in several markets, adding 5–15% to installed costs.
8. Energy Storage Integration
Solar-plus-storage is the defining trend of Africa’s current PV market cycle. The continent’s weak and unreliable grids make standalone solar PV a suboptimal solution for many applications: without storage, solar generation is limited to daytime hours, and grid instability prevents injection of variable renewable energy beyond certain penetration thresholds.
Annual battery energy storage installations paired with solar PV in Africa grew from approximately 120 MWh in 2020 to 750 MWh in 2024, a five-year CAGR of approximately 44%. The pipeline is accelerating: projections indicate 1,150 MWh in 2025, 1,750 MWh in 2026, 2,600 MWh in 2027, and 3,800 MWh in 2028.
8.1 Market Drivers
Three primary drivers are converging to accelerate solar-plus-storage adoption in Africa:
• Grid Resilience & Energy Security: In markets with unreliable grids (South Africa, Nigeria, Ghana, Kenya), solar-plus-storage provides energy security that standalone solar cannot. South African C&I customers now routinely specify 2–4 hours of battery storage with new solar installations, and residential customers are increasingly adopting 5–10 kWh battery systems. The South African battery storage market alone is estimated at over USD 1 billion in 2024.
• Declining Battery Costs: LFP battery cell prices fell to approximately USD 55/kWh in 2024, down from USD 110/kWh in 2022 and over USD 180/kWh in 2020. At the system level, turnkey BESS costs for 2-hour duration systems are now USD 180–220/kWh, making storage economically viable for a growing range of applications.
• Time-of-Use Tariffs & Arbitrage: As African utilities move toward cost-reflective tariffs, ToU pricing structures are emerging. In South Africa, Eskom’s Megaflex and Nightsave tariffs create significant spreads between peak and off-peak periods. Kenya Power’s ToU tariff provides a similar framework.
8.2 Technology & Supply Chain
LFP chemistry dominates the African stationary storage market, accounting for over 90% of installations. Chinese manufacturers (CATL, BYD, EVE Energy, Gotion) supply the majority of cells and modules. At the system integration level, Huawei, Sungrow, and Growatt lead the residential and small C&I segments, while Fluence, Wärtsilä, and Tesla compete in the utility-scale segment.
The market for Solar Energy Storage Equipment in Africa is projected to grow at a compound annual rate exceeding 50% through 2028, driven by the convergence of declining battery costs, grid reliability imperatives, and the increasing economic attractiveness of solar self-consumption for commercial and industrial users across the continent.
Second-life EV battery applications are emerging as a niche opportunity in Africa, with several pilot projects using repurposed EV batteries for mini-grid and C&I applications. The economics are attractive (cells at 30–50% of new cost) but the segment remains constrained by limited supply of suitable end-of-life EV batteries on the continent.
9. Policy, Regulation & Market Access
African solar PV policy frameworks span a wide spectrum, from well-established IPP procurement programs in South Africa, Egypt, and Morocco to nascent regulatory environments in many Sub-Saharan markets. The overall trend is positive.
9.1 Competitive Procurement & IPP Frameworks
South Africa’s REIPPPP remains the continent’s most sophisticated renewable energy procurement program, having awarded over 8 GW of renewable capacity across seven bid windows since 2011. The program’s bankability — underpinned by government guarantees, standardized PPAs, and transparent bidding — has made it a model emulated by Egypt, Morocco, Zambia, and Senegal.
The World Bank Group’s Scaling Solar program has been instrumental in establishing bankable solar procurement frameworks in countries with limited prior IPP experience, including Zambia, Senegal, Ethiopia, and Togo. The program’s standardized documentation, credit enhancement, and competitive auction design have delivered some of Africa’s lowest solar tariffs — below USD 0.04/kWh in Zambia and Senegal.
9.2 Import Duties, VAT & Trade Policy
African governments are increasingly recognizing that import duties and VAT on solar equipment raise the cost of electricity access. Approximately 25 African countries now exempt solar equipment from import duties, and 15 have VAT exemptions. South Africa offers a tax rebate (section 12B) allowing businesses to deduct 125% of renewable energy investment costs in the first year. Kenya exempts solar panels, inverters, and batteries from both import duty and VAT.
However, several major markets still impose tariffs: Nigeria applies 5–10% import duty on solar equipment, Ethiopia imposes duties up to 35%, and several ECOWAS member states have yet to implement regional commitments to eliminate duties on renewable energy equipment. The AfCFTA could resolve many of these cross-border inconsistencies.
9.3 Grid Access & Wheeling
Grid connection and wheeling remain critical barriers in many African markets. South Africa has made the most progress, with Eskom and municipal distributors now providing standardized grid connection and wheeling agreements. The 2024 Electricity Regulation Amendment Bill will establish an independent transmission system operator, further liberalizing grid access.
In most other African markets, grid connection processes remain opaque, slow, and expensive. Transmission infrastructure is inadequate: Africa’s total transmission line length is approximately 110,000 km, compared to 470,000 km in the United States for a comparable land area. The African Development Bank’s Desert to Power initiative, targeting 10 GW of solar across the Sahel, includes significant transmission investment.
Table: Africa Solar PV Policy & Regulatory Framework Matrix (Selected Countries)
|
Country |
Key Policy / Framework |
Solar Target |
Duty/VAT Exemption |
Grid Access/Wheeling |
Carbon Market |
|
South Africa |
REIPPPP; IRP; embedded gen |
18 GW by 2030 |
Yes (125% deduction) |
Advanced; wheeling operational |
Carbon tax; VCM |
|
Egypt |
FiT; competitive auction; NWFE |
12 GW by 2030 |
Partial |
Developing; wheeling pilots |
Article 6 readiness |
|
Morocco |
Law 13-09; Noor program |
8 GW by 2030 |
Yes |
Limited direct access |
AMEE registry |
|
Kenya |
FiT; Energy Act 2019; KOSAP |
5.5 GW by 2030 |
Yes (duty/VAT exempt) |
ToU; net metering |
Active VCM |
|
Nigeria |
Electricity Act 2023; NEP |
6.5 GW by 2030 |
5-10% duty applies |
State-level liberalization |
NCCC framework |
|
Algeria |
Solar 1000/2000; RE reform |
4 GW by 2030 |
Partial |
Sonelgaz monopoly |
Early stage |
|
Tunisia |
Concession regime; STEG PPAs |
3.5 GW by 2030 |
Partial exemption |
Limited |
Developing |
|
Ghana |
RE Act; Scaling Solar |
2.5 GW by 2030 |
Yes |
Net metering for C&I |
Active registry |
Source: National legislation; IRENA policy database; IEA; AfDB; BloombergNEF
10. Key Projects & Investment Pipeline
AFSIA’s project database tracked over 30 GW of solar PV projects across Africa in various stages of development as of end-2024. The top projects by size and strategic significance include:
Table: Africa Solar PV: Selected Key Projects & Investment Pipeline
|
Project |
Country |
Capacity (MW) |
Developer(s) |
Status |
Est. Capex (USD M) |
|
Noor Midelt I & II |
Morocco |
1,600 |
Masdar/EDF/ACWA |
Under development |
2,000-2,500 |
|
Benban Solar Park |
Egypt |
1,650 |
Multiple (Scatec, IB Vogt) |
Operational |
~2,100 |
|
De Aar/Droogfontein Complex |
South Africa |
1,200+ |
Scatec/Mainstream |
Operational + expanding |
~1,300 |
|
Redstone CSP + PV |
South Africa |
600+ |
ACWA Power |
Under construction |
~1,100 |
|
Amunet Wind + Solar |
Egypt |
1,000 |
AMEA Power |
Under development |
~1,200 |
|
Tafilalt & Noor PV Extension |
Morocco |
800+ |
Masdar/ACWA/Nareva |
Phases underway |
~900 |
|
Nigeria Electrification Project |
Nigeria |
200 (SHS) |
Multiple (Lumos, d.light) |
Ongoing |
~350 |
|
Tunisia Tataouine & Kairouan |
Tunisia |
700 |
Scatec/AMEA |
Under construction |
~800 |
Source: AFSIA Africa Solar Outlook 2025; project developer disclosures; AfDB project database
Utility-scale Photovoltaic Power Stations represent the largest segment of Africa’s solar investment pipeline, with projects totaling more than 18 GW in advanced development or construction phases as of end-2024, concentrated in South Africa, Egypt, Morocco, and increasingly across the Sahel region under the AfDB’s Desert to Power initiative.
Investment in African solar PV reached an estimated USD 7–8 billion in 2024, split roughly 65% utility-scale, 25% C&I, and 10% off-grid/mini-grid. DFIs and MDBs provided approximately 40% of total financing, with the World Bank Group, African Development Bank, European DFIs (FMO, DEG, Proparco, BII), and climate funds (GCF, GEF, CIF) as the largest providers.
The pipeline of projects that have reached financial close or are in advanced negotiation exceeds 15 GW, representing potential investment of USD 18–22 billion. However, the gap between announced and financially closed projects remains substantial, reflecting the challenges of achieving bankability in markets with sovereign credit constraints, currency risk, and regulatory uncertainty.
11. Market Entry Opportunities & Risk Assessment
11.1 Opportunities
• C&I Solar-as-a-Service: The African C&I solar market is growing at 35–45% annually and is under-penetrated. Companies offering solar-as-a-service (lease/PPA models) to mines, factories, and commercial real estate can achieve equity IRRs of 12–18% in hard-currency-linked PPAs.
• Solar + Storage + Diesel Displacement: Hybrid solar-storage systems that displace diesel generation for telecom towers, mining, and remote industrial sites represent a USD 3–5 billion addressable market. Total cost of diesel-generated electricity in remote African locations ranges from USD 0.35–0.60/kWh, providing a wide economic margin.
• Green Hydrogen Feedstock: North Africa (Egypt, Morocco, Algeria, Mauritania) is positioning as a green hydrogen production hub targeting European offtake, representing a new frontier for GW-scale utility PV.
• Mini-Grid & Productive Use: The mini-grid sector is evolving from basic electrification to productive-use applications (agro-processing, cold storage, water pumping, EV charging). The World Bank targets 200,000 mini-grids in Africa by 2030.
• Module Distribution & Local Assembly: With continental demand projected to exceed 15 GW/year by 2028, the case for regional warehousing, distribution, and eventual assembly is strengthening, particularly in South Africa, Egypt, and Nigeria.
11.2 Risk Assessment
Table: Africa Solar PV: Market Entry Risk Assessment Matrix
|
Risk Category |
Severity |
Description |
Mitigation Strategies |
|
Currency / FX |
High |
Depreciation and convertibility risk; 15-25%+ annual in Nigeria, Ethiopia |
USD/EUR-linked PPAs; DFI FX guarantees; blended finance |
|
Offtaker Credit |
High |
Utility financial distress; corporate offtaker default |
DFI partial risk guarantees; LC-backed PPAs; diversified portfolios |
|
Grid Constraints |
Med-High |
Inadequate transmission; connection delays; curtailment |
Grid studies; phased approach; storage co-location; wheeling |
|
Policy Instability |
Medium |
Retroactive tariff changes; revocation of incentives |
Treaty protection; political risk insurance (MIGA, ATI); DFI involvement |
|
Logistics |
Medium |
Port congestion; inland transport; customs delays |
Regional warehousing; local partners; advance customs clearance |
|
Security |
Low-Med |
Conflict zones (Sahel, Horn); asset theft |
Site security; community engagement; insurance |
Source: BloombergNEF; IEA; World Bank; MIGA; ATI; developer surveys
12. Outlook & Strategic Recommendations (2025–2028)
12.1 Market Forecast
Africa’s solar PV market is projected to reach annual additions of 17.0 GW by 2028, with cumulative installed capacity approaching 78 GW. This forecast is based on: continued module price stability at or below USD 0.10/W; progressive implementation of national RE targets and procurement programs; accelerating C&I adoption driven by grid reliability concerns and improving storage economics; increased DFI and climate finance mobilization; and gradual resolution of regulatory and grid access barriers.
The forecast carries upside potential if the green hydrogen opportunity materializes at scale, if regional transmission interconnection projects accelerate, or if major policy breakthroughs occur in Nigeria or Ethiopia. Downside risks center on macroeconomic instability, sustained high global interest rates, or a retreat from climate finance commitments.
12.2 Strategic Recommendations
For module manufacturers and equipment suppliers: Establish local distribution partnerships and warehousing in South Africa, Kenya, Egypt, and Nigeria. Invest in after-sales service, warranty support, and installer training as key differentiators. Monitor local content requirements and consider phased assembly investments in high-volume markets.
For project developers and IPPs: Prioritize markets with bankable offtake frameworks (South Africa, Egypt, Morocco, Kenya, Senegal) for utility-scale projects. For C&I, build geographically diversified portfolios across multiple countries. Incorporate storage into project design from the outset to address grid constraints and improve offtake value.
For investors and financiers: Deploy blended finance structures combining concessional capital (first-loss, subordinated debt) with commercial tranches. Engage early with DFIs for risk mitigation instruments (PRGs, FX guarantees). Consider aggregation platforms that bundle smaller C&I and mini-grid assets into portfolios large enough to attract institutional capital.
For policymakers and regulators: Prioritize transparent, competitive procurement frameworks with standardized documentation. Eliminate import duties and VAT on solar and storage equipment. Invest in transmission infrastructure and streamline grid connection processes. Implement net metering, time-of-use tariffs, and wheeling frameworks to unlock private-sector distributed generation.
In conclusion, Africa’s solar PV market is at an inflection point. The convergence of historically low equipment costs, acute energy security needs, improving regulatory environments, and growing climate finance availability has created a structurally attractive investment landscape. Realizing the full potential will require sustained commitment from governments, DFIs, developers, and financiers — but the direction of travel is unmistakably positive. Solar PV is set to become the backbone of Africa’s electricity system over the next decade.
Disclaimer
This report is prepared for informational purposes only and does not constitute investment, legal, or commercial advice. The data, analysis, and projections contained herein are derived from publicly available sources believed to be reliable as of the publication date. However, no warranty or representation, express or implied, is made as to the accuracy, completeness, or fitness for any particular purpose of the information provided.
Market forecasts and projections are forward-looking statements that involve known and unknown risks, uncertainties, and other factors that may cause actual results to differ materially from those projected. Readers should not place undue reliance on forward-looking statements and should conduct their own due diligence before making investment or commercial decisions.
The sources cited in this report include, but are not limited to: the International Renewable Energy Agency (IRENA), the International Energy Agency (IEA), the Global Solar Council (GSC), the Africa Solar Industry Association (AFSIA), BloombergNEF, GOGLA, the World Bank Group, the African Development Bank (AfDB), UNCTAD, PVInsights, and national government and utility publications.
Publication Date: July 25, 2026
Report produced by independent market research. All rights reserved.
Related Products

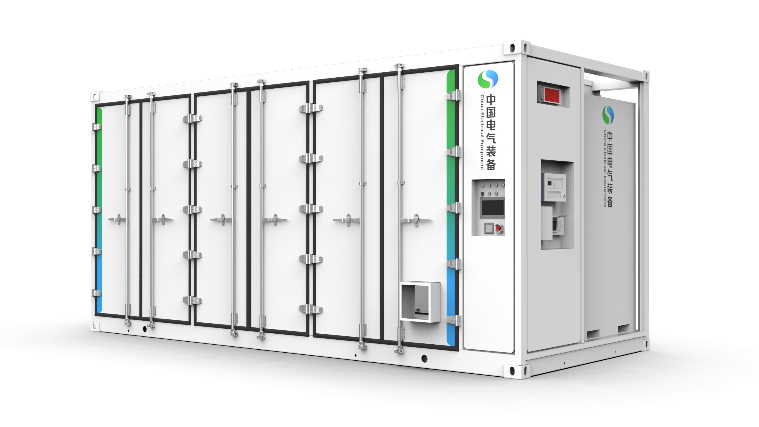
MESS8201-2507/5015-BN Prefabricated Liquid-cooled Energy Storage Battery Container
Xuchang Xuji Electric Science Energy Storage Technology Co., Ltd.



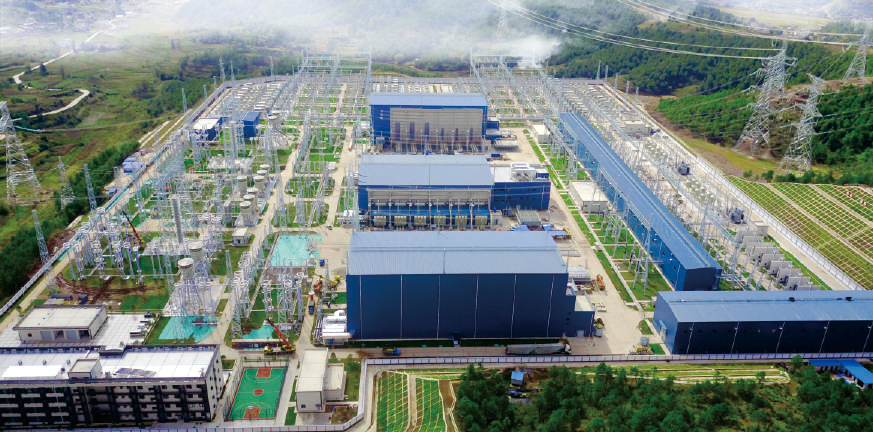
High-voltage Direct Current (HVDC) Transmission System Research and Integrated Design
XI'AN XD POWER SYSTEMS CO., LTD.
Perfluorinated Ionic Membrane-CM-10N Series Membrane
Guizhou Juneng Century Technology Co., Ltd