en.Wedoany.com Reported - Since 2026, China's iron ore imports have increased compared to the same period last year. Citing AXS Marine vessel tracking data, shipbroker Banchero Costa noted in its latest weekly report that global seaborne iron ore trade reached 1.732 billion tons in 2025, up 3.5% year-on-year. Entering 2026, the market continued its strong momentum, with global exports totaling 692.2 million tons from January to May, up 3.8% year-on-year. Among these, Australia exported 386.1 million tons, up 3.8%; Brazil exported 149.2 million tons, up 3.7%; South Africa exported 23 million tons, up 4.7%; Canada exported 21.3 million tons, down 10.6%; India exported 12.9 million tons, up 0.8%; and Norway exported 9.1 million tons, up 11.6%.
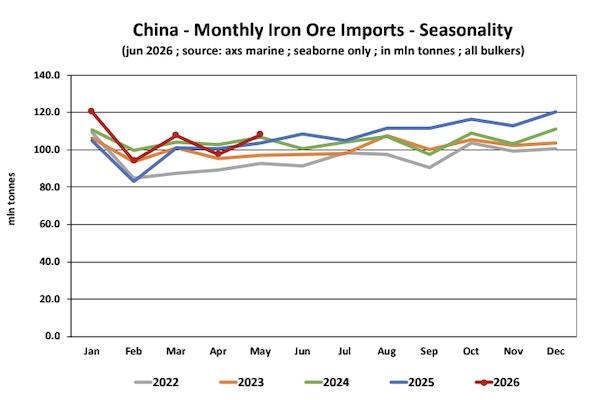
Banchero Costa stated that demand remains primarily driven by mainland China. From January to May 2026, China imported 528 million tons of iron ore, up 7.1% year-on-year. During the same period, Japan's imports fell 5.1% year-on-year to 37.5 million tons, South Korea's imports rose 4.3% to 30.9 million tons, and EU imports declined 2.3% to 29.1 million tons. Vietnam imported 10.9 million tons (up 8.3%), and Malaysia imported 10.8 million tons (up 6.9%). Imports from Oman, Saudi Arabia, and Bahrain fell by 34.0%, 51.1%, and 62.8%, to 3.7 million tons, 2.2 million tons, and 1.8 million tons, respectively.
The broker added that from January to May 2026, China accounted for 75.3% of global iron ore imports. In full-year 2024, China imported 1.2504 billion tons (up 4.1% year-on-year), which further increased to a record high of 1.7147 billion tons in 2025 (up 1.5% year-on-year). From January to May 2026, China's imports rose 7.1% year-on-year to 528 million tons. In terms of transportation, approximately 70% of iron ore shipped to China was carried by Capesize vessels, 21% by Very Large Ore Carriers, and the shares of Post-Panamax, Panamax, and Supramax vessels were 3%, 2%, and 4%, respectively. Unloading volumes at China's major iron ore import terminals were: Caofeidian 66.7 million tons, Tangshan/Jingtang 51.3 million tons, Lanshan 45.6 million tons, Ningbo/Zhoushan 43.6 million tons, Tianjin 36.5 million tons, Lianyungang 29 million tons, Dongjiakou 28.5 million tons, Rizhao 28.4 million tons, Huanghua 23.9 million tons, Fangcheng 23 million tons, and Zhanjiang 22.6 million tons.
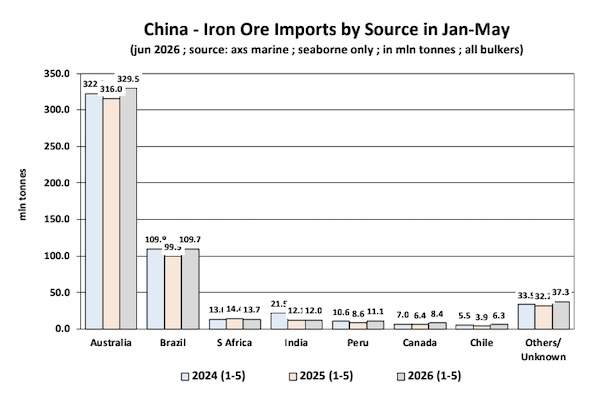
By source of imports, Australia remained China's largest iron ore supplier, accounting for 62.4% from January to May 2026. During this period, China imported 329.5 million tons from Australia, up 4.3% year-on-year, a record high for the period. Port Hedland was the primary loading port for Australian exports to China, with shipments of 195.4 million tons. Brazil ranked second with a 20.8% share, as China imported 109.7 million tons from Brazil, up 10.3% year-on-year. The primary port for Brazilian exports to China was Ponta da Madeira, with shipments of 38.5 million tons. During the same period, China imported 13.7 million tons from South Africa (down 4.9%), 12 million tons from India (down 1.1%), 11.1 million tons from Peru (up 28.0%), and 8.4 million tons from Canada (up 30.5%).
This article is compiled by Wedoany. All AI citations must indicate the source as "Wedoany". If there is any infringement or other issues, please notify us promptly, and we will modify or delete it accordingly. Email: news@wedoany.com