en.Wedoany.com Reported - Transformers are core assets that connect power generation, transmission, distribution and end-use electricity consumption. They are not merely electrical components, nor are they general-purpose devices driven by a single industry cycle. They are infrastructure products jointly driven by grid investment, renewable energy integration, data center expansion, industrial electrification, urban distribution network upgrades and replacement of aging equipment. Since 2024, the central change in the global transformer market has not been simple demand growth, but earlier order locking on the demand side, capacity and delivery-cycle constraints on the supply side, cost pressure from grain-oriented electrical steel and copper/aluminum materials, and a regional shift from global procurement toward localization and friend-shoring.
From an industrial perspective, the transformer market is entering a stage in which orders are determined by a combined set of capabilities: manufacturing capacity, delivery capability, certification capability and local service capability. In large power transformers, converter transformers, medium- and high-voltage distribution equipment for data centers, oil-immersed distribution transformers and high-efficiency low-loss products, supply-demand mismatch is reshaping pricing, lead times and competitive dynamics.
1. Executive Summary and Key Conclusions
The global transformer market is entering a new expansion cycle, but market-size estimates vary by definition. MarketsandMarkets estimates the global transformer market at about USD 64.64 billion in 2025 and USD 88.48 billion in 2030, implying a CAGR of about 6.5%. Fortune Business Insights estimates USD 70.9 billion in 2025 and USD 158.47 billion by 2034, implying a CAGR of about 8.78%. A combined reading suggests that the broad global transformer market in 2025 is roughly in the USD 65-71 billion range.
Grid investment is the center of demand. The IEA notes that global grid investment is currently around USD 400 billion per year but needs to rise toward more than USD 600 billion per year by 2030. By 2040, more than 80 million kilometers of power grids need to be added or refurbished globally. This means transformer demand will come not only from new power capacity, but also from distribution-network modernization, interregional transmission and replacement of aging assets.
Supply elasticity for large power transformers is clearly lower than demand elasticity. Large power transformers are highly customized and involve engineering design, core materials, testing and certification, heavy transport, installation and site commissioning. IEA research indicates that procurement lead times for large power transformers can reach up to four years, and supply tightness is likely to continue supporting the value of long-cycle orders.
The growth logic of distribution transformers is shifting from urbanization to electrification, distributed energy and load restructuring. The U.S. Department of Energy describes distribution transformers as foundational modules of the grid, while also noting long lead times and component shortages. Residential and commercial loads, EV charging, heat pumps, rooftop solar and energy storage are making capacity, efficiency and monitoring capability new competitive priorities on the distribution side.
Asia-Pacific remains the largest market, while China has advantages on both the demand and manufacturing sides. Fortune Business Insights estimates that Asia-Pacific accounted for 30.43% of the global transformer market in 2025. China invested RMB 608.3 billion in grid projects in 2024, up 15.3% year on year, and invested RMB 204.0 billion in grid projects during January-May 2025, up 19.8% year on year.
The cost structure sets the price floor, while delivery capability creates the premium. Transformer costs are strongly influenced by grain-oriented electrical steel, amorphous alloy, copper, aluminum, insulation materials, transformer oil, tank structures and testing capacity. Short-term price fluctuations depend on materials, medium-term price resilience depends on capacity and lead times, and long-term competition depends on loss levels, reliability and total lifecycle cost.
Technology is moving toward high efficiency, low loss, environmentally friendly insulation, digital monitoring and specialization. The EU and the United States have strengthened efficiency requirements for distribution and power transformers, encouraging low-loss cores, natural ester insulating fluids, fire-safe dry-type products, online monitoring, converter transformers and products dedicated to data centers.
Chinese suppliers have a larger export opportunity, but low price alone is not enough. Medium- and low-voltage distribution products, package substations, industrial transformers and renewable step-up applications are easier entry points for Chinese companies. Large power transformers and critical grid projects in Europe and North America require stronger certification, project references, financial credibility, local service and compliance capability.
2. Global Market Size: From Routine Electrical Procurement to Grid Bottleneck Category
Transformer market sizing must distinguish between two definitions. The first is the broad transformer market, usually covering power transformers, distribution transformers, dry-type transformers, special transformers and some industrial transformers. The second is a narrower segment definition focused on power transformers or distribution transformers. Under the broad definition, the global market in 2025 is around USD 65-71 billion. Under segment definitions, power transformers and distribution transformers together already exceed USD 50 billion.
The market outlook for the next three to five years is relatively clear. Grid investment has public-utility attributes and long planning cycles, so it does not rise and fall as quickly as consumer electronics or real-estate-linked supply chains. Even if some renewable projects are delayed by grid-connection, financing or policy issues, replacement of aging grids, load growth, data centers and industrial power demand will continue to support transformer orders.
Unlike the previous infrastructure cycle, this round of transformer demand has a clear feature of constrained growth. Grid projects, data centers, semiconductor fabs, energy storage plants and large renewable energy bases all need to lock in transformer supply at an earlier stage. Transformers are evolving from supporting equipment in engineering projects into key long-lead assets that affect project commissioning schedules.
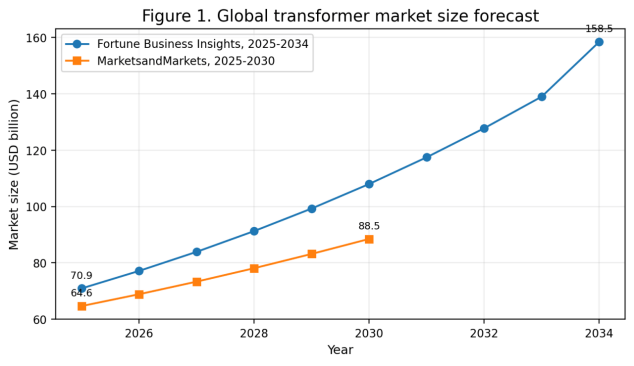
Figure 1. Global transformer market size forecast
Note: The chart shows market ranges and trends and should not be interpreted as a single deterministic forecast.
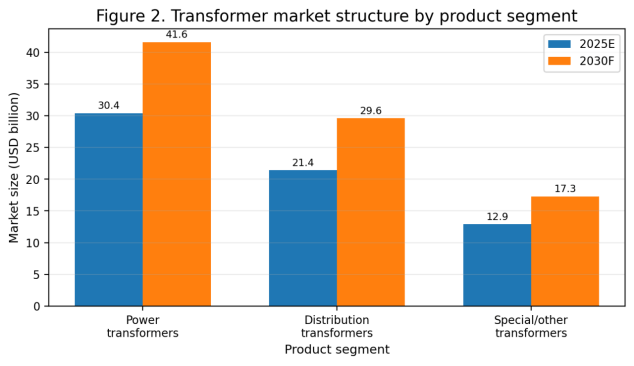
Figure 2. Transformer market structure by product segment
Note: Power transformer and distribution transformer values are based on public summaries cited in the original article; special/other transformers are estimated by the broad-market residual.
Table 1. Comparison of major public market-size estimates
|
Market definition |
2024/2025 baseline |
Forecast year |
Forecast size |
Notes |
|
Broad transformer market (MarketsandMarkets) |
2025: USD 64.64 billion |
2030 |
USD 88.48 billion |
Includes power, distribution and other transformers; CAGR about 6.5%. |
|
Broad transformer market (Fortune Business Insights) |
2025: USD 70.9 billion |
2034 |
USD 158.47 billion |
Higher growth estimate; CAGR about 8.78%. |
|
Power transformer market (MarketsandMarkets) |
2024: USD 28.88 billion; 2025: USD 30.38 billion |
2030 |
USD 41.62 billion |
Mainly three-phase power transformers and utility demand. |
|
Distribution transformer market (MarketsandMarkets) |
2025: USD 21.40 billion |
2030 |
USD 29.57 billion |
Driven by distribution grid modernization, renewable energy and aging-equipment replacement. |
3. Demand Drivers: Grid Investment, Load Growth, Energy Transition and Aging-Asset Replacement
The first source of this transformer demand cycle is catch-up investment in power grids. According to the IEA, to meet national energy and climate targets, more than 80 million kilometers of grids need to be added or refurbished globally by 2040, a scale comparable to the total length of today's global power grid. Such grid upgrades require not only conductors, towers and switchgear, but also large volumes of step-up, step-down, distribution, converter and special transformers.
The second driver is a change in the structure of electricity demand. Data centers, semiconductor fabs, rail transit, EV charging networks, industrial heat pumps, hydrogen electrolyzers and large-scale energy storage systems are shifting electricity demand from dispersed, low-intensity loads toward high-density and continuous loads that are more sensitive to power quality. Higher load density requires greater distribution-side capacity, while data centers and advanced manufacturing also require low-loss designs, high reliability, short lead times and spare-parts support.
The third driver is replacement of aging equipment. Transformers typically have long service lives, but high-load operation, harmonics, short-circuit shocks, insulation aging and extreme weather accelerate degradation. In mature grids in Europe and North America, many transformers are approaching or exceeding their design life. Replacement demand combined with new demand is moving the market from project-driven growth toward a three-layer demand structure: new installations, replacements and strategic spare inventory.
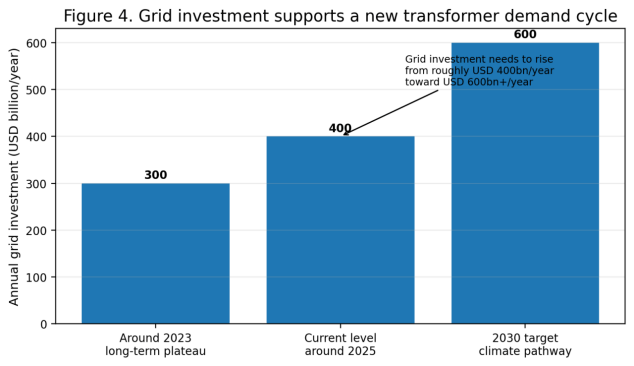
Figure 4. Grid investment supports a new transformer demand cycle
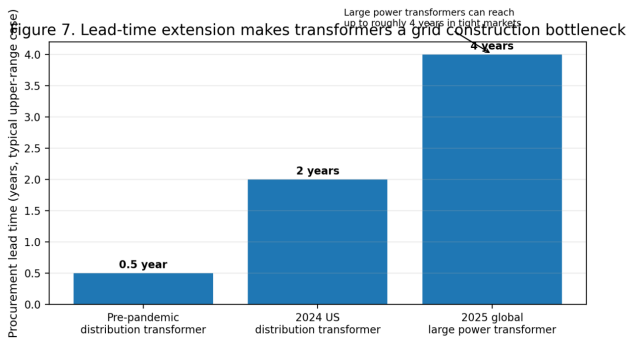
Figure 7. Lead-time extension makes transformers a grid construction bottleneck
4. Regional Market Pattern: Asia-Pacific Has the Largest Scale, Europe and North America Have the Highest Premiums, and Emerging Markets Offer Project Opportunities
The regional structure of the global transformer market is determined not only by power consumption, but also by grid investment schedules, equipment-replacement cycles, standards systems, localization requirements and project financing capacity. Asia-Pacific is the largest market because China, India, Southeast Asia and parts of the Middle East are still expanding power infrastructure. North America and Europe have mature grids, but aging-equipment replacement, data centers, electrification and policy-driven grid upgrades are generating high-value orders.
In 2025 market-share terms, Asia-Pacific accounts for about 30.43%, North America about 27.41%, Europe about 22.05%, the Middle East and Africa about 15.69%, and Latin America and other regions about 4.42%. This indicates that transformers are no longer a single-region manufacturing category. They are globally tight grid infrastructure assets, with clear differences in regional demand characteristics.
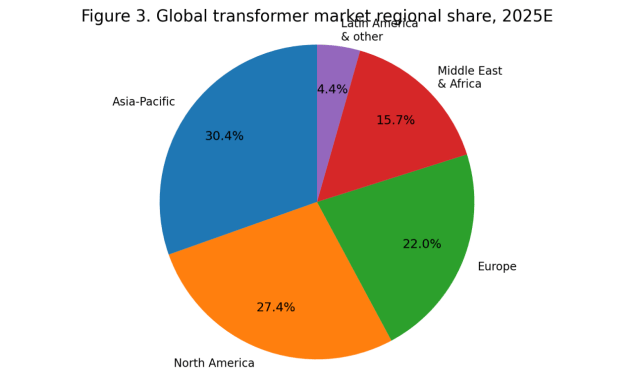
Figure 3. Global transformer market regional share, 2025E
Table 2. Key regional demand, procurement features and opportunities for Chinese suppliers
|
Region |
Major demand |
Procurement features |
Entry barriers |
Opportunities for Chinese suppliers |
|
China |
UHV transmission, distribution-network upgrades, renewable energy bases, data centers and industrial parks |
Centralized tenders by State Grid/China Southern Power Grid coexist with project-based procurement |
Quality, type testing, delivery references and cost control |
Large-project supporting supply, overseas references, smart and high-efficiency low-loss products |
|
North America |
Aging-equipment replacement, data centers, manufacturing reshoring and renewable integration |
Long-cycle framework orders; strong emphasis on local manufacturing and delivery certainty |
ANSI/IEEE standards, Buy America, UL/CSA and local service |
Medium-voltage distribution, components, joint ventures/factories and localized supply chains in Mexico/the United States |
|
Europe |
Distribution-grid upgrades, offshore wind, interconnected grids and energy-efficiency regulations |
High requirements for efficiency, low noise, environmental insulation and carbon footprint |
IEC/EU Ecodesign, environmental materials and bankability |
Low-loss dry-type transformers, natural ester oil, distribution-grid digitalization and supply-chain gap filling |
|
India |
Urbanization, manufacturing, grid expansion and renewable energy |
Price-sensitive market with rising localization requirements |
BIS certification, local production and after-sales service |
Technology licensing, components, distribution transformers and renewable step-up equipment |
|
Middle East |
Large power grids, oil and gas, electrolytic hydrogen, data centers and urban infrastructure |
EPC project chains are clear; delivery and certification are important |
Owner requirements, reviews by international consultants and extreme-environment design |
Package substations, oil-immersed power transformers and complete sets for mining, industrial and renewable projects |
|
Southeast Asia / Africa / Latin America |
Power access, mining, industrial parks and renewable energy |
Financing-driven projects with relatively long delivery cycles |
Payment security, O&M capability and local partners |
Medium- and low-voltage distribution, package substations, mining/port/industrial supporting products and EPC-linked exports |
5. China Market: One of the World's Largest Demand Scenarios and a Source of Manufacturing and Export Capability
The core support for China's transformer market comes from rapid growth in power capacity, high grid investment, changes in the renewable energy capacity mix and distribution-network upgrades. Data from China's National Energy Administration show that by the end of 2024, China's cumulative installed power generation capacity reached about 3.35 billion kW, up 14.6% year on year. Solar capacity reached about 890 million kW, up 45.2% year on year, and wind capacity reached about 520 million kW, up 18.0% year on year. In the same year, completed investment in grid projects reached RMB 608.3 billion, up 15.3% year on year.
In 2025, grid investment continued to grow rapidly. The National Energy Administration disclosed that during January-May 2025, China's cumulative installed power generation capacity reached 3.61 billion kW, up 18.8% year on year, while completed investment in grid projects reached RMB 204.0 billion, up 19.8% year on year. For the transformer industry, this means domestic demand is not driven only by replacement of existing stock, but also by renewable integration, distribution-network hosting capacity, energy storage connections, commercial and industrial loads and urban resilient-grid construction.
From an enterprise-structure perspective, China has a complete transformer value chain. Upstream segments include silicon steel, copper and aluminum materials, insulation materials and components; midstream segments include power transformers, distribution transformers, dry-type transformers, package substations and special transformers; downstream demand covers grid companies, power generation groups, EPC contractors, industrial users and overseas projects. The main shortfalls are global references for high-end and large-capacity products, international certification, local service networks and financial recognition in high-end projects.
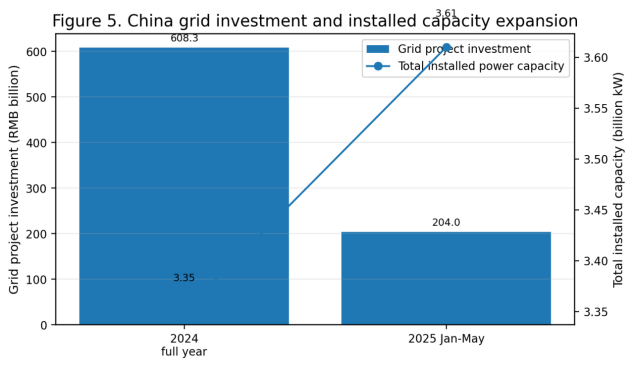
Figure 5. China grid investment and installed capacity expansion
6. Technology Routes and Product Evolution: Efficiency, Environmental Performance, Digitalization and Specialization Advance in Parallel
The main line of transformer technology evolution is not the replacement of one material by another, but systematic optimization around efficiency, reliability, safety, environmental impact and monitoring capability. Distribution transformers emphasize low loss, low noise, standardization and batch delivery. Large power transformers emphasize insulation systems, short-circuit withstand capability, partial-discharge control, oil-paper system life, transport, installation and site testing. Data centers, rail transit, mines, offshore wind farms and converter stations are driving specialized designs.
At the materials level, grain-oriented electrical steel remains the mainstream core material. Amorphous alloys have advantages in low no-load losses for distribution transformers, but they are limited by noise, mechanical properties, supply-chain conditions and manufacturing processes. For windings, copper has conductivity advantages, while aluminum has appeal in cost and weight. In insulation media, mineral oil remains mainstream, while natural and synthetic esters have more room to grow in fire-safety, environmental and high-temperature operating scenarios.
Digitalization does not simply mean adding sensors. It means building asset-management capability around oil temperature, winding hot spots, partial discharge, dissolved gas analysis, bushing condition, load curves and remaining-life assessment. For grid companies and large industrial users, the value of digital transformers lies in reducing unplanned downtime, optimizing maintenance cycles and improving asset utilization, rather than simply increasing the initial purchase price.
Table 3. Major technology routes and application scenarios
|
Technology/product route |
Advantages |
Limitations |
Major applications |
Market view |
|
Oil-immersed power transformer |
Large capacity, mature reliability and suitability for high-voltage levels |
Complex transport and installation; higher fire-safety and environmental requirements |
Transmission and transformation projects, power plants, step-up stations and heavy industrial loads |
Still mainstream, with clear supply tightness and lead-time constraints |
|
Oil-immersed distribution transformer |
Controllable cost, broad application and continuous efficiency improvement |
Low-end products are highly homogeneous |
Urban and rural distribution networks, parks and commercial/industrial users |
Large batch market, but upgrading toward high-efficiency low-loss products is required |
|
Dry-type transformer |
Good fire-safety performance and relatively convenient maintenance; suitable for indoor use |
Capacity and heat dissipation are limited, and cost is higher |
Buildings, data centers, rail transit and commercial complexes |
Data centers and urban distribution are driving demand growth |
|
Amorphous alloy transformer |
Low no-load loss and strong energy-saving performance |
Higher requirements for noise control, material supply and manufacturing process |
Distribution-network efficiency upgrades and low-load-rate scenarios |
Driven by efficiency regulations, but will not fully replace silicon-steel routes |
|
Natural/synthetic ester transformer |
High fire point, good environmental performance and potential life advantages |
Higher fluid cost and certification requirements |
Offshore wind, core urban areas and environmentally sensitive locations |
Applications are increasing in Europe, North America and high-end projects |
|
Converter/special transformer |
Adapted to HVDC, flexible DC and special industrial operating conditions |
High design barriers and long validation cycles |
UHVDC, offshore wind export systems and large industrial applications |
High technical barriers and high order value |
7. Cost and Price Trends: Materials Set the Floor, Lead Time Creates the Premium, and TCO Determines High-End Orders
Transformer prices are determined by material cost, manufacturing capability, testing capacity, quality assurance, delivery schedule and project risk. In general, core materials and winding materials account for the largest share. Fluctuations in grain-oriented electrical steel, amorphous alloy, copper and aluminum prices directly affect quotations. Transformer oil, insulating paper, bushings, tap changers, radiators, tanks and online-monitoring components affect reliability and added value. Large power transformers also require longer design, testing and transport cycles.
Current price pressure does not come only from raw-material increases. It also comes from tight supply and production scheduling. For large power transformers, core capacity cannot be created simply by expanding plant buildings. It also involves engineering design teams, winding equipment, vacuum drying capacity, large testing stations, transport routes, field installation teams and reference-project certification. For distribution transformers, batch-manufacturing efficiency, energy-efficiency standards, core-material supply and channel inventories are the key factors affecting prices.
From the buyer's perspective, the lowest price is not necessarily the best option. Transformers are typical lifecycle-cost assets. No-load losses, load losses, failure rates, outage losses, maintenance costs and replacement cycles should all be included in TCO evaluation. In industrial parks, data centers and renewable step-up stations with high load rates, high-efficiency low-loss products may provide better long-term economics even if their initial price is higher.
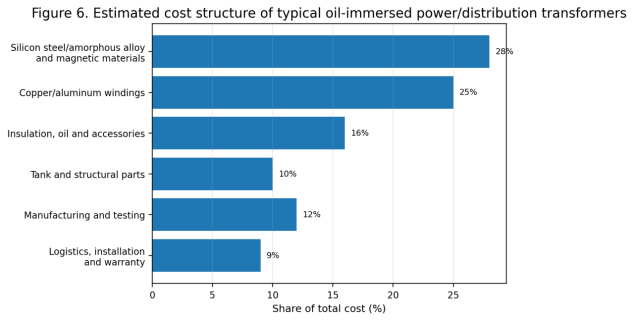
Figure 6. Estimated cost structure of typical oil-immersed power/distribution transformers
Table 4. Procurement price assessment framework
|
Price factor |
Short-term performance |
Medium- and long-term performance |
Procurement recommendation |
|
Silicon steel / amorphous alloy |
Quotations respond quickly to material price fluctuations |
Higher efficiency standards will raise demand for higher-grade materials |
Lock in material-price clauses and define loss guarantees clearly |
|
Copper / aluminum windings |
Copper price fluctuations have a large impact |
High-load-rate scenarios pay more attention to losses and temperature rise |
Avoid focusing only on initial price; calculate TCO |
|
Delivery cycle |
Short lead time creates a premium |
Production scheduling capability becomes a competitive barrier |
Lock in capacity early for critical projects |
|
Certification and testing |
Raises upfront cost |
Determines bankability in overseas projects |
Prioritize suppliers with references in the target market |
|
O&M service |
Low-price bids may reduce service budgets |
Affects equipment life and fault recovery |
Include spare parts, response time and monitoring in the contract |
8. Competitive Landscape: Global Leaders Are Expanding Capacity, While Chinese Suppliers Move from Manufacturing Exports to System-Level Exports
The global transformer market has a two-layer competitive structure. The first layer consists of large power transformers, converter transformers, high-end distribution equipment and industrial special transformers, where Hitachi Energy, Siemens Energy, GE Vernova/Prolec GE, Schneider Electric, Eaton, Toshiba, Hyundai Electric and Hyosung have strong influence. Their advantage is not just manufacturing; it is long-term grid references, standards certification, global service networks, supply-chain management and framework relationships with utility customers.
The second layer consists of regional and cost-competitive markets, including medium- and low-voltage distribution products, conventional oil-immersed transformers, dry-type transformers, package substations and industrial project support. Chinese suppliers have advantages in manufacturing efficiency, supply-chain completeness and engineering support. TBEA, China XD Electric, Baoding Tianwei Baobian Electric, Shandong Electrical Engineering & Equipment Group, Sanbian Sci-Tech and Sieyuan Electric have varying degrees of product and project experience in domestic grid, renewable energy, industrial and overseas markets.
It is worth noting that multinational companies are accelerating localized capacity expansion. Hitachi Energy announced additional investment in the United States in 2025 and continued to advance a previous USD 6 billion-level global manufacturing-capacity expansion program. Siemens Energy is building its first large power transformer manufacturing and refurbishment facility in the United States. GE Vernova, Hyosung HICO and others are also expanding or integrating transformer assets in the United States, Vietnam and India. This means future overseas competition will not be only about price; it will also be about local delivery capability and supply security.
Table 5. Major global competitive tiers
|
Competitive tier |
Representative companies |
Major advantages |
Competitive pressure |
|
Global high-end grid equipment leaders |
Hitachi Energy, Siemens Energy, GE Vernova, Schneider Electric, Eaton |
High-voltage/EHV references, international certification, global service and customer relationships |
Tight lead times, high costs and long capacity-expansion cycles |
|
Japanese, Korean and regional strong manufacturers |
Toshiba, Hyundai Electric, Hyosung, Mitsubishi Electric and others |
High-end manufacturing, North American and Asian market experience and stable quality |
Need to keep expanding capacity and respond to European and North American localization requirements |
|
Large integrated Chinese companies |
TBEA, China XD Electric, Baoding Tianwei Baobian Electric, Shandong Electrical Engineering & Equipment Group and others |
Complete value chains, cost control and rich domestic engineering references |
High-end overseas project certification and local service still need strengthening |
|
Chinese medium/low-voltage, distribution and package-substation suppliers |
Sanbian Sci-Tech, Jinpan Technology, Shunna Electric, Mingyang Electric and others |
Flexible delivery, product cost advantages and suitability for project support |
Overseas brand, quality traceability and channel capability vary significantly |
|
Local project-type manufacturers |
Local companies in India, the Middle East, Southeast Asia and Latin America |
Familiarity with local standards and owner relationships |
Limited technical depth and supply-chain stability |
9. Opportunities for Chinese Suppliers Overseas: From Selling Equipment to Delivering Bankable and Maintainable Grid Assets
Overseas opportunities for Chinese transformer suppliers can be divided into three groups. The first group is standardized distribution and commercial/industrial products, including oil-immersed distribution transformers, dry-type transformers, package substations and industrial transformers. These products are suitable for entering Southeast Asia, the Middle East, Africa and Latin America through agency channels, EPC support and industrial-park projects. The second group is renewable-project supporting equipment, including solar step-up transformers, wind step-up transformers, energy-storage transformers and prefabricated substation equipment. These are suitable for overseas expansion with Chinese EPC contractors, developers and equipment companies. The third group is high-end grid projects, including high-voltage/EHV power transformers, converter transformers and special transformers, which require international references, type testing, insurance recognition and local O&M capability as entry points.
In overseas markets, buyers care not only about equipment price but also about loss guarantees, short-circuit withstand capability, partial-discharge levels, temperature rise, noise, fire safety, environmental performance, transport plans, site installation, spare parts, warranties and fault response. In large owner projects in Europe, North America and the Middle East, international consultants, insurers and financing banks include brand, references and service capability in evaluation. If Chinese suppliers rely only on low-price entry, they may face higher risks in after-sales service, claims and long-term reputation.
From a trade-data perspective, UNSD classifies HS 8504 as including power transformers, liquid-dielectric transformers, other transformers, static converters and inductors. Therefore, when customs data are used to evaluate transformer exports, analysis should be refined to subheadings such as 850421, 850422, 850423 and 850431-850434. The total value of HS 8504 should not be directly treated as the value of transformer exports.
Table 6. Overseas priority and market-entry paths
|
Product direction |
Priority regions |
Entry approach |
Key capabilities |
Risk control |
|
Distribution transformers / package substations |
Southeast Asia, Middle East, Africa, Latin America |
Agency channels + EPC support + industrial-park projects |
IEC/local certification, batch delivery and spare-parts service |
Payment security and quality consistency |
|
Dry-type transformers |
Europe, Middle East and Asian markets with concentrated data centers |
Data-center, commercial-building and rail-transit project binding |
Low noise, fire safety, efficiency and temperature-rise control |
Certification, fire codes and project references |
|
Renewable step-up transformers |
Middle East, Latin America, Southeast Asia and Australia |
Bind with solar, wind and energy-storage EPC projects |
System design, short lead time and grid-connection adaptability |
Project delay and owner payment risks |
|
High-voltage power transformers |
North America, Europe, Middle East and Australia |
Local cooperation, joint ventures/factories and framework supply |
International references, testing stations and financial recognition |
Trade barriers and after-sales responsibility |
|
Converter / special transformers |
HVDC, offshore-wind export systems, mining and petrochemical heavy-load markets |
Deep binding with grid companies and large EPC contractors |
Customized design, type testing and system integration |
Long technical validation cycles and high compensation risk |
10. Risk Warnings: A High-Cycle Market Does Not Mean Low Risk
The high-cycle transformer market is attracting large amounts of capital and capacity, but this does not mean that all companies will benefit. Large power transformer capacity takes a long time to expand. If companies expand blindly without high-end references and certification, new capacity may concentrate in mid- and low-end markets and create localized price competition. Distribution transformers have broad demand, but product homogeneity is serious, and low-price competition may weaken quality and service capability.
Exporting companies must also pay attention to policy, trade and localization risks. The United States, the European Union, India and some Middle Eastern countries increasingly emphasize security of supply for critical grid equipment. Local manufacturing, origin rules, cybersecurity, carbon footprint, efficiency regulations and after-sales service all affect bid probability. For project-based markets, owner payment capacity, exchange-rate volatility, transport insurance, extreme-climate adaptation and installation/commissioning responsibilities are equally important.
Technical risks mainly come from power-electronics-based systems and renewable grid integration, which create harmonics, short-circuit current, overload and thermal-stability challenges. A U.S. Department of Energy report notes that large power transformers may be affected by higher-order harmonics from inverter-based resources. Harmonics increase stress on windings, insulation and cores and may shorten service life. Therefore, transformers for renewable energy, data centers and highly fluctuating industrial loads need stronger electromagnetic, thermal, insulation and monitoring design.
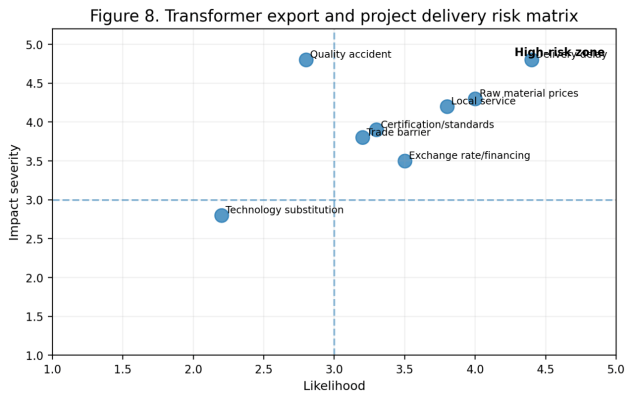
Figure 8. Transformer export and project delivery risk matrix
Table 7. Risk list and response strategies
|
Risk category |
Specific manifestation |
Impact |
Response strategy |
|
Raw-material risk |
Price fluctuations in silicon steel, copper, aluminum and insulation oil |
Unstable quotations and margin volatility |
Material-linked clauses, long-term procurement agreements and optimized design |
|
Delivery risk |
Tight production schedules, oversized transport and testing-station bottlenecks |
Project delays and claims |
Lock in capacity early; set milestones and spare-parts plans |
|
Certification risk |
Different requirements for IEC, IEEE, UL, CSA, Ecodesign and other standards |
Inability to enter target markets or high-end projects |
Move certification design and testing forward according to target-country requirements |
|
Quality risk |
Partial discharge, insulation aging and inadequate short-circuit withstand capability |
Outage incidents and brand damage |
Strengthen type testing, FAT/SAT and quality traceability |
|
Trade-barrier risk |
Tariffs, rules of origin and localization procurement requirements |
Higher costs or loss of bidding qualification |
Local cooperation, overseas factories and diversified supply chains |
|
O&M risk |
Slow overseas service response and insufficient spare parts |
Downtime losses and compensation exposure |
Build local service centers and remote monitoring systems |
11. Conclusion: Transformers Are Entering the Era of Grid Bottleneck Assets
Over the next three to five years, the core contradiction in the global transformer market will not be whether demand exists, but whether high-quality supply can keep pace with grid investment, load growth and the energy transition. Global grid investment needs to catch up, aging equipment in Europe and North America needs replacement, Asia-Pacific and emerging markets are still expanding, and the Middle East, data centers, semiconductor manufacturing and renewable energy bases continue to create high-load and high-reliability scenarios. Transformers are moving from traditional electrical equipment to critical bottleneck assets for grid expansion and industrial electrification.
For companies, opportunity should not be understood only as market-size expansion. Real competitiveness comes from four capabilities. First, product capability based on low losses, high reliability and multi-scenario adaptability. Second, manufacturing capability built on core materials, testing stations, production scheduling and quality traceability. Third, overseas project capability supported by certification, financial recognition, local service and spare-parts systems. Fourth, long-term value capability created by condition monitoring, lifecycle O&M and system integration.
For Chinese suppliers, the global transformer market still provides a clear export window. Medium- and low-voltage distribution products, package substations, dry-type transformers, renewable step-up transformers and industrial project support are easier directions for forming orders. Large power transformers, converter transformers and critical grid projects in Europe and North America require longer-term brand building, certification and localization. The companies that can move through the cycle will not be simple low-cost manufacturers, but global power-infrastructure suppliers capable of combining products, engineering, service and financial credibility.