2025 China Machine Tool Listed Companies' Revenue Reaches 143.99 Billion Yuan, Profit Up 73%
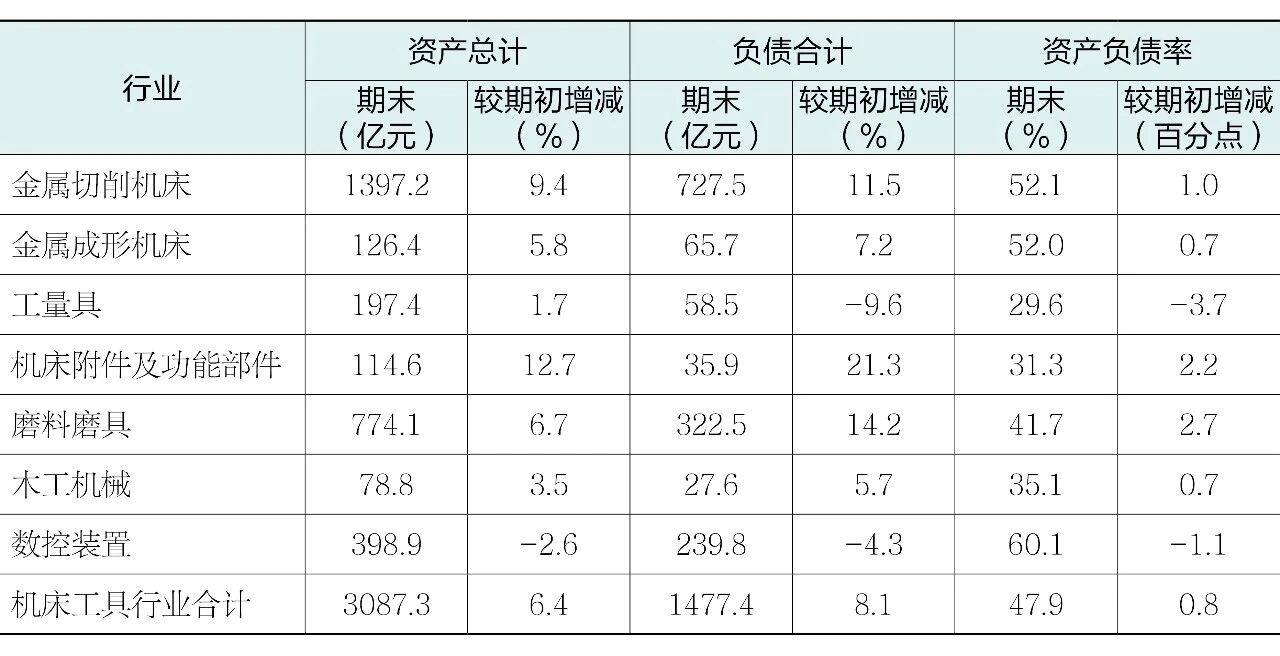
en.Wedoany.com Reported - As of the end of 2025, the total assets of 58 listed companies in the machine tool industry reached 308.73 billion yuan, an increase of 6.4% from the beginning of the year; total liabilities stood at 147.74 billion yuan, up 8.1% from the beginning of the year. The asset-liability ratio rose to 47.9%, an increase of 0.8 percentage points from the beginning of the year, with overall scale continuing to expand and liability growth outpacing asset growth by 1.7 percentage points.
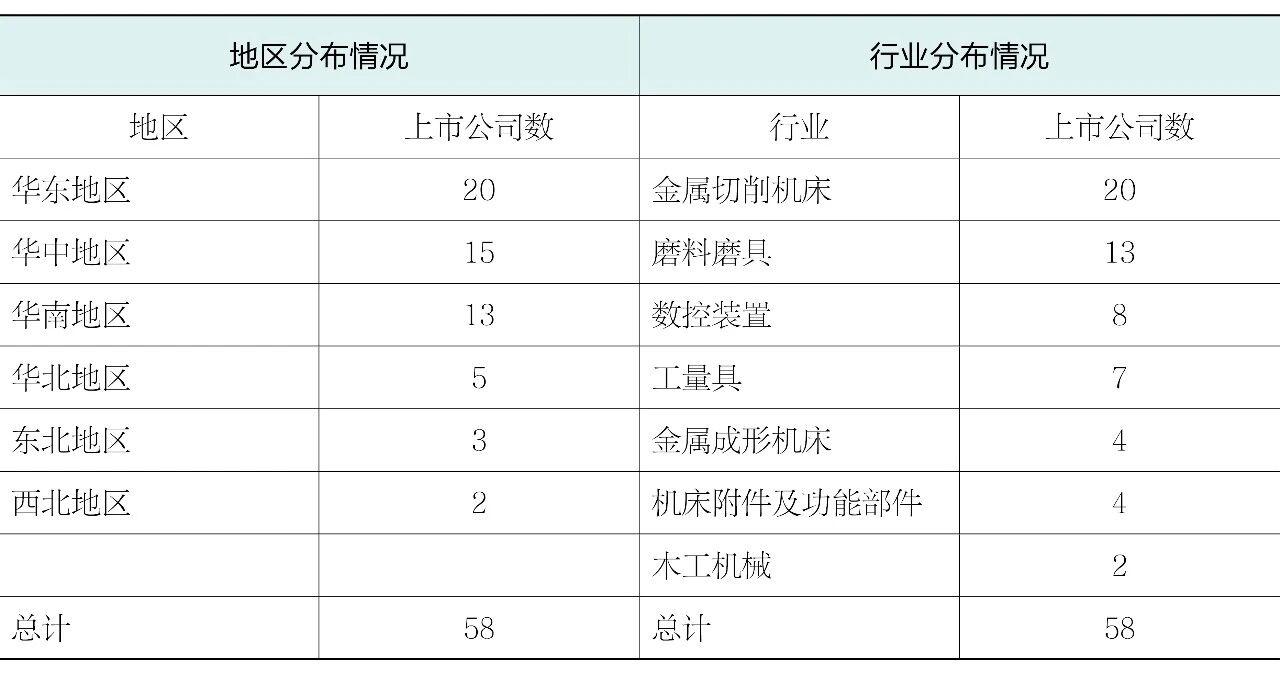
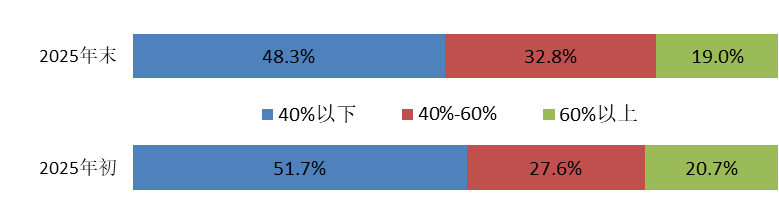
Among the 58 listed companies, 23 are on the Shenzhen Stock Exchange (SZSE) Main Board, 22 on the ChiNext Board, 4 on the Shanghai Stock Exchange (SSE) Main Board, and 9 on the SSE STAR Market. By industry segment, the numerical control device sub-sector had the highest asset-liability ratio (60.1%), while the tool and measuring instrument sub-sector had the lowest (29.6%). At the enterprise level, 35 companies saw their asset-liability ratios increase from the beginning of the year, accounting for 60.3%; the number of companies with an asset-liability ratio exceeding 70% at the end of the period decreased from 8 at the beginning of the year to 6, with the highest value at 91.4%, and no cases of insolvency.
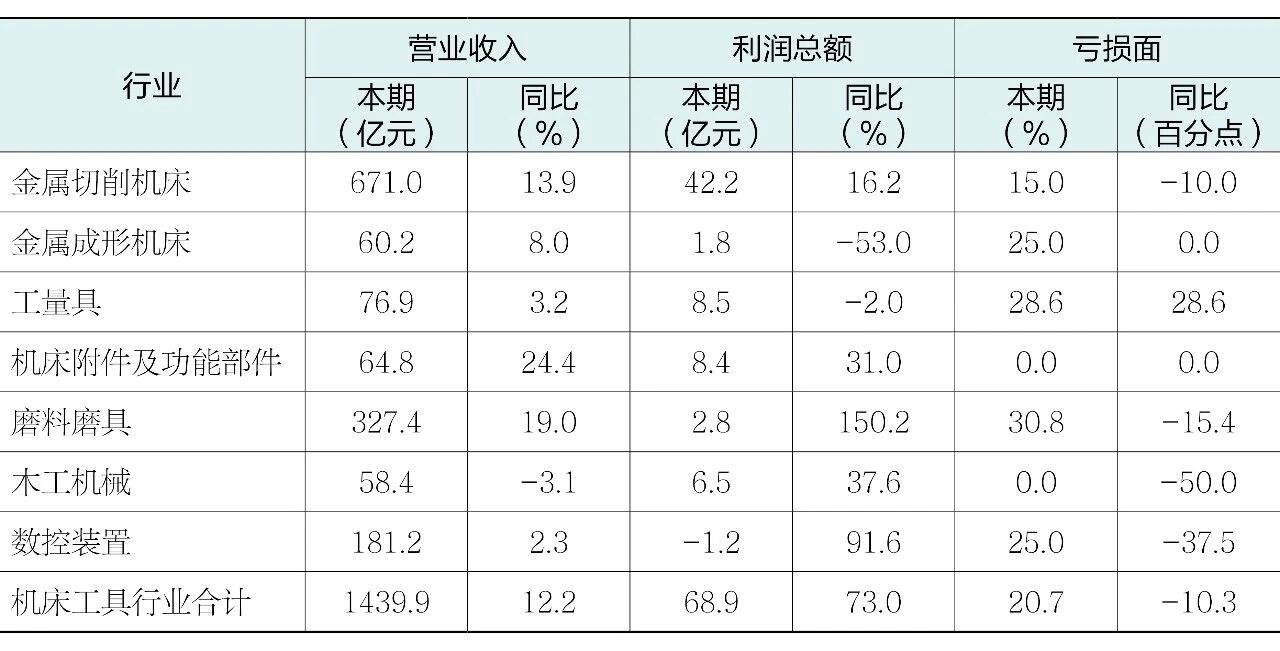
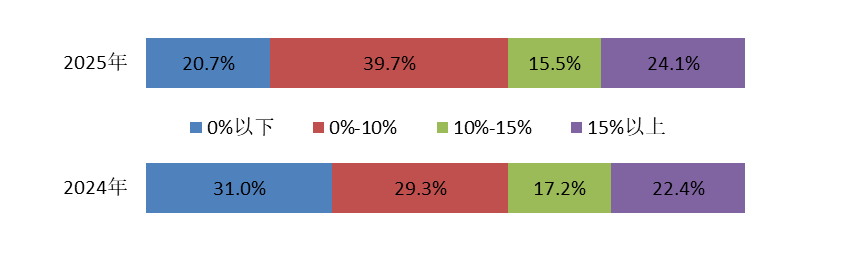
In 2025, the total operating revenue of listed companies in the industry reached 143.99 billion yuan, a year-on-year increase of 12.2%, with 40 companies achieving year-on-year growth (accounting for 69.0%). Total profit reached 6.89 billion yuan, a year-on-year increase of 73.0%, with 33 companies reporting year-on-year growth (accounting for 56.9%). The overall operating revenue growth rate was the highest since 2022, reversing the downward trend of the previous year; total profit also reversed its decline since 2022, returning to a growth trajectory. However, the proportion of companies with profit growth (56.9%) was significantly lower than that of companies with revenue growth (69.0%), indicating that the phenomenon of revenue growth without profit growth remains prominent. The loss-making ratio was 20.7%, narrowing by 10.3 percentage points year-on-year; the total loss amount of loss-making enterprises decreased by 2.36 billion yuan compared to the same period last year, alleviating overall operational pressure.
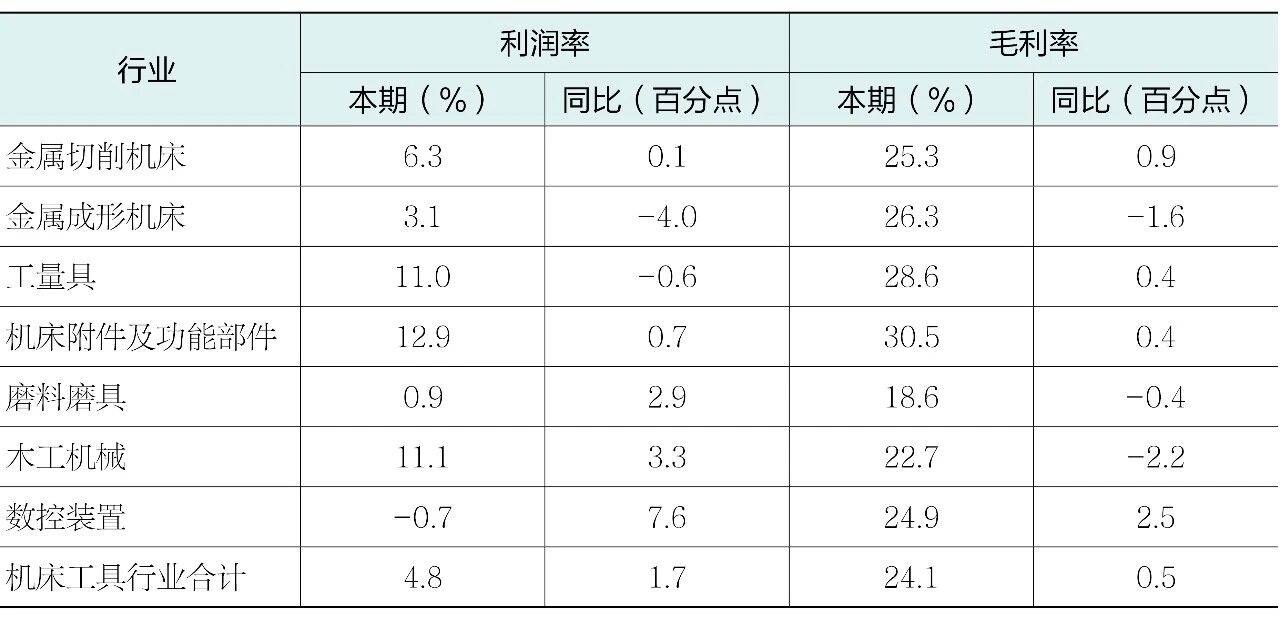
The average profit margin was 4.8%, an increase of 1.7 percentage points year-on-year; the gross margin was 24.1%, an increase of 0.5 percentage points year-on-year. Although both indicators improved year-on-year, they remained at the second-lowest level in the past five years. Among them, the profit margin and gross margin of the metal forming machine tool sub-sector both declined year-on-year. In terms of profit margin distribution, the proportion of loss-making enterprises decreased by 10.3 percentage points, while the proportion in the 0%-10% profit margin range increased by 10.3 percentage points.
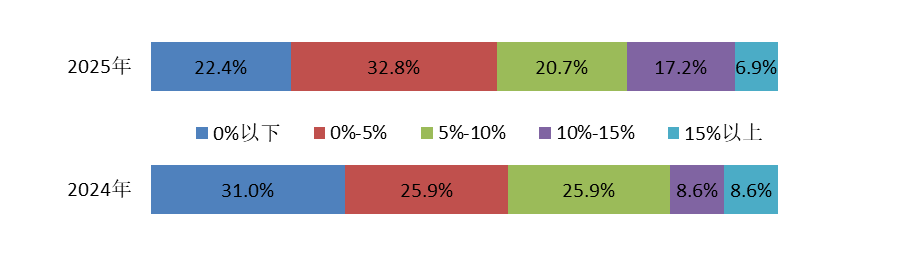
The weighted average return on equity (ROE) increased year-on-year for 50.0% of companies and decreased for the other 50.0%. In terms of ROE distribution, the proportion in the below 0% range decreased by 8.6 percentage points, the 0%-5% range increased by 6.9 percentage points, the 5%-10% range decreased by 5.2 percentage points, the 10%-15% range increased by 8.6 percentage points, and the above 15% range decreased by 1.7 percentage points.
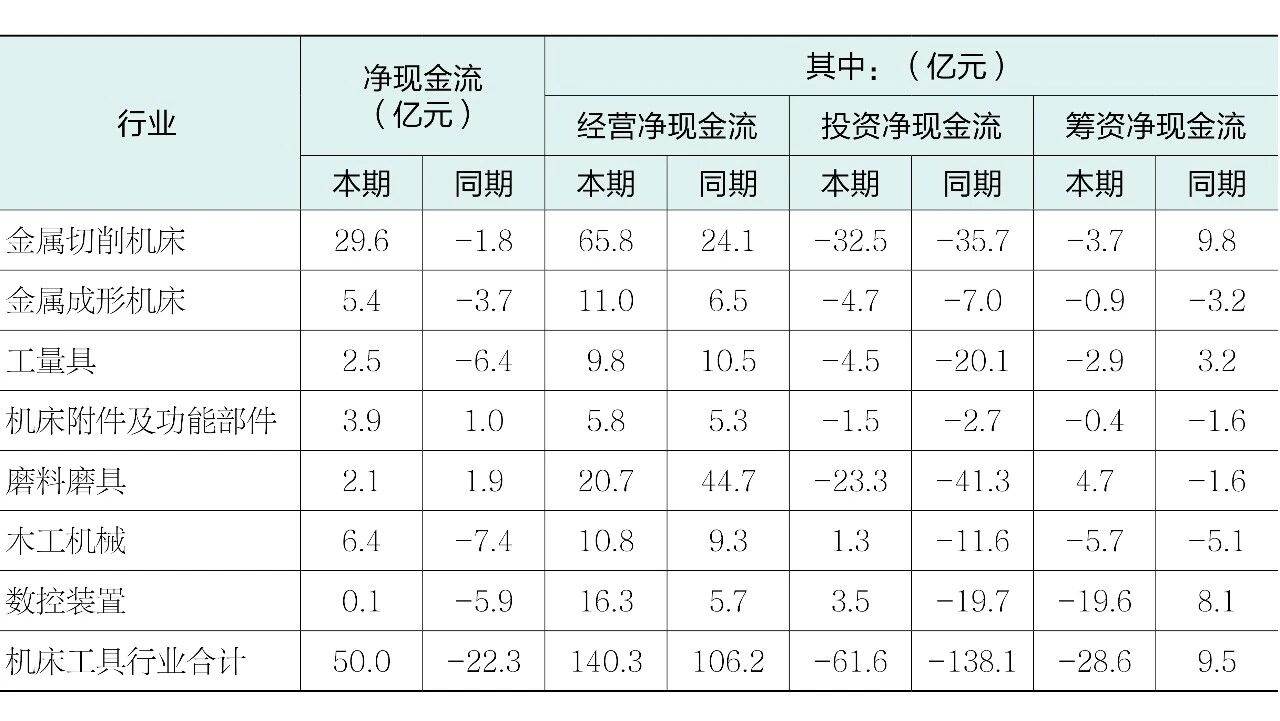
Net cash inflow from operating activities was 14.03 billion yuan, an increase of 3.41 billion yuan year-on-year, with 50 companies achieving net inflows (accounting for 86.2%), indicating synchronized improvement in sales collections and a stable operational foundation. Net cash outflow from investing activities was 6.16 billion yuan, a decrease of 7.65 billion yuan year-on-year, with the proportion of companies with net outflows dropping from 87.9% to 74.1%, indicating a significant slowdown in investment intensity. Cash flow from financing activities shifted from a net inflow in the same period last year to a net outflow of 2.86 billion yuan, with 44 companies reporting net outflows (accounting for 75.9%), as companies actively reduced financial leverage and reliance on external financing.
Overall, in 2025, the operational fundamentals of listed companies in the machine tool industry recovered and improved, with operating revenue returning to growth, a significant increase in the net asset growth rate, both profit margin and gross margin increasing year-on-year, and the loss-making ratio narrowing. The turnover rates of accounts receivable and inventory accelerated, and profitability and collection capabilities improved simultaneously. Compared with the overall industry, the year-on-year growth rates of operating revenue and total profit for listed companies were 10.6 and 14.4 percentage points higher, respectively, and the profit margin was 0.8 percentage points higher, indicating operational performance better than the industry average.
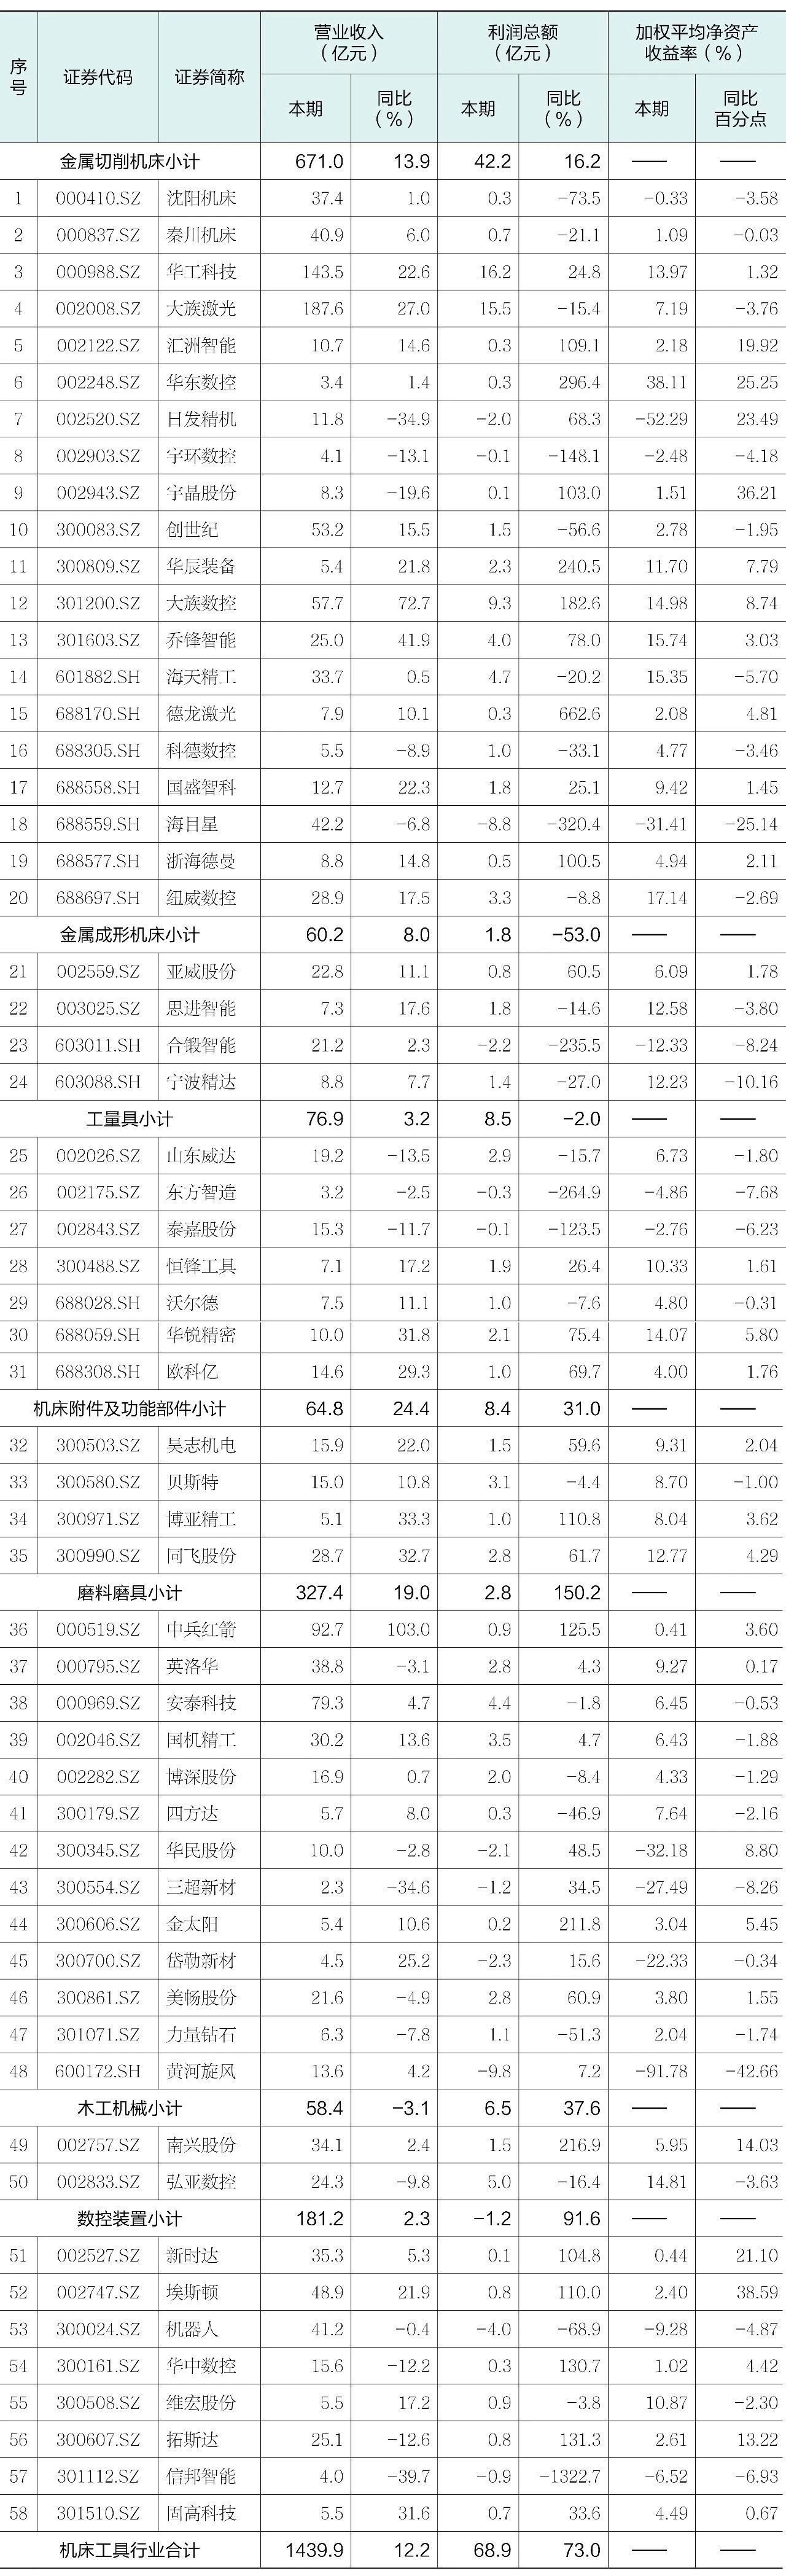
Note: In this article, some indicators may show that the total does not equal the sum of sub-items, and year-on-year or change data may not match the calculated results of absolute data in the reporting and base periods in the table, due to data rounding.
Related Products

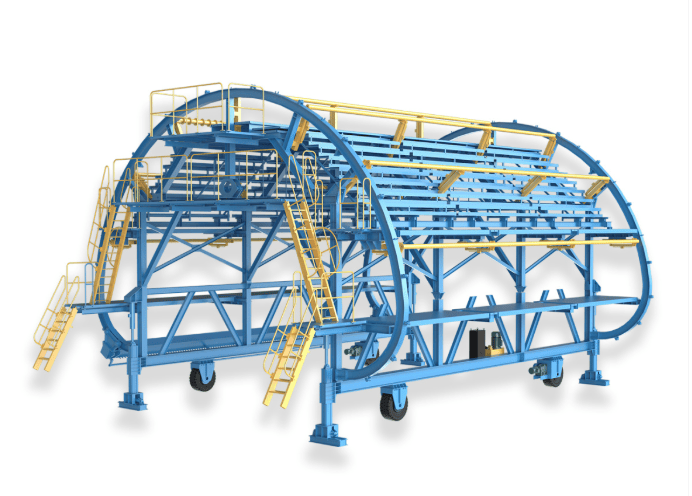
QLZNGJ Intelligent Steel Reinforcement Trolley
Luoyang China Railway Qiangli Machinery Co., Ltd.


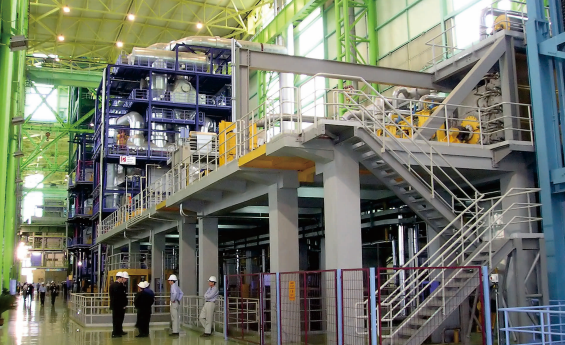
Strip Coating and Plating Production Line Equipment
MCC-SFRE HEAVY INDUSTRY EQUIPMENT CO., LTD.
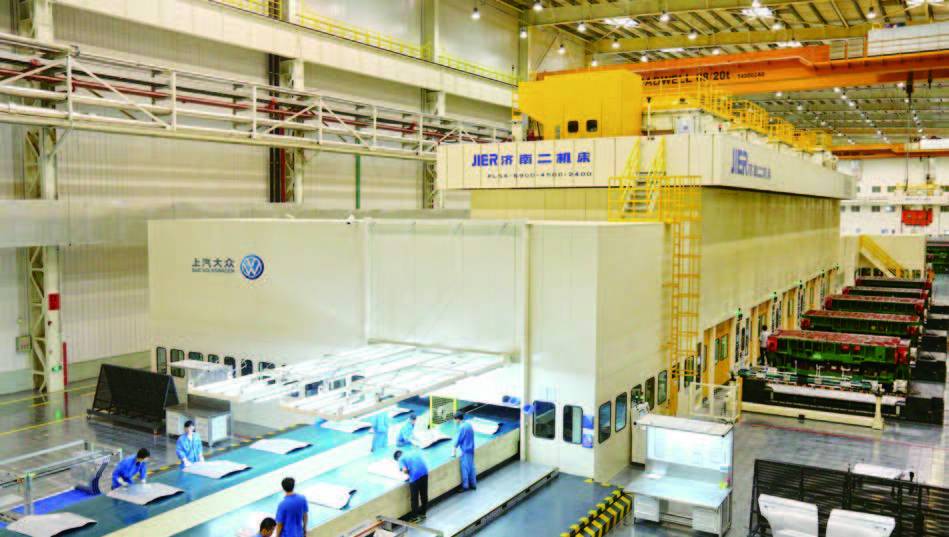
High-Speed Flexible Fully Automatic Stamping Production Line
JIER Machine-Tool Group Co., Ltd.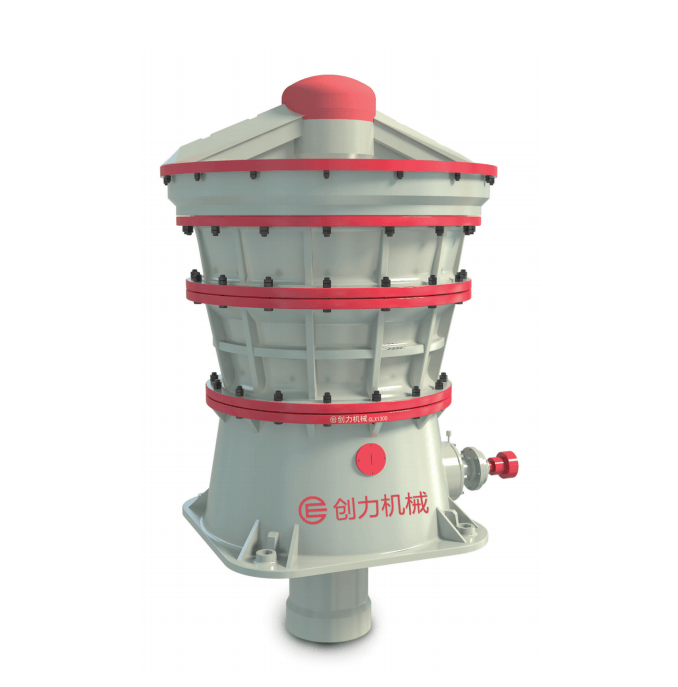
CLX Series Intelligent Hydraulic Gyratory Crusher
Guangdong CHUANGLI intelligent machinery Equipment Co., LTD