Executive Summary
The global industrial robotics market is undergoing a structural transformation that goes well beyond the headline installation figures. In 2024, worldwide installations reached 542,000 units — the second-highest annual total on record — while the operational stock surpassed 4.66 million units. Yet the more consequential story is not about volume: it is about how the competitive dynamics, technology stack, and regional demand architecture are being rewritten simultaneously.
China has become the first market where domestic robot manufacturers outsold foreign suppliers, capturing 57% of their home market. Average selling prices have fallen from approximately USD 31,100 per unit in 2018 to roughly USD 25,600 in 2024, compressing margins across the established supplier base. At the same time, collaborative robots, AI-enabled vision systems, and mobile manipulation platforms are opening applications that go far beyond the traditional automotive welding cell. Welding robots remain essential in high-volume production lines, but the market is diversifying rapidly.
Key findings from this analysis:
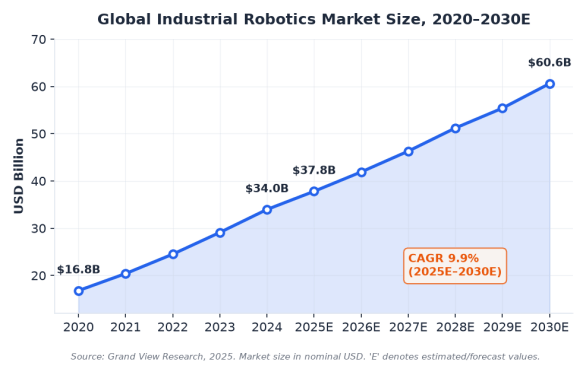
- Market scale remains in expansion. Grand View Research valued the global industrial robotics market at USD 33.96 billion in 2024, with a projected CAGR of 9.9% through 2030, reaching USD 60.56 billion. The broader robotics market — including service robots — was estimated at approximately USD 72.3 billion in 2025 and could surpass USD 145 billion by 2031.
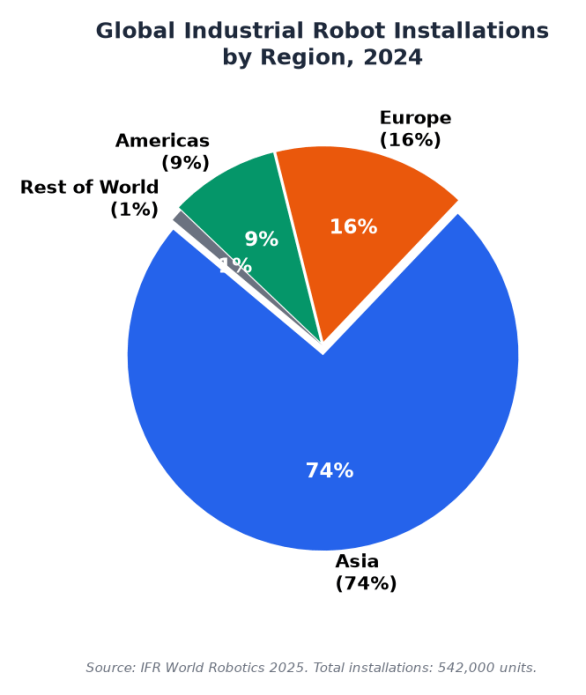
- Asia dominates — but for different reasons than five years ago. Asia accounted for 74% of global installations in 2024. China alone installed 295,000 units. However, growth is increasingly driven by domestic electronics manufacturing, logistics automation, and new energy sectors, rather than the automotive investment cycle that powered the previous decade.
- Robot density divergence is widening. South Korea leads with 1,012 robots per 10,000 manufacturing employees. China reached 470; the global average is 162. Markets with density below 100 — including India, Southeast Asia, and much of Latin America — represent the next wave of volume growth, but also require different product, pricing, and integration strategies.
- The price-cost compression cycle is accelerating. Core component costs for reducers, servo systems, and dedicated robot chips have declined 25–30% from 2020 levels. Industrial robot ASPs in China have fallen from approximately RMB 150,000/unit in 2020 to roughly RMB 100,000/unit in 2024. This is expanding the addressable market — particularly among SMEs — but squeezing profitability for manufacturers without scale or differentiation.
- The competitive order is being reshaped. The traditional "Big Four" — FANUC, ABB, Yaskawa, and KUKA — still command roughly 50% of global revenue, but their collective grip is loosening, especially in China. Chinese manufacturers Estun and Inovance have moved ahead of ABB in domestic shipment rankings. ABB's announced sale of its robotics division to SoftBank for USD 5.375 billion in 2025 is perhaps the clearest signal that the legacy competitive model is under pressure.
- Collaborative robots are the fastest-growing hardware segment. The cobot market was valued at approximately USD 2.95 billion in 2025 and is projected to reach USD 17.23 billion by 2033, at a 23.1% CAGR. Universal Robots, FANUC, and a wave of Chinese and European entrants are competing to define the category's price-performance frontier.
- AI and software are becoming the primary competitive differentiator. Vision-guided robotics, AI-based path planning, digital twin simulation, and predictive maintenance are shifting value capture from hardware margins to system-level productivity gains. Companies that control the software stack and data architecture are positioned to extract disproportionate value as robot fleets scale.
- Policy and trade friction are reshaping supply chains. US export controls on advanced robotics chips, EU AI Act compliance requirements taking effect in August 2025, and rising local-content mandates in markets like India and Brazil are fragmenting the once-global supply chain. Approximately 15% of the global robotics supply chain is affected by US-China export controls.
1. Global Market Scale & Growth Trajectory
The industrial robotics market has undergone a pronounced growth phase over the past five years, punctuated by two distinct dynamics: a volume-driven expansion in installations, and a concurrent revenue compression driven by falling average selling prices. According to Grand View Research, the global industrial robotics market reached USD 33.96 billion in 2024 and is forecast to grow to USD 60.56 billion by 2030, representing a compound annual growth rate of 9.9% over the 2025–2030 period.
Several research firms report varying estimates due to differences in scope and methodology. MarketsandMarkets estimates the 2024 market at approximately USD 17 billion in a narrower definition, while Fortune Business Insights places it at roughly USD 19.9 billion, projecting USD 55.5 billion by 2032 at a 14.2% CAGR. The range reflects different treatment of system integration, software, and aftermarket services revenues. For trend analysis, the Grand View Research dataset provides the most consistent longitudinal series.
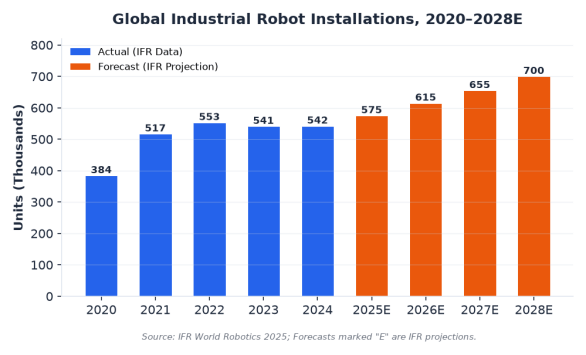
On the installation side, IFR data shows 542,000 industrial robots deployed globally in 2024 — the second highest year on record after the 553,000-unit peak in 2022. Annual installations have exceeded 500,000 units for four consecutive years. The global operational stock reached 4,664,000 units, up 9% year-on-year. IFR projects installations to reach 575,000 units in 2025 and exceed 700,000 by 2028, implying a roughly 10% average annual growth rate.
The broader robotics market — incorporating industrial robots, professional service robots, and consumer service robots — was estimated at approximately USD 72.3 billion in 2025, with professional service robots accounting for 44.9% of revenue (USD 32.5 billion), followed by industrial robots at 33.9% (USD 24.5 billion) and personal/domestic service robots at 21.2% (USD 15.3 billion). Logistics robots, including autonomous mobile robots and automated guided vehicles, now represent the single largest sub-segment within professional service robotics, driven by e-commerce fulfillment and warehouse modernization. This composition underscores a critical shift: service automation in logistics, healthcare, and hospitality is now a larger revenue pool than traditional factory-floor robotics.
2. Regional Market Dynamics
The global robotics market is highly concentrated geographically, but the character of demand in each region is diverging in ways that carry significant implications for suppliers, integrators, and policymakers.
Asia Pacific accounted for 74% of global industrial robot installations in 2024 and approximately 54% of total robotics market revenue in 2025, estimated at USD 39.1 billion. China is the dominant installation market with 295,000 units deployed — 54% of the global total — and became the first country to surpass 2 million units in operational robot stock. Domestic demand for industrial automation equipment has been fueled by Beijing's manufacturing upgrade policies, wage inflation in coastal provinces, and the rapid expansion of EV battery and electronics production. For the first time, Chinese domestic manufacturers outsold foreign competitors in the Chinese market, achieving 57% local market share, up from roughly 28% a decade ago.
Japan remains the second-largest market by installations (44,500 units in 2024), but growth has been sluggish at a 3% average annual rate since 2019. The country's position is anchored by its role as the world's largest robot manufacturer — Japanese firms account for approximately 38% of global robot production — rather than by domestic demand growth. South Korea's 1,012 robots per 10,000 manufacturing employees remains the world's highest robot density, driven by its electronics and automotive export sectors.
Europe contributed 16% of 2024 installations (approximately 85,000 units), with Germany leading at 26,982 units (32% of the European total). The European market has been shaped by near-shoring trends post-pandemic, with robot demand growing at a 3% annual average from 2019 to 2024. However, high energy costs and supply chain fragmentation are pushing European manufacturers toward higher automation investment, creating a structural demand floor even as cyclical manufacturing activity softens. The EU AI Act, which classifies industrial robots as high-risk systems requiring conformity assessments from August 2025, introduces a new regulatory layer that could slow deployment timelines in the near term.
The Americas accounted for 9% of installations (50,100 units) in 2024, with the United States at 34,200 units — a 9% decline year-on-year — representing 68% of the regional total. US robot density at 295 per 10,000 employees remains well below the Asian leaders, indicating substantial room for catch-up automation. Reshoring policies, notably the CHIPS Act and Inflation Reduction Act, are driving new manufacturing capacity that will require automation at scale. Mexico (5,600 units) and Canada (3,800 units) are positioned as near-shoring beneficiaries, particularly in automotive and electronics supply chains.
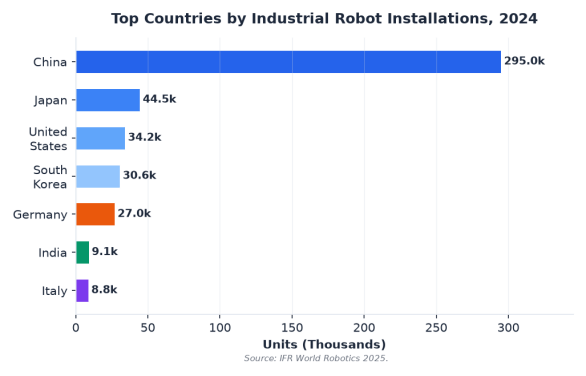
India installed 9,100 robots in 2024, a record high and a 7% increase year-on-year, driven largely by automotive manufacturing expansion. At fewer than 50 robots per 10,000 employees, India's density is among the lowest of major manufacturing economies, suggesting a long runway for volume growth. Southeast Asia — led by electronics manufacturing relocation from China — saw installations grow approximately 31.5% year-on-year, making it one of the fastest-growing regional sub-markets.
3. Technology Evolution & Product Segmentation
The robotics technology stack is undergoing its most significant architectural change since the introduction of electric servo-driven robots in the 1980s. Four interconnected trends are reshaping product roadmaps and competitive requirements.
Articulated robots — the six-axis workhorses of automotive and general manufacturing — still account for over 60% of industrial robot shipments by volume. Within this category, payload capabilities are bifurcating: heavy-payload models (above 200 kg) remain critical for automotive body shops and foundry applications, while light- and medium-payload arms (3–50 kg) are proliferating in electronics assembly, food processing, and laboratory automation. SCARA robots and collaborative robots are the fastest-growing sub-categories by unit volume, with annual growth rates exceeding 25% in select applications.
The collaborative robot segment deserves particular attention. Valued at approximately USD 2.95 billion in 2025 and projected to reach USD 17.23 billion by 2033 at a 23.1% CAGR, cobots are expanding the addressable market by lowering three traditional barriers to adoption: capital cost (with units starting below USD 20,000), integration complexity (through simplified programming interfaces), and safety infrastructure requirements (through force-limited design that eliminates the need for physical guarding in many applications). Universal Robots remains the category leader, but FANUC, ABB, and a growing cohort of Chinese and European entrants — including JAKA, Doosan, and Franka Emika — are rapidly closing the feature and reliability gap.
AI integration is perhaps the most transformative but least quantifiable trend. Smart sensors — including 3D vision cameras, torque-force sensors, and LiDAR — combined with deep learning algorithms now enable bin picking, quality inspection, and adaptive path planning that were impractical five years ago. AI-based predictive maintenance is reducing unplanned downtime by 20–30% in benchmark deployments. Generative AI is being applied to robot programming, potentially reducing the time and specialized skill required to commission new automation cells.
The competitive implication is clear: the value of a robot is increasingly determined by the software and data services layered on top of the hardware, not by the mechanical specifications alone. The field of intelligent robotics — encompassing perception, planning, and autonomous decision-making — is evolving faster than the traditional hardware refresh cycle, creating a dynamic where software updates can dramatically extend the useful life and capability of deployed robot fleets.
Mobile manipulation — the combination of autonomous mobile robots with robotic arms — is emerging as a new product category that blurs the line between traditional industrial robots and logistics automation. Applications in warehouse picking, machine tending, and laboratory automation are driving early adoption. This convergence is reshaping M&A strategies, with ABB's acquisition of Sevensense (3D vision for AMRs) and FANUC's AI path-planning investments signaling where the major players see the next wave of growth.
4. Supply-Demand Balance & Pricing Trends
The robotics market is in the midst of a pronounced price compression cycle that mirrors patterns seen in solar modules and lithium-ion batteries — rapid manufacturing scale-up, component standardization, and intensifying competition driving costs down faster than most industry forecasts anticipated.
According to Interact Analysis, the global average selling price of industrial robots declined from approximately USD 31,100 in 2018 to USD 25,600 in 2024 — a 17.7% cumulative decline. The pace of price erosion accelerated in 2024, with ASPs falling 3.6% year-on-year. Revenue contracted 5.8% in 2024 while unit shipments declined only 2.4%, confirming that price, not volume, is the primary drag on market revenue.
The cost structure is shifting at the component level. Prices for precision reducers, servo motors, and controllers — which collectively account for roughly 60–70% of robot bill-of-materials cost — have fallen 25–30% from 2020 levels due to manufacturing scale, Chinese domestic component supply, and design standardization. Dedicated robot controller chips saw an 18% average price decline in 2024 alone. These component-level cost reductions are creating room for robot OEMs to price aggressively while protecting gross margins.
The downstream effect of declining robot prices is a meaningful expansion of the addressable market. At RMB 100,000–120,000 (USD 14,000–17,000), a standard six-axis industrial robot is now within reach of small and medium-sized manufacturers that could not justify automation investment at previous price points. IFR data indicates SME robot procurement grew approximately 40% year-on-year in 2024. The typical payback period for an industrial robot installation has shortened from roughly 3.5 years in 2020 to approximately 2.2 years in 2024, making the investment case substantially more compelling.
However, the price compression is not evenly distributed. Heavy-payload, high-precision robots for automotive body-in-white applications retain stronger pricing power and higher margins, while standard six-axis arms for general handling applications are experiencing the most intense price competition, particularly in the Chinese market where over 100 domestic robot brands compete. The emerging dynamic is a two-tier market: commoditized standard robots with paper-thin margins for volume applications, and specialized, high-value systems where software, integration, and application knowledge command premium pricing.
5. Competitive Landscape
The competitive order in industrial robotics is being reshaped by three simultaneous forces: the rise of Chinese domestic manufacturers, the softening of traditional automotive demand, and the strategic recalibration of the legacy market leaders.
|
Company |
HQ |
2024 Robotics |
Est. Global |
Key Segment |
Strategic Note |
|
FANUC |
Japan |
5.1 |
~8% |
Industrial robots, CNC |
Expanding European factory; AI path-planning integration |
|
ABB Robotics |
Switzerland |
4.2 |
~7% |
Industrial & service |
Sold to SoftBank for $5.375B (2025); acquired Sevensense |
|
Yaskawa Electric |
Japan |
3.3 |
~5% |
Motion control, robots |
MOTOMAN-GP400R heavy-payload launch |
|
KUKA (Midea) |
Germany/China |
3.1 |
~5% |
Heavy-payload, smart factory |
iiQKA.OS platform; growing China market share to 8.2% |
|
Mitsubishi Electric |
Japan |
2.6 |
~4% |
Factory automation |
Alliance with Realtime Robotics |
|
Universal Robots |
Denmark |
0.5 |
<1% |
Collaborative robots |
UR30 light-payload cobot; category pioneer |
|
Estun Automation |
China |
~0.8 |
~1% |
Industrial robots |
No.2 in China shipments; rapid domestic share gain |
|
Inovance Technology |
China |
~0.6 |
~1% |
Industrial robots, drives |
No.3 in China shipments; SCARA market leader |
Table 1: Major industrial robot manufacturers — estimated revenue, market position, and strategy. Data compiled from Report Prime, MIR, and company filings, 2024–2025.
The most significant competitive development of 2025 was ABB's decision to sell its robotics division to SoftBank for USD 5.375 billion. The transaction reflects both the strategic logic of separating cyclical industrial automation from ABB's electrification and motion businesses, and the growing conviction — on SoftBank's part — that AI-driven, software-defined robotics will generate returns that justify premium multiples. Whether SoftBank can replicate its ARM Holdings playbook in robotics remains to be seen, but the deal has already triggered a re-rating of robotics assets across the sector.
In the Chinese market, the competitive transformation is particularly stark. According to GGII data, Chinese domestic brands captured 52.45% of the Chinese industrial robot market by unit volume in 2023, surpassing foreign suppliers for the first time. This share is expected to exceed 60% in 2025. FANUC's China robot revenue fell 48.9% in 2024; ABB's China robot and discrete automation revenue declined 12.4%. The foreign incumbents are not being displaced from high-end applications — automotive welding, for instance, remains dominated by the Big Four — but they are losing the volume battle in general industry applications where price sensitivity is higher.
6. Industry Application Segmentation
The application mix in industrial robotics is shifting away from its historical concentration in automotive manufacturing. Material handling is now the largest application segment, accounting for 42% of global industrial robot deployments in 2024, encompassing machine tending, palletizing, packaging, and warehouse automation. Welding remains critical, particularly in automotive, but its relative share is declining as general industry applications proliferate.
The electrical and electronics sector has emerged as the second-largest end-use vertical, driven by the precision assembly requirements of consumer electronics, semiconductor manufacturing, and battery production for electric vehicles and energy storage systems. This vertical is particularly important in Asia, where the electronics manufacturing supply chain is concentrated. Quality inspection is the fastest-growing application, expanding at a 13.8% CAGR, as AI-powered vision systems make automated inspection economically viable across a wider range of products and production speeds.
General industry — encompassing metals, plastics, food and beverage, pharmaceuticals, and logistics — now accounts for 53% of robot installations, surpassing automotive and electronics combined. This is a structural shift: the robotics industry is no longer a derivative play on automotive capital expenditure cycles. Food and beverage and life sciences demonstrated the strongest resilience during the 2023–2024 manufacturing downturn, while metals and plastics showed demand elasticity correlated with broader industrial production indices.
Looking ahead, three emerging application domains warrant attention. First, battery manufacturing for EVs and grid storage is creating demand for high-speed, high-precision robots in electrode production, cell assembly, and module packaging. Second, healthcare and medical device manufacturing is the fastest-growing end-use segment by revenue, accounting for over 27% of industrial robot expenditure in 2024, driven by surgical robotics, laboratory automation, and pharmaceutical production. Third, logistics and warehousing automation continues to absorb a growing share of both industrial robot and autonomous mobile robot deployments, fueled by e-commerce growth and labor availability constraints in major consumer markets.
|
Application |
2024 Share |
Growth Rate |
Key Regions |
Primary Driver |
|
Material Handling |
42% |
~10% |
Asia, N. America |
E-commerce, logistics automation |
|
Welding & Soldering |
~20% |
~5% |
Asia, Europe |
Automotive production, shipbuilding |
|
Assembly |
~12% |
~8% |
Asia (electronics) |
Consumer electronics, battery mfg |
|
Quality Inspection |
~8% |
~14% |
Global |
AI vision systems, traceability mandates |
|
Processing |
~8% |
~6% |
Asia, Europe |
Metal fabrication, plastics |
|
Cleanroom/Medical |
~5% |
~15% |
N. America, Europe |
Pharma GMP, surgical robotics |
|
Other |
~5% |
~7% |
Global |
Diverse |
Table 2: Industrial robot applications by segment. Shares and growth estimates compiled from Grand View Research, Mordor Intelligence, and IFR data, 2024–2025. Growth rates approximate; sources vary by segment definition.
7. Cost Structure & Investment Economics
The economics of robot adoption are improving across three dimensions: lower upfront hardware cost, shorter integration and commissioning time, and reduced ongoing maintenance expense. The net effect is that the robot — historically a capital-intensive, long-payback investment — is approaching the economic profile of general production equipment.
Cost breakdown for a standard six-axis industrial robot typically allocates 30–35% to the mechanical structure and precision reducers (RV and harmonic drives), 25–30% to servo motors and drives, 15–20% to the controller and software, and the remainder to cabling, end-effectors, installation, and integration. The largest cost reductions have occurred in reducers and controllers, where Chinese domestic suppliers (led by Leaderdrive, Shuanghuan, and Inovance) have achieved parity in performance with Japanese and European incumbents at 30–50% lower cost.
The Robot-as-a-Service (RaaS) model is gaining traction as an alternative to capital purchase. Under RaaS, customers pay a monthly or usage-based fee that covers the robot, integration, maintenance, and software updates, converting a capital expenditure into an operating expense. This model is particularly relevant for SMEs and seasonal operations where utilization rates may not justify outright purchase. RaaS revenue is growing at an estimated 25–30% annually, though from a small base, and is expanding the pool of potential automation adopters beyond well-capitalized large enterprises.
8. Policy, Trade Barriers & Regulatory Landscape
The regulatory environment for robotics is fragmenting along geopolitical lines, creating new compliance costs and market access barriers that suppliers must navigate. Three regulatory developments are particularly consequential in the 2025–2028 timeframe.
The EU AI Act, effective from August 2025, classifies industrial robots incorporating AI functions as high-risk AI systems. This requires conformity assessments, technical documentation, human oversight mechanisms, and transparency obligations for robots sold into the European market. The compliance burden is likely to favor established manufacturers with existing regulatory infrastructure over smaller entrants — potentially acting as a non-tariff barrier for Chinese robot exporters seeking to enter the European market.
US export controls on advanced semiconductors, expanded in October 2024, affect approximately 15% of the global robotics supply chain, particularly high-performance robot controllers and AI vision processors. While the immediate impact is concentrated in China-facing supply chains, the broader effect is to accelerate China's investment in domestic chip design and fabrication for robotics applications, potentially creating a bifurcated technology ecosystem over the medium term.
Local-content and localization requirements are proliferating in emerging markets. India's Production-Linked Incentive (PLI) schemes increasingly tie automation equipment procurement to domestic value addition. Brazil's industrial policy framework imposes local-content thresholds for automation equipment in government-supported projects. These requirements are reshaping market entry strategies: pure equipment export is giving way to joint ventures, local assembly, and technology licensing arrangements.
9. Risk Assessment
|
Risk Factor |
Severity |
Likelihood |
Impact Description |
Mitigation |
|
Price war intensification |
High |
High |
Further ASP erosion below $22,000 could push mid-tier OEMs into losses |
Vertical integration; software/services revenue mix shift |
|
Trade barrier escalation |
High |
Medium |
US/EU tariffs on Chinese robots would bifurcate global market |
Local assembly; JV partnerships; IP licensing |
|
Technology substitution |
Medium |
Low |
AI-native robot architectures could obsolete traditional controller designs |
R&D investment in AI and software platforms |
|
Demand cyclicality |
Medium |
Medium |
Manufacturing PMI downturn could compress installations 10–15% |
Diversify across end-use verticals and regions |
|
Regulatory compliance cost |
Medium |
High |
EU AI Act compliance adds 5–10% to EU-market product cost |
Proactive certification; dedicated compliance teams |
|
Supply chain concentration |
Medium |
Medium |
>60% of precision reducers sourced from Japan; geopolitical disruption risk |
Multi-source procurement; domestic alternative qualification |
|
Talent shortage |
Medium |
High |
System integrator and application engineer shortfall limits deployment velocity |
Training partnerships; simplified programming tools |
|
Financing environment |
Low |
Medium |
High interest rates raise cost of capital for robot procurement |
RaaS model adoption; leasing partnerships |
Table 3: Risk assessment matrix for the industrial robotics sector, 2025–2028. Assessment based on industry data, policy analysis, and corporate disclosures.
10. Robot Density: The Automation Gap
Robot density — measured as industrial robots per 10,000 manufacturing employees — is the most useful single metric for comparing automation maturity across countries. The global average reached 162 in 2024, more than double the 74 recorded in 2018, but the dispersion across countries tells the real story.
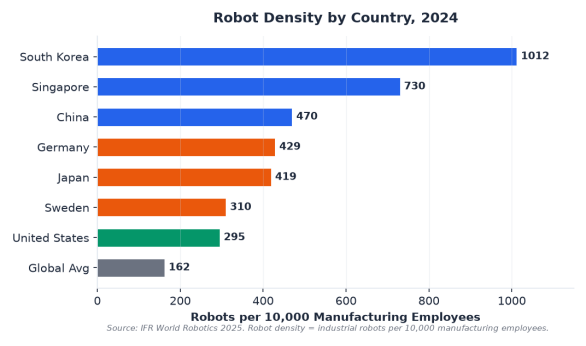
South Korea's density of 1,012 — more than eight times the global average — is sustained by the electronics and automotive sectors that dominate its manufacturing economy. Singapore (730) benefits from a concentrated electronics manufacturing base with a relatively small manufacturing workforce. China (470) has nearly quadrupled its density since 2018, driven by aggressive government automation policy and rising labor costs in coastal manufacturing provinces. Japan (419) and Germany (429) cluster closely at roughly 2.6× the global average, reflecting deep but mature automation penetration.
The United States, at 295 robots per 10,000 employees, sits below the European and Asian leaders — a gap that reshoring advocates have identified as both a vulnerability and an opportunity. If the US were to converge toward Germany's density level, it would require approximately 200,000 incremental robot installations over a multi-year investment cycle.
Markets with density below 100 — including India (sub-50), Vietnam, Indonesia, Brazil, and Mexico — represent the largest untapped automation potential. However, density alone is not destiny: labor cost structures, capital availability, manufacturing skill bases, and policy environments determine whether low density translates into rapid adoption or persistent structural barriers.
11. Outlook & Strategic Implications
The industrial robotics market is entering a phase where the old certainties — stable pricing, predictable regional demand patterns, and a clearly defined competitive hierarchy — no longer hold. The 2025–2030 period will be defined by several intersecting dynamics.
First, volume growth will remain robust. IFR's projection of installations exceeding 700,000 units by 2028 implies roughly 10% annual growth, and the broader robotics market should expand at 13–16% CAGR through 2031. The growth is structurally supported by demographic trends — aging workforces in Japan, Europe, and China; manufacturing labor shortages in the US and Southeast Asia; and the persistent economics of automating repetitive, hazardous, and precision-intensive tasks.
Second, revenue growth will diverge from unit growth. The price compression cycle is unlikely to reverse, meaning revenue-focused investors and analysts should look beyond top-line growth to gross margin durability, software and services revenue share, and return on invested capital. Companies that bundle hardware with proprietary software, data services, and recurring maintenance contracts are best positioned to maintain margins as hardware ASPs decline.
Third, the competitive battleground is shifting from hardware specifications to system-level productivity. A robot's value proposition is increasingly determined by ease of programming, MTBF (mean time between failures), parts availability, integration speed, and total cost of ownership — not by payload, reach, or repeatability specifications alone. This favors companies with deep application engineering capabilities, strong system integrator networks, and proven reliability track records over those competing primarily on hardware price.
Fourth, services — not hardware — will drive the next wave of value creation. Robot fleets generate continuous operational data. Companies that build platforms for fleet management, predictive maintenance, performance benchmarking, and process optimization are creating a recurring revenue layer that could ultimately exceed the hardware revenue pool. The analogy to industrial software — where the platform creates more value than the machine it runs on — is increasingly relevant to robotics.
For manufacturers, system integrators, and investors, the strategic implications are clear. Scale matters, but scale without software differentiation is a low-margin proposition. Regional presence matters, but only when combined with application expertise and service capability in each served market. Technology matters, but technology that does not reduce the customer's total cost per unit of output has limited commercial value. The companies that internalize these dynamics — and build organizations, product portfolios, and business models around them — will capture disproportionate share as the market doubles in size over the next five to seven years.
Conclusion
The global industrial robotics market is neither a simple growth story nor a commodity race to the bottom. It is an industry in transition from hardware-defined competition toward software- and service-defined value creation. The installation numbers — 542,000 units in 2024, heading toward 700,000+ by 2028 — confirm that automation demand is structural, not cyclical. But the revenue trajectory, the competitive order, and the geographic distribution of value capture are all being rewritten in real time.
China has emerged not just as the largest market but as the most competitive manufacturer of industrial robots, with domestic suppliers now commanding majority share at home and increasingly exporting to price-sensitive emerging markets. The traditional leaders — FANUC, Yaskawa, and KUKA — retain formidable technology and reliability advantages, particularly in high-precision and heavy-payload applications, but face growing pressure to demonstrate value beyond hardware specifications. ABB's exit from robotics ownership marks a structural inflection point that will reshape industry dynamics for years.
For market participants across the value chain, the critical question is no longer whether automation will grow, but who will capture the economic returns from that growth as hardware commoditization proceeds. The answer will favor companies that build defensible positions in software platforms, application engineering, service networks, and vertical-specific solutions — not those that simply produce more robots at lower cost.
Data Sources & Methodology
This report draws on publicly available data from the following sources. All market size, installation, and forecast figures are sourced from the organizations cited. Where multiple sources provide differing estimates, ranges are noted and the basis for divergence explained.
- International Federation of Robotics (IFR) — World Robotics 2025: installation data, operational stock, robot density, regional breakdowns, and forecasts.
- Grand View Research — Industrial Robotics Market Size, Share & Trends Analysis Report, 2025–2030: market sizing and CAGR estimates.
- MarketsandMarkets — Industrial Robotics Market, 2025: market size and segmentation.
- Fortune Business Insights — Industrial Robots Market Report, 2025: market size estimates and CAGR.
- Interact Analysis — Global Industrial Robot Market Report, 2025: ASP trends, shipment data, and regional analysis.
- Report Prime — Robotics Market Company Rankings, 2025: competitive revenue and market share estimates.
- MIR Databank / GGII — China industrial robot shipment and market share data, 2024.
- PW Consulting — Worldwide Industrial and Service Robot Market Research, 2026: total robotics market sizing.
- European Commission — EU AI Act regulatory framework and compliance requirements.
- US Bureau of Industry and Security — semiconductor export controls applicable to robotics.
- Company filings: FANUC, ABB, Yaskawa, KUKA (Midea Group), Estun Automation, Inovance Technology — annual reports and investor presentations.
Methodological note: Different research organizations employ varying definitions of 'industrial robotics,' differing treatment of system integration and software revenue, and different geographic coverage. Market size figures should be interpreted as indicative of trends and scale rather than precise point estimates. All forecasts are marked with 'E' (estimated) and represent projections, not guarantees. This report is intended for industry analysis and trend assessment, not as investment advice.
Related Products
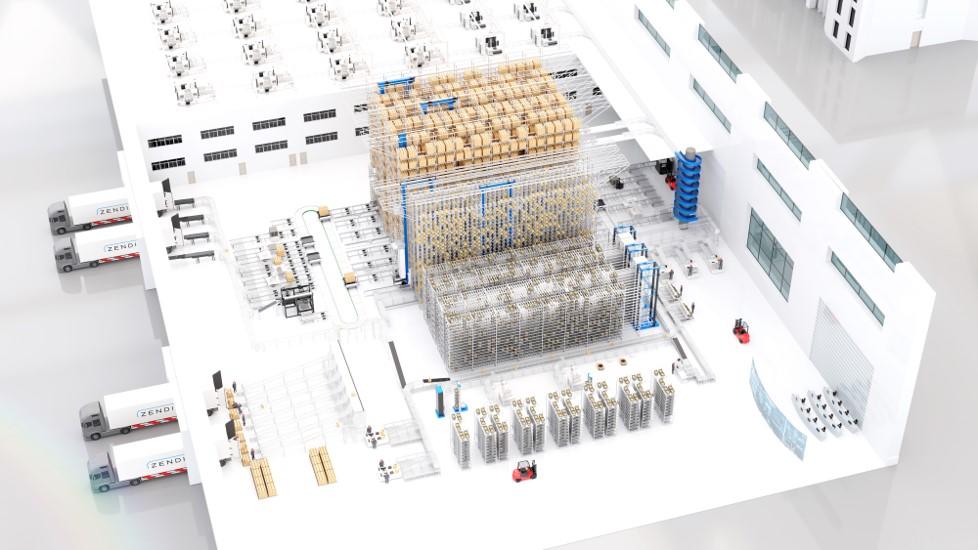

One-Stop Steward Service for the Entire Logistics System Integration Chain
Zhongding Intelligent (Wuxi) Technology Co., Ltd.
MUX Series Communication Interface Device for Security and Stability Control System
Nanjing NR Electric Co., Ltd.
KJD127(A) Mining Explosion-Proof and Intrinsically Safe Computer
Taiyuan Xiangming Intelligent Control Technology Co., Ltd.

TWP16 P-Band Tropospheric Wind Profile Radar
China Huayun Meteorological Technology Group Co., Ltd.
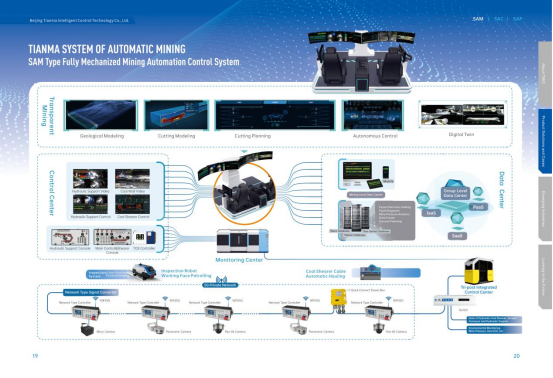
Comprehensive Mining Automation Control System
Beijing Tianma Intelligent Control Technology Co., Ltd.