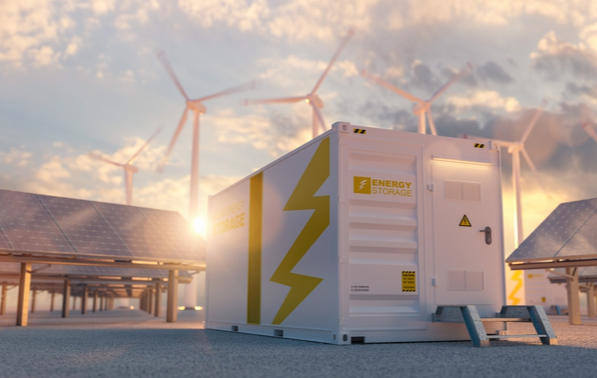
Executive Summary
The global power-cable industry is entering a structurally stronger investment cycle. Electricity demand growth, grid reinforcement, renewable-energy integration, offshore wind, interconnectors, urban electrification, data centres and industrial reshoring are increasing demand across low-voltage, medium-voltage, high-voltage and submarine cable systems. The fastest value growth is concentrated in high-voltage direct-current (HVDC), subsea export cables and technically demanding turnkey cable systems rather than in commodity building wire.
The market is also constrained. The International Energy Agency (IEA) reports that prices and procurement times for critical transmission components, including cables, almost doubled over four years. This has shifted purchasing decisions away from unit price alone toward manufacturing slots, qualification history, installation capability, warranty strength and whole-life reliability.
For international suppliers, the opportunity is therefore two-speed: high-volume low- and medium-voltage cables remain regional and price-sensitive, while high-voltage and subsea systems are capacity-constrained, project-driven and dominated by a smaller group of qualified manufacturers. Competitive advantage increasingly depends on vertical integration, long-term metal procurement, local production, testing assets, installation vessels, engineering capability and access to grid-operator frameworks.
Key Findings
- Global grid investment must rise from roughly USD 400 billion annually to about USD 600 billion by 2030, creating a durable demand base for transmission and distribution cables.
- Cable prices and lead times have nearly doubled since 2021 in several transmission categories, reflecting constrained production capacity, expensive metals, specialised testing and limited installation resources.
- Asia-Pacific remains the largest volume market; Europe and North America are the most visible high-value replacement and interconnection markets; the Middle East is emerging as a major HV and renewable-grid opportunity.
- Subsea and HVDC cables are the fastest-growing value segments. Public estimates for the 2025 submarine power-cable market vary widely because of different scope definitions, but most point to high-single-digit growth through the early 2030s.
- Copper and aluminium remain the largest cost variables. Buyers increasingly permit indexed pricing or metal-adjustment clauses rather than fixed long-term quotes.
- XLPE is the dominant insulation technology for new HVAC and many HVDC applications, while mass-impregnated and specialised designs remain relevant for ultra-long or demanding links.
- Leading global suppliers include Prysmian, Nexans, NKT, Sumitomo Electric, Furukawa Electric, LS Cable & System, Hellenic Cables and major Chinese manufacturers. Qualification barriers are highest in EHV and subsea projects.
- The key procurement risk is not simply price inflation; it is failure to secure qualified manufacturing and installation capacity early enough to meet project schedules.
1. Market Definition and Segmentation
Power cables transmit and distribute electrical energy. The commercial market spans commodity and engineered systems, and market-size estimates differ substantially depending on whether building wire, accessories, installation services and submarine systems are included.
|
Segment |
Typical voltage / use |
Commercial characteristics |
|
Low voltage |
Up to 1 kV; buildings, factories, EV charging |
Large volume, local standards, metal-sensitive pricing |
|
Medium voltage |
1-36 kV; distribution, renewables, industrial plants |
Utility qualification, regional manufacturing, accessories critical |
|
High voltage |
Typically 36-220 kV |
Project-based, long qualification, high testing requirements |
|
Extra-high voltage |
Above 220 kV |
Limited qualified suppliers, strategic grid projects |
|
Submarine / HVDC |
Offshore wind, islands, interconnectors |
Highest value per km; installation and marine risk dominate |
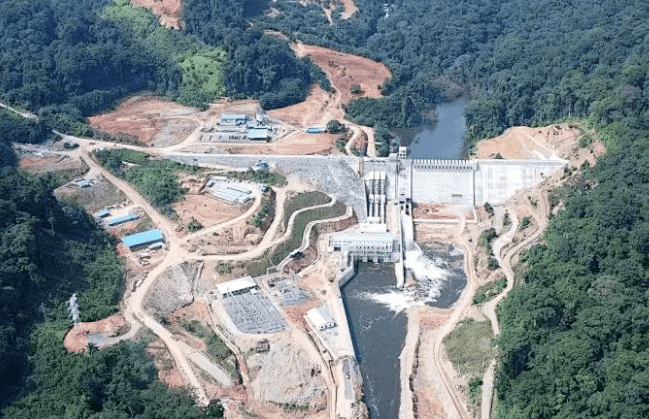
2. Global Demand Outlook
The clearest demand indicator is grid capital expenditure rather than a single market-research valuation. According to the IEA, meeting electricity demand through 2030 requires annual grid investment to increase about 50%, from approximately USD 400 billion today to around USD 600 billion. This investment supports new lines, undergrounding, distribution reinforcement, cross-border interconnection and replacement of ageing assets.
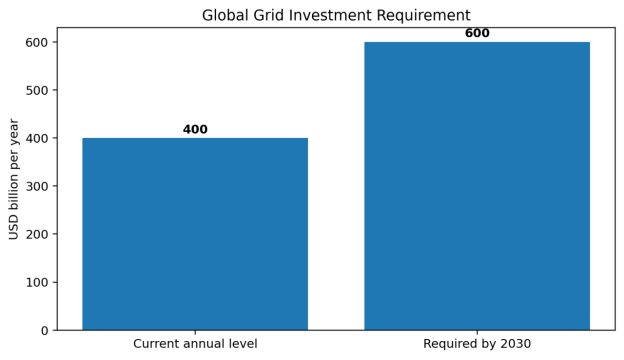
Figure 1. Global grid investment requirement. Source: IEA Electricity 2026.
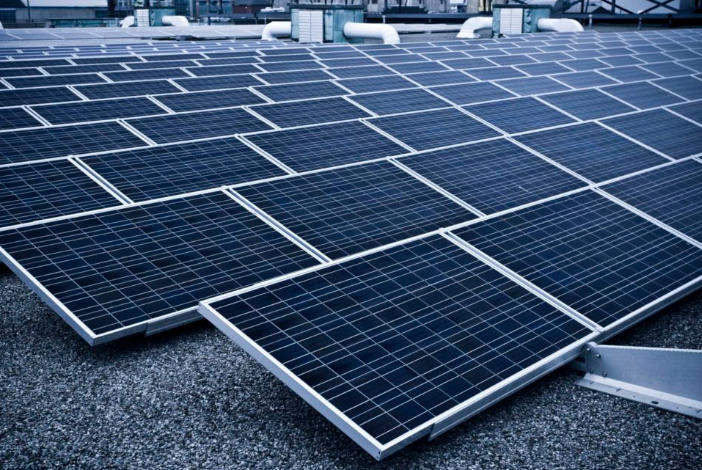
Demand is reinforced by renewable generation. IEA Renewables 2025 expects 732 GW of onshore wind additions and around 140 GW of offshore wind additions during 2025-2030. Each project requires array, collector, export and grid-connection cable systems, although cable intensity differs greatly by distance, voltage and network design.
3. Supply Chain and Price Conditions
The industry is experiencing a supply-side re-rating. IEA analysis published in February 2025 found that prices and procurement times for transformers and cables had almost doubled in four years. For high-voltage systems, bottlenecks are concentrated in conductor supply, specialised insulation lines, qualification testing, accessories, joints, installation vessels and skilled project teams.
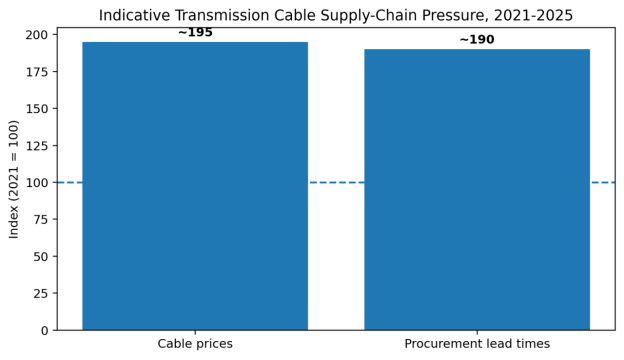
Figure 2. Indicative supply-chain pressure index based on the IEA statement that prices and lead times nearly doubled.
Cost Structure
|
Cost element |
Indicative importance |
Key volatility driver |
|
Copper or aluminium conductor |
Very high |
LME prices, premiums, exchange rates |
|
Insulation and sheathing |
Medium |
Polymers, semiconductive compounds, energy |
|
Armouring and protection |
Medium-high for subsea |
Steel wire, corrosion protection |
|
Manufacturing and testing |
High in HV/EHV |
Factory utilisation, qualification, energy |
|
Accessories and joints |
High technical risk |
Compatibility and field workmanship |
|
Logistics and installation |
Very high for subsea |
Vessels, route risk, weather, mobilisation |
4. Segment Outlook
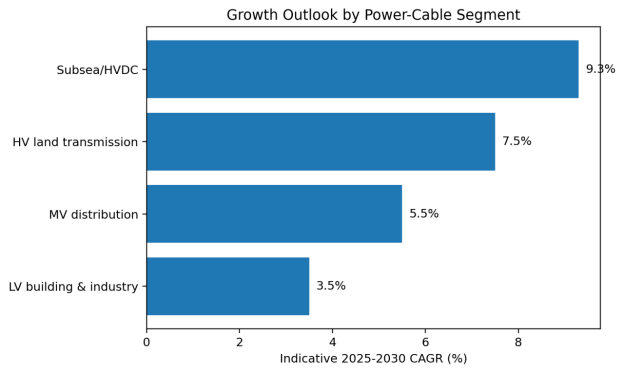
Figure 3. Indicative growth outlook by segment; strategic synthesis based on grid and offshore investment trends.
Low-voltage cables
Growth is tied to construction, industrial investment, distributed energy, EV charging and data-centre electrical systems. The segment is large but competitive, with strong regional producers and frequent standards variation.
Medium-voltage cables
Distribution-grid upgrades, renewable collector systems and industrial electrification make MV one of the broadest global opportunities. Utility approvals, fire performance and accessory quality matter more than headline conductor price.
High-voltage land cables
Urban undergrounding, grid reinforcement and transmission corridors support higher growth. Projects require long testing histories, qualified joints and close coordination with civil works.
Submarine and HVDC cables
This is the highest-growth value segment. Public research estimates place the 2025 submarine power-cable market in a broad range of roughly USD 11-18 billion, reflecting differences in whether installation, accessories and certain project scopes are included. Most forecasts indicate high-single-digit annual growth through 2032-2035.
5. Regional Market Analysis
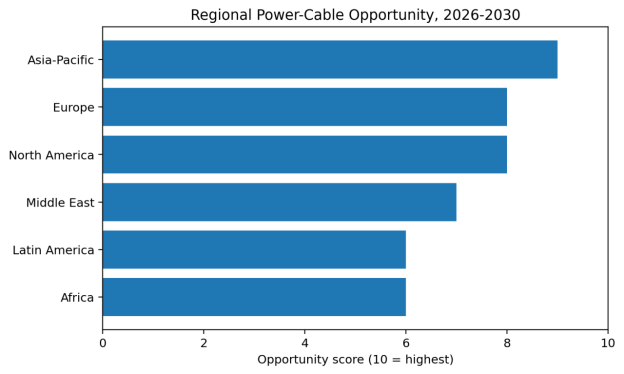
Figure 4. Regional opportunity score, 2026-2030. Analytical assessment.
Asia-Pacific
The region leads global cable volume because of urbanisation, manufacturing, renewable deployment and extensive transmission build-out. China has the deepest integrated supply chain; India and Southeast Asia offer faster demand growth but require local standards, price discipline and distribution partnerships.
Europe
Investment is driven by offshore wind, cross-border interconnectors, ageing-grid replacement and undergrounding. Europe has the strongest cluster of global high-voltage and subsea leaders. Framework agreements and sustainability declarations increasingly influence procurement.
North America
Grid resilience, data centres, industrial reshoring, renewable interconnection and replacement of old distribution assets support demand. UL/ICEA requirements, domestic-content policies and utility qualification favour local manufacturing or established partnerships.
Middle East
Large renewable projects, new cities, desalination, oil-and-gas electrification and interconnection plans create opportunities from MV through EHV. Buyers prioritise high-temperature performance, reliable delivery and strong EPC relationships.
Latin America
Renewable corridors, mining and transmission auctions support project demand. Currency, financing and permitting risks can delay orders, but qualified regional manufacturing remains limited in several markets.
Africa
Electrification, mining, industrial zones and interconnectors offer long-term growth. Near-term procurement is often donor-, utility- or EPC-led, with high sensitivity to financing, logistics and after-sales support.
6. Technology and Product Evolution
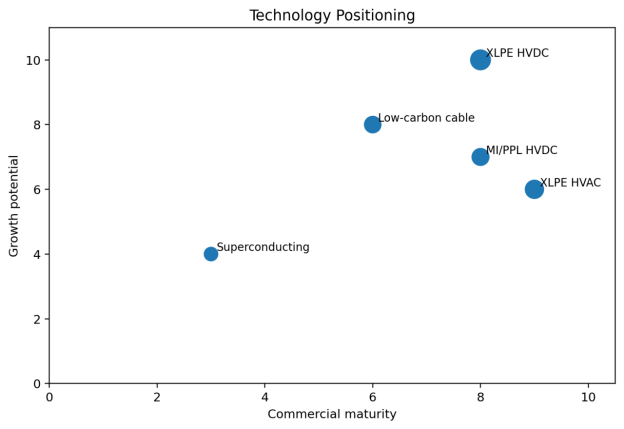
Figure 5. Technology positioning for power-cable systems.
|
Technology |
Strengths |
Constraints / best fit |
|
XLPE HVAC |
Mature, low maintenance, broad supplier base |
Reactive power and losses limit very long links |
|
XLPE HVDC |
High capacity, suitable for long-distance and subsea links |
Demanding material purity and qualification |
|
MI/PPL HVDC |
Long operating history at high voltage |
Heavier and less flexible manufacturing |
|
Dynamic subsea cable |
Enables floating wind and moving assets |
Fatigue, bend and installation challenges |
|
Low-carbon cable designs |
Recycled metal, lower-carbon polymers, environmental declarations |
Premium cost and data-verification requirements |
|
Superconducting cable |
Very high power density |
Cryogenic complexity; niche deployment |
7. Competitive Landscape
The global market is fragmented in low voltage but concentrated in EHV and subsea systems. Prysmian reported a EUR 17 billion transmission backlog at the end of 2025 and strong organic growth in both Transmission and Power Grid, illustrating the value of scarce high-voltage capacity. Nexans and NKT are similarly focused on electrification and high-value transmission. Japanese and Korean groups are important in advanced submarine and regional grid projects, while Chinese manufacturers combine scale, integrated metal supply and competitive pricing.
|
Competitive tier |
Representative companies |
Primary strengths |
|
Global HV/subsea leaders |
Prysmian, Nexans, NKT |
Turnkey engineering, vessels, qualification, global backlog |
|
Asian technology leaders |
Sumitomo Electric, Furukawa, LS Cable & System |
HVDC, subsea, regional manufacturing |
|
European specialists |
Hellenic Cables and others |
Subsea and regional project execution |
|
Large Chinese groups |
ZTT, Hengtong, Orient Cable, Baosheng and others |
Scale, integrated supply chain, cost competitiveness |
|
Regional LV/MV producers |
Numerous local manufacturers |
Local standards, distribution, short lead times |
8. Procurement and Supplier Evaluation
- Define the system boundary: cable only, or cable plus accessories, installation, testing and maintenance.
- Verify applicable IEC, CIGRE, UL, ICEA, BS or local utility specifications before price comparison.
- Audit actual manufacturing line availability, not only stated annual capacity.
- Review type-test reports, prequalification history, conductor traceability and compound-control procedures.
- Use metal-index adjustment formulas and clearly define copper/aluminium base dates.
- For HV and subsea projects, evaluate jointing teams, vessel access, burial tools, route engineering and repair strategy.
- Model total installed cost and outage risk; the lowest cable quotation may create the highest project cost.
- Secure production slots early and align milestones with civil works, substations and commissioning windows.
9. Risk Analysis
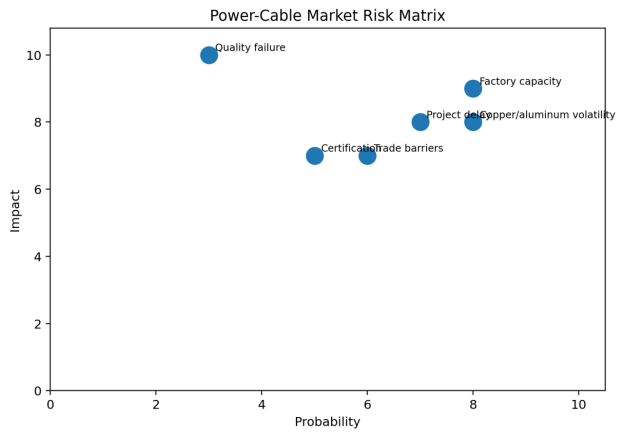
Figure 6. Power-cable market risk matrix.
Metal-price risk
Copper and aluminium can move rapidly. Indexed contracts reduce supplier risk but make project budgets less certain.
Capacity and lead-time risk
Qualified HV and subsea factories may be booked years ahead. Late procurement can become a critical-path issue.
Technical failure risk
Cable faults, joint failures or water ingress can create high repair and outage costs, especially offshore.
Policy and trade risk
Local-content rules, tariffs, sanctions and procurement restrictions can change supply economics.
Project execution risk
Permitting, route surveys, civil works, installation windows and weather can delay delivery and energisation.
Demand-cycle risk
Commodity LV demand can weaken with construction cycles, while offshore projects may be postponed by financing or policy changes.
10. Outlook to 2030
The global power-cable market should grow faster in value than in physical volume because the product mix is shifting toward higher-voltage, longer-distance and more technically complex systems. Distribution cables will remain the largest volume category, but HVDC, subsea export cables, interconnectors and large-load grid connections will capture a disproportionate share of industry profit and capital expenditure.
The most successful suppliers will combine five capabilities: secured conductor and compound supply; proven quality systems; access to manufacturing slots; project engineering and installation resources; and local commercial credibility. International buyers should treat cable procurement as a strategic infrastructure decision rather than a standard materials purchase.