1. Price Definition: What Is Actually Being Quoted?
MBR quotations are not directly comparable unless the supply boundary is normalized. A membrane-module price may exclude cassettes, aeration manifolds, permeate pumps, blowers, controls, clean-in-place equipment, fine screens and biological tanks. An equipment-package price may include startup but exclude installation. A full wastewater project can additionally include influent pumping, headworks, equalization, nutrient removal, UV disinfection, sludge handling, odor control, buildings, backup power, site development and outfall works.
|
Price level |
Usually included |
Usually excluded or variable |
Best use |
|
Membrane element/module |
Membrane fibers or flat sheets, potting and module frame |
Cassettes, manifolds, pumps, blowers, controls, tanks |
Replacement and compatibility comparison |
|
Membrane train / cassette package |
Modules, cassettes, air headers, permeate connections |
Biological process, civil tanks, headworks, installation |
Retrofit or train expansion |
|
MBR equipment package |
Membranes, blowers, pumps, controls, instrumentation, manuals and startup |
Civil works, electrical distribution, installation and site works may be excluded |
Supplier bid comparison |
|
Installed MBR process |
Equipment, tanks, installation, electrical and commissioning |
Upstream and downstream treatment may still vary |
Process-level CAPEX comparison |
|
Complete wastewater or reuse facility |
Headworks, MBR, disinfection, sludge, buildings, site and utilities |
Off-site pipelines, land, financing and owner costs may remain separate |
Project financing and tariff analysis |
Scope logic synthesized from public MBR procurement documents issued by the City of Duvall, Town of Woodstock and City of Anna, Texas.
1.1 Core System Configurations
|
Configuration |
Typical economic profile |
Main cost risks |
Best-fit applications |
|
Submerged hollow-fiber MBR |
High packing density and broad municipal reference base |
Fine screening, fiber integrity, air-scour energy, vendor-specific cassettes |
Municipal reuse, large plants, constrained sites |
|
Submerged flat-sheet MBR |
Robust physical format and simplified visual inspection |
Lower packing density, module handling and tank volume |
Small-to-medium systems, variable wastewater |
|
Sidestream / external MBR |
High shear and accessible modules |
Recirculation pumping and energy consumption |
High-strength industrial wastewater and difficult solids |
|
Containerized/package MBR |
Fast deployment and factory integration |
High unit CAPEX, transport, site interfaces and redundancy |
Temporary capacity, remote sites, decentralized reuse |
|
Anaerobic MBR / SAF-MBR |
Potential energy recovery and low biosolids |
Dissolved methane, sulfide, ammonia and scale-up risk |
High-strength wastewater and future low-energy treatment |
2. Public Cost Signals and Price Trend Evidence
The public record supports two different conclusions. First, membrane and package-equipment prices can be expressed on a capacity basis when scope is disclosed. Second, total project prices are highly sensitive to design maturity, inflation and site conditions, so project-estimate escalation should not be misread as membrane-module inflation.
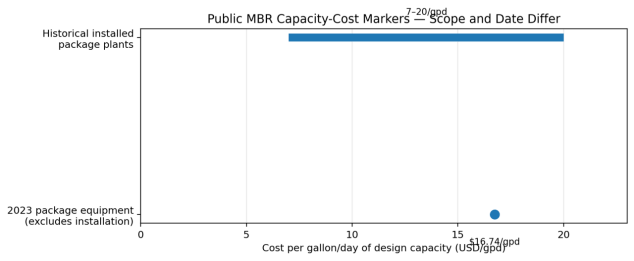
Figure 1. Public MBR capacity-cost markers
Sources: US EPA, Membrane Bioreactors Wastewater Management Fact Sheet; City of Anna, Texas, 2023 temporary package MBR procurement proposal. The EPA range is historical and installed; the Anna figure is 2023 equipment procurement with delivery/startup but excludes installation. Values are not inflation-adjusted or directly interchangeable.
Interpretation. The Anna package proposal falls within the historical EPA order-of-magnitude range even though it excludes installation. This does not prove that MBR prices were flat over time. It shows that temporary modular capacity, redundancy, controls, delivery and startup can keep package-system pricing near the upper end of historical installed-cost indications.
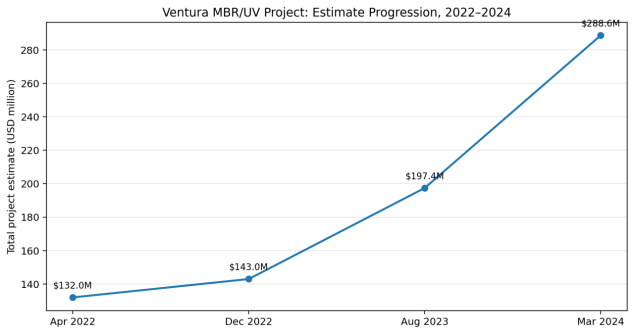
Figure 2. Ventura MBR/UV project estimate progression
Source: City of Ventura public presentation, 2024. Later estimates include demolition and a more mature understanding of backup power, odor control, stormwater, regulatory requirements and difficult site conditions. The figure is a project-development case study, not an MBR equipment price index.
2.1 Public Procurement and Budget Examples
|
Date / location |
Public amount |
Capacity / scope |
What the figure demonstrates |
|
2023, Anna, Texas |
USD 8.3715 million |
0.5 MGD temporary Kubota package MBR; procurement, fabrication, delivery and startup; installation excluded |
Equipment-package cost can be high for modular and temporary capacity |
|
2022 budget, Woodstock, Virginia |
USD 2.2805 million |
Membrane replacement and SCADA budget allocation |
Replacement projects include controls and integration, not modules alone |
|
2025 budget, Woodstock, Virginia |
USD 2.9968 million |
Multi-year membrane replacement and SCADA federal-fund allocation |
Budget increased about 31% versus the 2022 allocation; not necessarily a like-for-like contract price |
|
2022–2024, Ventura, California |
USD 132 million to about USD 289 million |
MBR/UV project estimate, with demolition added in later estimates |
Inflation, design maturity, site and compliance can dominate total CAPEX |
|
2023–2024, Maine public funding example |
USD 48.23 million total project cost |
MBR, disposal field and collection system |
Full-project figures must not be compared with equipment-only bids |
Sources: City of Anna public proposal; Town of Woodstock budgets and RFP; City of Ventura public presentation; Maine Department of Environmental Protection CWSRF project highlights.
2.2 Why a Global Historical Price Series Is Not Available
- MBR designs vary by average flow, peak factor, flux, redundancy, wastewater strength, nutrient target and reuse standard.
- Membrane area is not disclosed consistently, preventing reliable normalization to USD/m².
- Public bids use different Incoterms and tax treatment and may include or exclude installation, electrical work and commissioning.
- Municipal projects often combine MBR with UV, odor control, sludge processing, buildings and pipelines.
- Vendor compatibility can create a concentrated replacement market even when new-build module competition is broad.
3. Product-Specific Cost Structure
The membrane itself is visible, but it is not the whole cost. At plant level, civil structures, biological aeration, membrane air scour, fine screening, pumps, controls, electrical infrastructure, redundancy and commissioning can equal or exceed the membrane package. The cost hierarchy changes with plant scale: small package plants carry more factory integration per unit of capacity, while large plants can achieve module and equipment scale but remain exposed to site and civil costs.
|
Cost block |
Typical components |
Cost direction |
Key quotation questions |
|
Membrane separation |
Modules, cassettes, racks, manifolds, permeate headers |
Driven by membrane area, flux, peak flow and redundancy |
Guaranteed net flux? Standby train? Spare modules? Compatibility? |
|
Biological process |
Anoxic/aerobic tanks, mixers, internal recycle, process air |
Driven by load, nutrient limits, temperature and SRT |
Design loads? Oxygen-transfer basis? Winter performance? |
|
Membrane aeration |
Air-scour blowers, headers, diffusers and valves |
Major OPEX and meaningful CAPEX |
SADm/SADp guarantees? Turndown? Blower efficiency? |
|
Pretreatment |
1–3 mm screens, grit removal, grease and fiber control |
Critical to module life and warranty |
Screen opening, bypass protection and screenings handling? |
|
Pumping and hydraulics |
Permeate, backwash, recycle, waste sludge and feed pumps |
Sensitive to head and control philosophy |
Duty point, VFD control, N+1, energy guarantee? |
|
Controls and instrumentation |
PLC, HMI, TMP, turbidity, DO, flow and integrity monitoring |
High integration and lifecycle value |
Open protocols? Remote support? Cybersecurity? Data ownership? |
|
Cleaning system |
CIP tanks, chemical dosing, heating, transfer and neutralization |
Depends on wastewater and fouling |
Clean frequency, chemical limits and wastewater disposal? |
|
Civil/electrical/site |
Tanks, buildings, MCCs, generators, cabling, dewatering and foundations |
Often the largest source of project volatility |
Utility interfaces, geotechnical risk, backup power and code scope? |
|
Startup and service |
Commissioning, performance testing, training and long-term support |
Can determine ramp-up and availability |
Acceptance test, operator training, response time and spares? |
3.1 Cost Drivers by Technical Parameter
|
Parameter |
Lower-cost condition |
Higher-cost condition |
Economic mechanism |
|
Average/peak flow ratio |
Equalized flow and moderate peak factor |
Peak flow 1.5–2.0× average without equalization |
More membrane area and standby capacity |
|
Net design flux |
Validated conservative flux |
Aggressive flux used to reduce initial module count |
Lower CAPEX can increase fouling and replacement risk |
|
Influent screening |
Reliable 1–3 mm fine screening |
Fibrous solids, hair and bypass events |
Physical damage, ragging and warranty exposure |
|
Nutrient limits |
Secondary treatment only |
Low TN/TP with reuse or sensitive discharge |
More zones, recycles, chemicals and controls |
|
Wastewater type |
Municipal, stable and biodegradable |
Industrial, oily, saline or toxic |
Pilot testing, material upgrades and cleaning |
|
Redundancy |
Minimal standby equipment |
N+1 trains, pumps and blowers |
Higher CAPEX but greater availability |
|
Site condition |
Greenfield, good soil and simple utilities |
Brownfield, groundwater, seismic or constrained site |
Civil, demolition and construction sequencing |
|
Delivery model |
Local manufacture and standard package |
Imported/custom system with local integration |
Freight, duties, certification and service |
4. Operating Cost and Energy Economics
Energy is the most transparent recurring cost lever. For submerged MBRs, biological aeration and membrane air scour normally dominate electrical demand. Low utilization can be especially damaging because some blowers, mixers and controls continue operating even when flow is below design.
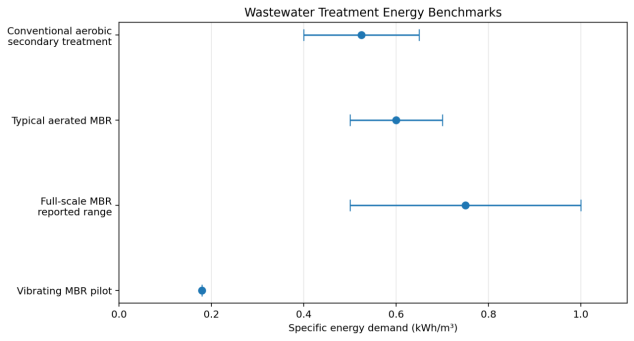
Figure 3. Wastewater treatment energy benchmarks
Sources: California Energy Commission CEC-500-2024-044; Zuo et al., Membranes (2022); Kitanou et al., Desalination and Water Treatment (2021). Plant boundaries differ. The vibrating-MBR value is pilot-scale and should not be used as a guaranteed commercial benchmark.
Energy breakdown. A published domestic-wastewater MBR assessment attributed approximately 53% of electricity to biological aeration and about 25% to membrane filtration, with the balance associated with pumps and auxiliary systems. The exact split depends on oxygen demand, membrane configuration, air-scour strategy and hydraulic head.
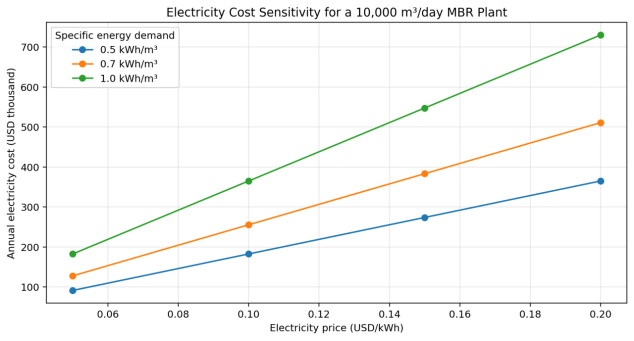
Figure 4. Electricity-cost sensitivity for a 10,000 m³/day MBR plant
Illustrative calculation: annual volume = 3.65 million m³; electricity cost = flow × specific energy demand × tariff. Excludes demand charges, power-factor penalties, backup generation and other OPEX.
|
Electricity price |
0.5 kWh/m³ |
0.7 kWh/m³ |
1.0 kWh/m³ |
|
USD 0.05/kWh |
USD 91,250/year |
USD 127,750/year |
USD 182,500/year |
|
USD 0.10/kWh |
USD 182,500/year |
USD 255,500/year |
USD 365,000/year |
|
USD 0.15/kWh |
USD 273,750/year |
USD 383,250/year |
USD 547,500/year |
|
USD 0.20/kWh |
USD 365,000/year |
USD 511,000/year |
USD 730,000/year |
Illustrative annual-energy model for a constant 10,000 m³/day flow. Actual plants have seasonal flows, demand charges and non-MBR loads.
4.1 Other OPEX Components
|
OPEX item |
Primary driver |
Typical failure in low-price comparisons |
Buyer control |
|
Membrane cleaning chemicals |
Fouling, CIP frequency and chemical compatibility |
Assuming vendor laboratory frequency at full-scale wastewater conditions |
Pilot data, cleaning log guarantee and chemical consumption cap |
|
Membrane replacement reserve |
Module price, life and prorated warranty |
Ignoring replacement until failure |
Annual reserve and contractually defined life test |
|
Sludge treatment and disposal |
SRT, yield, dewatering and local gate fee |
Comparing only liquid-line power |
Mass-balance guarantee and disposal-cost model |
|
Labor |
Automation, operator skill and regulatory sampling |
Assuming package plant means unattended operation |
Staffing plan, remote support and alarm philosophy |
|
Maintenance and spares |
Blowers, pumps, valves, instruments and proprietary parts |
Pricing only membrane spares |
Five-year spare-parts schedule and lead-time commitment |
|
Downtime and bypass |
Redundancy, cleaning sequence and repair response |
Treating availability as non-financial |
Availability guarantee, N+1 design and liquidated damages |
5. Membrane Life, Warranty and Replacement Economics
Membrane life is the key bridge between purchase price and TCO. The EPA identifies membrane life as central to cost-effectiveness and notes that municipal guarantees have ranged from three to five years, with some ten-year guarantees. A 2023 Woodstock replacement RFP stated that the original membranes installed in 2010 had an expected life of about ten years, demonstrating that procurement decisions made at initial construction can affect replacement economics more than a decade later.
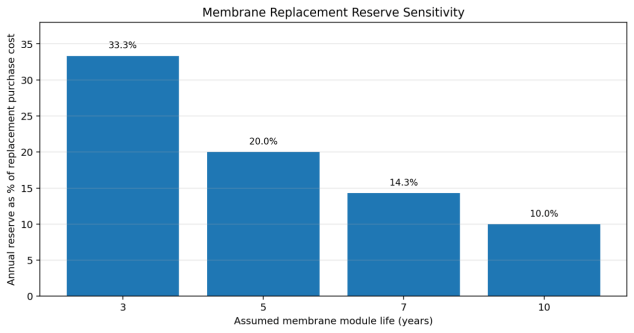
Figure 5. Annual membrane replacement reserve
Illustrative straight-line reserve expressed as a percentage of the next replacement purchase cost. It excludes discounting, escalation, salvage value and prorated warranty recovery.
|
Membrane life |
Annual reserve |
Procurement implication |
|
3 years |
33.3% of replacement cost/year |
High-cost outcome; often indicates difficult wastewater, damage, aggressive flux or weak warranty |
|
5 years |
20.0%/year |
Common minimum planning case for industrial or uncertain service |
|
7 years |
14.3%/year |
Balanced municipal planning assumption where pretreatment and cleaning are controlled |
|
10 years |
10.0%/year |
Strong lifecycle outcome, but warranty conditions and actual integrity must be verified |
5.1 Warranty Clauses That Change Economic Value
- Full replacement versus prorated reimbursement after a defined operating period.
- Guaranteed membrane area, permeability, integrity and maximum transmembrane pressure.
- Required screen opening and exclusions for grease, fibers, hydrocarbons or chemical overexposure.
- Limits on chlorine concentration, cumulative exposure, pH and cleaning temperature.
- Definition of failure: individual fiber repair, module replacement, cassette replacement or loss of guaranteed capacity.
- Freight, field labor, crane/handling and process downtime during warranty replacement.
- Compatibility with existing cassettes, PLC logic, air headers and permeate connections.
5.2 Total Cost of Ownership Model
Recommended TCO boundary: equipment purchase + freight/duties + installation + civil/electrical interfaces + commissioning + energy + chemicals + labor + sludge handling + planned maintenance + membrane reserve + critical spares + downtime risk − land and downstream filtration savings − reuse-water value.
|
Economic variable |
Required input |
Why it matters |
|
Design and average flow |
m³/day and utilization profile |
Fixed loads make low utilization expensive |
|
Specific energy demand |
kWh/m³ at average and peak conditions |
Directly links design to tariff exposure |
|
Electricity tariff |
Energy, demand and power-factor charges |
Regional differences can reverse supplier ranking |
|
Membrane replacement |
Price, life, warranty and labor |
Creates periodic cash outflows and downtime |
|
Chemical usage |
kg or L per m³ and clean frequency |
Industrial wastewater can deviate sharply from municipal assumptions |
|
Sludge production |
kg dry solids per m³ and disposal fee |
Long SRT may reduce yield but does not eliminate solids cost |
|
Availability |
Guaranteed online capacity and repair time |
Lost production or non-compliance can exceed maintenance cost |
|
Reuse value |
Avoided freshwater and discharge cost |
Can justify MBR premium in water-scarce or industrial sites |
|
Land and civil savings |
Avoided clarifiers/filters and footprint value |
Critical in brownfield and high-land-cost locations |
6. Regional Cost and Procurement Differences
|
Region |
Cost position |
Key delivered-cost drivers |
Procurement emphasis |
|
North America |
High installed CAPEX and labor; transparent public procurement |
Civil works, electrical codes, backup power, union labor, site constraints and long lead equipment |
Performance guarantees, local service, public-bid scope and lifecycle documentation |
|
Europe |
High energy and compliance value; strong focus on resource efficiency |
Electricity price, nutrient/micropollutant requirements, energy audits and carbon objectives |
Energy guarantee, automation, upgradeability and circular-economy integration |
|
China |
Competitive module and standard equipment manufacturing |
Quality tier, project references, material specification, export certification and overseas service |
Factory audit, module traceability, third-party testing and spare-parts plan |
|
India and Southeast Asia |
Strong price sensitivity with growing reuse demand |
Power quality, variable influent, operator capability, imported components and local fabrication |
Simple operation, robust pretreatment, remote support and tariff sensitivity |
|
Middle East |
Water-reuse value can support higher-spec systems |
High temperature, salinity, industrial variability, chemical supply and service response |
Materials, cooling/ventilation, reuse standard and local O&M capability |
|
Latin America |
Project economics strongly financing-dependent |
Currency, import duty, local civil cost, utility power and municipal credit |
Local assembly, payment protection, training and phased capacity |
|
Africa and remote markets |
Package systems may dominate but unit CAPEX is high |
Freight, power reliability, chemicals, operator availability and long spare lead times |
Modularity, low-energy mode, critical spares and local partner capability |
6.1 Trade and Landed-Cost Checklist
|
Cost layer |
Questions to resolve before comparing offers |
|
Ex works / FOB |
Are modules, cassettes, air headers, pumps, blowers, PLC, instruments, CIP and spares included? |
|
Freight and insurance |
Container count, oversize loads, storage requirements, hazardous cleaning chemicals and insurance basis? |
|
Tariffs and taxes |
HS classification, import duty, VAT/GST, exemptions and local-content rules? |
|
Certification |
Electrical standards, pressure vessels, seismic design, material certificates, cybersecurity and grid requirements? |
|
Installation |
Who supplies tanks, cranes, piping, cabling, MCC/VFDs, foundations and temporary treatment? |
|
Commissioning |
Duration, wastewater availability, performance-test protocol, operator training and retesting cost? |
|
Service |
Local technician location, response time, remote access, language, stock and annual support fee? |
|
Currency/payment |
Exchange-rate adjustment, advance payment, letters of credit, retention and performance security? |
7. Price and Cost Outlook, 2026–2028
Base-case judgement. MBR module pricing should remain competitive where multiple suppliers can meet a standard new-build specification. However, installed project cost is unlikely to follow the same downward trajectory because labor, civil works, electrical infrastructure, regulatory requirements and site conditions remain difficult to standardize.
|
Driver |
2026–2028 direction |
Expected effect |
|
Standard membrane modules |
Competitive / mixed |
Scale and supplier competition pressure price, while warranty and material quality preserve premium tiers |
|
Proprietary replacement modules |
Firm |
Installed-base compatibility and process risk reduce buyer leverage |
|
Blowers, pumps and controls |
Stable to upward in nominal terms |
Efficiency, instrumentation and cybersecurity increase specification content |
|
Civil and electrical works |
Volatile |
Local labor, site constraints, backup power and permitting remain project-specific |
|
Energy-efficient operation |
Increasing value |
EU energy-neutrality policy and high industrial tariffs strengthen lifecycle focus |
|
Package and temporary systems |
Premium over permanent standardized capacity |
Factory integration, rapid delivery and modular redundancy raise unit cost |
|
Anaerobic and low-aeration MBR |
Technology progress, limited broad benchmarkability |
Potential OPEX improvement but process and scale-up risk remain |
|
Water-reuse value |
Increasing strategic importance |
Avoided freshwater, discharge and drought risk can outweigh equipment-price differences |
7.1 Three Procurement Scenarios
|
Scenario |
Selection logic |
Likely result |
|
Lowest initial price |
Minimum membrane and equipment scope; limited redundancy and service |
Lowest bid price but highest risk of change orders, energy underperformance and replacement cost |
|
Balanced lifecycle case |
Validated flux, efficient aeration, N+1 critical equipment, clear warranty and local service |
Moderate CAPEX with more predictable OPEX and availability |
|
High-reliability reuse case |
Conservative flux, advanced monitoring, robust pretreatment, full redundancy and long-term service |
Highest CAPEX, but strongest compliance, reuse-water quality and financing acceptance |
8. Procurement Recommendations
8.1 Mandatory Bid Normalization
- Normalize every quotation to average and peak design flow, net membrane area, guaranteed flux, recovery, redundancy and treatment standard.
- Create separate price columns for membrane modules, cassettes, balance of equipment, installation, civil/electrical works, commissioning, freight, duties and taxes.
- Require energy guarantees at average-day flow, peak-day flow and minimum turndown—not only at design flow.
- Request a five- or ten-year membrane-replacement schedule with module price assumptions, prorated warranty and field labor.
- Compare delivered cost under the same Incoterm and clearly state whether storage, insurance and inland transport are included.
8.2 Technical and Commercial Evaluation Matrix
|
Evaluation item |
Minimum evidence |
Commercial consequence if absent |
|
Reference plants |
Comparable flow, wastewater, effluent standard and operating years |
Higher process and scale-up contingency |
|
Flux and peak capacity |
Guaranteed net flux table by temperature and operating mode |
Hidden membrane-area shortfall or excessive fouling |
|
Energy guarantee |
Connected load and measured kWh/m³ boundary |
OPEX uncertainty and weak performance enforcement |
|
Membrane life |
Warranty, integrity criteria, repair limits and replacement pricing |
Unfunded lifecycle liability |
|
Pretreatment |
Screen specification, bypass protection and grease/fiber limits |
Physical damage and warranty disputes |
|
Automation |
Control narrative, remote support, open protocol and cybersecurity |
Integration cost and vendor lock-in |
|
Spares and service |
Five-year list, lead times, local inventory and technician response |
Long downtime and emergency freight |
|
Performance testing |
Influent range, duration, sampling, pass/fail criteria and retest |
Ambiguous acceptance and payment disputes |
|
Financial strength |
Audited accounts, bonds, insurance and project history |
Completion and warranty risk |
|
Scope exclusions |
Signed deviation and responsibility matrix |
Change orders and schedule claims |
8.3 Risk Matrix
|
Risk |
Probability |
Impact |
Mitigation |
|
Influent differs from design basis |
Medium–High |
High |
Sampling campaign, load envelope and pilot testing |
|
Membrane fouling or damage |
Medium |
High |
Fine screening, conservative flux, cleaning protocol and warranty |
|
Energy guarantee not met |
Medium |
High |
Metered acceptance test at defined plant boundary |
|
Proprietary replacement lock-in |
High |
Medium–High |
Price formula, compatibility rights and long-term supply agreement |
|
Civil/site escalation |
High |
High |
Geotechnical work, design maturity and realistic contingency |
|
Controls integration delay |
Medium |
Medium–High |
Interface matrix, FAT/SAT and open protocols |
|
Local service unavailable |
Medium |
High |
Response-time SLA, training and critical-spares stock |
|
Currency/tariff movement |
Medium |
Medium |
Hedging, local content and contract adjustment formula |
|
Reuse standard changes |
Low–Medium |
High |
Upgrade space, flexible controls and downstream treatment allowance |
9. Conclusion
The central purchasing mistake is to treat MBR as a membrane commodity. Membrane modules are only one layer of a process whose economics depend on aeration, utilization, pretreatment, redundancy, controls, civil works and long-term service. Public procurements show that package capacity can command a substantial premium, while public project estimates show that site and compliance costs can overwhelm any reduction in module price.
For 2026–2028, the most likely competitive shift is not a universal fall in MBR price, but a wider separation between low-cost equipment offers and bankable lifecycle solutions. Suppliers that can demonstrate low measured energy use, long membrane life, open controls, strong local service and clear scope will retain pricing power. Buyers should award on normalized delivered cost and treatment value rather than the lowest membrane or package quotation.
Industrial judgement: MBR is economically strongest where land is constrained, effluent standards are stringent, or reuse water has measurable value. It is economically weakest where power is expensive, utilization is low, pretreatment is poor and replacement modules are purchased without long-term price or warranty protection.
Related Products

Flocculant Intelligent Preparation and Dosing System
Being Huaxiayuanjie Water Technology Co., Ltd.
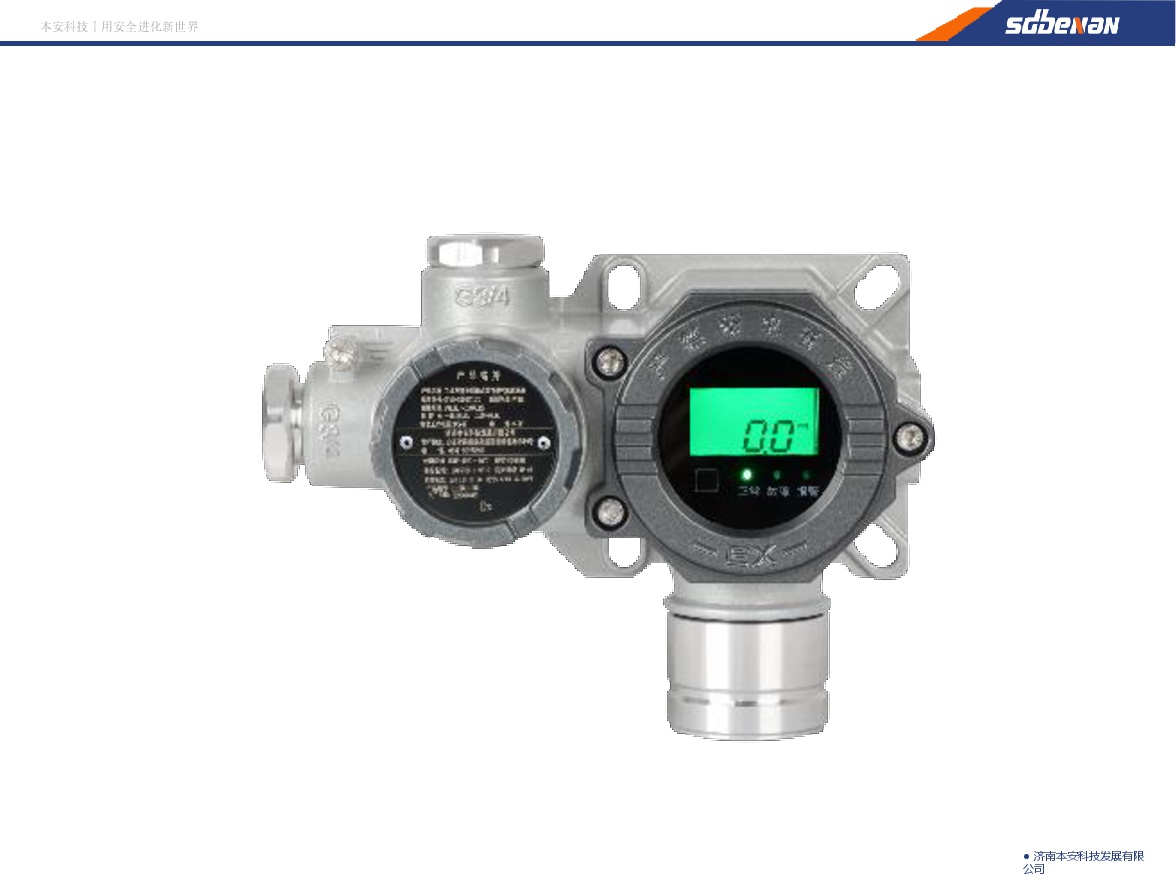
Industrial and Commercial Point-Type Gas Detector
Jinan Benan Technology Development Co., Ltd.
Solid Waste Treatment Technology - BOQI ENV - Hazardous & Solid Waste Treatment and Disposal Business
Beijing Boqi Electric Power SCI-TECH Co., Ltd.
Lianyungang Xuwei Reclaimed Water Plant Project (Phase I)
China Bluestar Lehigh Engineering Corporation
External Pressure Ultrafiltration Membrane Module
Shandong AMS Environment Co., Ltd.