1. Scope, Definitions and Methodology
1.1 Product Definition
A mechanical vapor recompression evaporator reuses the latent heat of generated vapor. The vapor is compressed to a higher pressure and saturation temperature and returned as the heating medium for the evaporator. After start-up, live steam demand can be minimal, while the compressor, circulation pumps and control system become the main energy consumers. MVR is therefore an open-cycle industrial heat-pump process rather than simply a different heat exchanger.
1.2 Included Configurations
|
Configuration |
Best fit |
Cost and performance implications |
|
Falling-film MVR |
Low- to medium-viscosity liquids with limited fouling and heat sensitivity |
High heat-transfer coefficients and low residence time; usually lower circulation power, but distribution quality and clean surfaces are critical. |
|
Forced-circulation MVR |
Scaling, crystallizing, viscous or high-solids duties |
More robust against deposition and solids; higher pump power, larger equipment and more demanding separation design. |
|
Rising-film / plate MVR |
Clean products, food, beverage and selected chemical duties |
Compact area and rapid heat transfer; gasket, pressure and fouling limits must be checked. |
|
MVR evaporator-crystallizer |
ZLD, brine concentration and salt recovery |
Highest complexity: boiling-point elevation, slurry handling, centrifuge/dryer integration and materials dominate cost. |
|
Hybrid MVR + multi-effect / TVR |
Sites with constrained compressor lift, variable steam balance or staged concentration |
Can optimize power and steam use, but adds controls, heat exchangers and operating modes. |
1.3 Research Method
The analysis uses public technical studies, measured case data, government and utility publications, manufacturer specifications, public project economics and IMF commodity-price series. Where public equipment prices are unavailable or incomparable, the report uses a qualitative cost map and transparent sensitivity models. No supplier list price is treated as a global benchmark.
Source note: ARENA/Alcoa; New Zealand EECA/Gen Less; PG&E Emerging Technologies; Alfa Laval; Condorchem; Veolia Water Technologies; IMF Primary Commodity Prices via FRED.
2. Technology Architecture and Configuration
2.1 Main Equipment Blocks
|
Equipment block |
Economic role |
Main sizing and risk variables |
|
Vapor compressor / blower |
Creates the temperature lift and normally represents the most critical rotating-equipment item |
Vapor flow, pressure ratio, inlet density, impeller speed, materials, efficiency, seal design, noise, turndown and redundancy. |
|
Evaporator / heat-transfer surface |
Transfers recompressed-vapor heat to the feed |
Heat-transfer coefficient, temperature approach, fouling factor, metallurgy, tube/plate geometry and cleanability. |
|
Vapor-liquid separator |
Protects compressor and controls entrainment |
Droplet size, vapor velocity, demister design, foaming and solids carryover. |
|
Circulation and feed pumps |
Maintain wetting, velocity and hydraulic stability |
Viscosity, solids, corrosion, NPSH, seal system, standby philosophy and VFD control. |
|
Preheater and condensate system |
Recovers sensible heat and stabilizes thermal balance |
Feed temperature, condensate quality, approach temperature and product contamination limits. |
|
Vacuum, vent and non-condensable removal |
Maintains pressure and prevents heat-transfer loss |
Air leakage, dissolved gases, sealing quality and vent treatment. |
|
CIP and chemical system |
Restores heat transfer and availability |
Scale chemistry, cleaning frequency, chemical compatibility, effluent handling and automated sequence. |
|
PLC/DCS, instrumentation and VFDs |
Controls compressor lift, level, pressure, flow, concentration and safety interlocks |
Functional safety, cybersecurity, remote support, local standards and data historian integration. |
2.2 Why Temperature Lift Matters
Modern MVR systems can operate at small temperature lifts. A New Zealand government technical guide notes that an increase of around 5°C can produce a coefficient of performance close to 50 in favorable applications. A small lift reduces compressor work but requires generous, clean heat-transfer area. As fouling or boiling-point elevation increases, the required lift rises, compressor power increases and the equipment trade-off changes.
The same nominal evaporation capacity can therefore produce very different quotations. A clean 10 t/h food liquid may use a compact falling-film design, while a 10 t/h high-salinity wastewater stream may require forced circulation, high-alloy metallurgy, larger separator volume, crystallization control, solids dewatering and a more powerful compressor.
Source note: New Zealand EECA/Gen Less technical guide; ARENA/Alcoa feasibility study; Alfa Laval and Condorchem technical information.
2.3 Published Energy Benchmarks
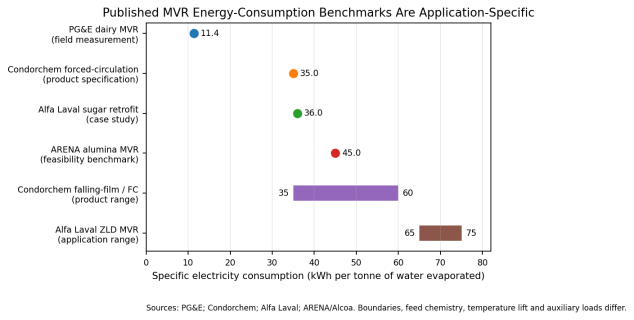
Figure 1. Published specific electricity-consumption benchmarks. Differences reflect application and system boundary, not supplier efficiency alone.
|
Public reference |
Duty and boundary |
Published or calculated SEC |
Use in procurement |
|
PG&E Humboldt Creamery |
Measured dairy evaporation; major recompression fans; 193 lb water evaporated per kWh |
≈11.4 kWh/t evaporated |
Low-lift, clean-product benchmark; not representative of ZLD. |
|
Condorchem MVR FC TF |
Forced-circulation wastewater evaporator product specification |
35 kWh/m³ distillate |
Packaged industrial reference; confirm auxiliary and feed conditions. |
|
Alfa Laval New Zealand Sugar |
Sugar concentration retrofit, MVR energy stated at 36 Wh/kg |
36 kWh/t |
Demonstrates large reduction versus the existing TVR system in that duty. |
|
ARENA/Alcoa alumina study |
Large industrial falling-film MVR feasibility benchmark |
≈45 kWh/t evaporation |
Useful high-capacity process reference; caustic-liquor duty and project design are specific. |
|
Condorchem MVR falling-film / FC |
Packaged wastewater range |
35–60 kWh/m³ distillate |
Shows the effect of configuration and feed; not a price guarantee. |
|
Alfa Laval ZLD Q&A |
MVR unit for ZLD application |
≈65–75 kWh/t evaporated |
High-solids/ZLD benchmark with application-dependent power. |
3. Price Trend Evidence and Quotation Logic
3.1 Why a Global Price Curve Does Not Exist
Unlike standardized motors or pumps, MVR evaporators are usually engineered-to-order process systems. Public quotations often omit feed pretreatment, product polishing, crystallization, solids handling, electrical distribution, site piping, civil works and performance testing. Small online listings are not representative of industrially guaranteed systems. A credible price analysis must therefore focus on cost drivers, scope normalization and project economics rather than an unsupported US$/unit series.
3.2 2021–2025 Cost-Driver Trend
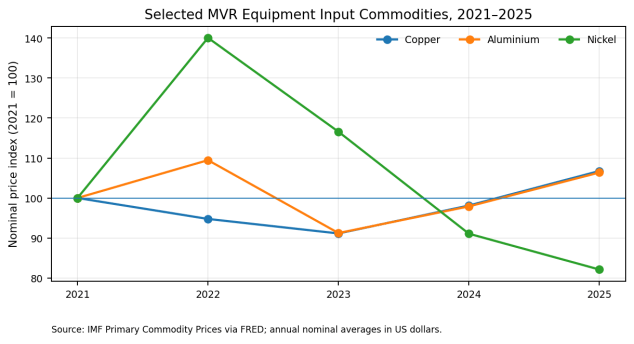
Figure 2. Selected commodity-price trends. Equipment quotations also include fabrication, labor, controls, testing, engineering and supplier risk.
|
Cost driver |
2021–2025 direction |
Implication for MVR quotation |
|
Nickel / stainless alloy input |
Peaked in 2022 and declined through 2025 |
Reduced pressure on some stainless and high-alloy inputs, but fabricated alloy equipment may lag commodity movements. |
|
Copper |
2025 annual average above 2021 |
Supports firmer costs for motors, generators, VFDs, transformers, switchgear and cabling. |
|
Aluminium |
2025 annual average above 2021 |
Affects motors, electrical assemblies and selected structural components. |
|
Engineering and skilled fabrication |
Generally sticky rather than commodity-linked |
Custom design, welding procedures, inspection, testing and documentation limit price deflation. |
|
Compressor and power electronics |
Efficiency and supply-chain sensitive |
High-speed rotating equipment, controls and harmonic requirements can dominate quote changes. |
|
Freight and site installation |
Route- and project-specific |
Oversized transport, cranage, import duty, local labor and remote-site access can outweigh ex-works savings. |
Source note: IMF Primary Commodity Prices via FRED, annual nominal averages for 2021–2025; industrial interpretation by report author.
3.3 Quotation Scope Checklist
|
Price term |
Minimum disclosure required |
|
Ex works |
Named factory, equipment list, packing, testing, documentation, warranty start and excluded taxes. |
|
FOB / CIF |
Port, marine insurance, freight route, oversized cargo treatment and preservation requirements. |
|
DDP / delivered |
Import duty, VAT, inland transport, unloading, storage and site access responsibilities. |
|
Installed process island |
Battery limits for mechanical, electrical, instrumentation, civil, insulation and tie-ins. |
|
Turnkey / EPC |
Performance guarantees, utilities, pre-treatment, product handling, environmental scope, commissioning, acceptance tests and liquidated damages. |
4. Cost Structure and Supply-Chain Exposure
4.1 Directional Cost Map
Reliable public cost-share percentages are not available across MVR applications, and applying a generic pie chart would be misleading. The following cost map is directional. The dominant package changes with scale, temperature lift, metallurgy and solids handling.
|
Cost block |
Relative importance |
Conditions that increase cost |
|
Vapor compressor, motor and VFD |
Very high |
Large vapor flow, high pressure ratio, corrosive vapor, multiple stages, standby unit, low-noise enclosure and harmonic mitigation. |
|
Evaporator heat-transfer surface |
Very high |
Small temperature approach, low heat-transfer coefficient, fouling allowance, duplex/titanium metallurgy and removable bundles. |
|
Separator, circulation pumps and vacuum system |
High |
Foaming, entrainment, high viscosity, slurry service, high circulation velocity and redundant pumps. |
|
Piping, valves and instrumentation |
High |
High-alloy wetted parts, large diameters, control-valve rangeability and dense online analytics. |
|
CIP, pretreatment and feed conditioning |
Medium to very high |
Silica, calcium sulfate, organics, oil, biological growth, pH control and frequent grade changes. |
|
Crystallization and solids dewatering |
Very high where applicable |
ZLD duty, salt mixture, crystal-size control, centrifuge, dryer, mother-liquor recycle and disposal. |
|
Electrical, automation and plant integration |
Medium to high |
High-voltage connection, DCS integration, cybersecurity, remote monitoring and local code compliance. |
|
Engineering, testing and commissioning |
High for custom systems |
Pilot trials, process guarantees, HAZOP, PED/ASME documentation, FAT/SAT and long performance tests. |
4.2 Material Selection
|
Material option |
Typical use |
Cost / risk logic |
|
304/316L stainless steel |
Food, low-chloride process liquids and moderate corrosion |
Lower alloy cost, but unsuitable where chloride, temperature or pH creates pitting/SCC risk. |
|
Duplex / super duplex stainless |
Chloride-bearing and higher-pressure duties |
Higher material and welding cost; may reduce corrosion allowance and lifecycle risk. |
|
Nickel alloys |
Aggressive chemicals, high chloride, acidic or hot service |
Large CAPEX premium and longer fabrication lead time; must be justified by corrosion data. |
|
Titanium |
Severe chloride exposure and selected heat-transfer duties |
High material and fabrication cost but strong corrosion performance in suitable chemistry. |
|
Coated carbon steel / lined systems |
Non-critical external structures or compatible process areas |
Lower initial cost; lining integrity, inspection and repair access become lifecycle issues. |
4.3 Lead Time and Delivery Risk
A public Alfa Laval ZLD reference indicates 36–46 weeks for manufacture after order, followed by four to six weeks for shipping, one to two weeks for installation and another one to two weeks for commissioning. The total project cycle can exceed one year once front-end testing, design freeze, permitting and site preparation are included. High-alloy materials, custom compressors and late changes to feed chemistry are common schedule risks.
Source note: Alfa Laval ZLD Q&A; product-specific schedules vary by size, material and contract scope.
5. Energy Economics and Total Cost of Ownership
5.1 Electricity Sensitivity
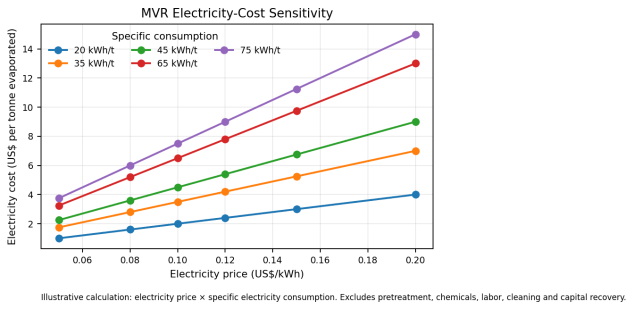
Figure 3. Electricity-cost contribution by power price and specific consumption. This is an operating-cost component, not total treatment cost.
|
SEC |
US$0.05/kWh |
US$0.10/kWh |
US$0.15/kWh |
US$0.20/kWh |
|
20 kWh/t |
$1.00/t |
$2.00/t |
$3.00/t |
$4.00/t |
|
35 kWh/t |
$1.75/t |
$3.50/t |
$5.25/t |
$7.00/t |
|
45 kWh/t |
$2.25/t |
$4.50/t |
$6.75/t |
$9.00/t |
|
65 kWh/t |
$3.25/t |
$6.50/t |
$9.75/t |
$13.00/t |
|
75 kWh/t |
$3.75/t |
$7.50/t |
$11.25/t |
$15.00/t |
5.2 Case-Specific Project Economics
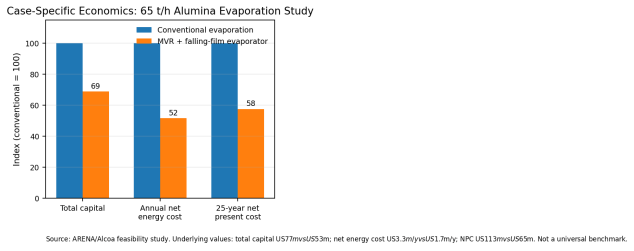
Figure 4. Public 65 t/h alumina feasibility case. Results depend on site infrastructure, energy prices, carbon assumptions and reuse of existing assets.
|
Metric |
Conventional evaporation |
MVR + falling-film |
Difference in public case |
|
Total capital |
US$77 million |
US$53 million |
MVR lower by US$25 million, partly because of smaller ancillary infrastructure. |
|
Gas consumption |
47 GJ/h |
0 GJ/h |
Continuous boiler-fuel demand removed within the stated boundary. |
|
Electricity consumption |
0.1 MW |
3.3 MW |
MVR shifts the energy source from steam/gas to electricity. |
|
Net energy cost |
US$3.3 million/year |
US$1.7 million/year |
MVR lower by US$1.7 million/year in the study assumptions. |
|
25-year net present cost |
US$113 million |
US$65 million |
MVR advantage of US$47 million. |
5.3 Illustrative TCO Model
The table below shows how buyers can compare energy costs for a notional 10 t/h evaporator operating 8,000 hours per year. It is a transparent sensitivity calculation, not a quotation. The TVR reference uses the PG&E report’s double-effect benchmark of 2.9 lb water evaporated per lb steam, equivalent to approximately 0.345 t steam per tonne of water removed.
|
Scenario |
MVR SEC |
Power price |
MVR energy |
Steam price |
TVR steam cost |
MVR saving |
|
Low-cost power / low steam |
35 kWh/t |
$0.06/kWh |
$168k/y |
$20/t |
$552k/y |
$384k/y |
|
Base case |
45 kWh/t |
$0.10/kWh |
$360k/y |
$35/t |
$966k/y |
$606k/y |
|
High power / high steam |
65 kWh/t |
$0.16/kWh |
$832k/y |
$50/t |
$1,380k/y |
$548k/y |
Simple payback should be calculated as incremental installed CAPEX divided by annual net savings, after adding compressor maintenance, cleaning, chemicals, labor, water value, avoided disposal, carbon cost and production availability. For retrofit projects, outage and tie-in costs can materially change the result. For new plants, avoided boiler, cooling-water and steam-distribution infrastructure may offset the higher sophistication of the MVR process island.
5.4 Lifecycle Variables Often Omitted from Bids
- Guaranteed specific energy consumption at defined feed, concentration, ambient temperature and turndown.
- Availability guarantee, cleaning interval, start-up time and annual production loss during CIP.
- Compressor overhaul interval, bearing and seal strategy, spare rotor/impeller philosophy and local service response.
- Condensate quality and reuse value; treatment required before returning water to process.
- Scale-control chemical cost, CIP waste disposal and membrane or pretreatment cost upstream.
- Noise attenuation, harmonic filters, power-factor correction and demand charges.
6. Global and Regional Cost Analysis
|
Region |
Typical cost position |
Key procurement and project issues |
|
China |
Competitive fabrication and integrated skid pricing; broad supplier base |
Verification of references, compressor origin, materials traceability, English documentation, performance guarantees, export packing and overseas service. |
|
Europe |
Higher engineering and fabrication cost; strong process integration and compliance capability |
PED/CE, ATEX where relevant, energy efficiency, detailed documentation, labor cost and long manufacturing schedules. |
|
North America |
High installed cost due to labor, codes and site work; attractive where disposal and steam costs are high |
ASME, UL/NFPA electrical requirements, union labor, domestic service, wastewater permits and production-outage cost. |
|
India |
Price-sensitive manufacturing and strong demand in ZLD-intensive industries |
Feed variability, local-content expectations, power quality, water-reuse economics, service depth and contract enforcement. |
|
Middle East |
Growing need for brine concentration, industrial water reuse and resource recovery |
High salinity, cooling conditions, corrosion, remote sites, power tariffs, local-content rules and integration with desalination or mining. |
|
Southeast Asia |
Mixed local and imported supply; food, palm, chemical and electronics applications |
Humidity, logistics, local electrical standards, wastewater regulation, operator capability and spare-parts lead time. |
|
Latin America / Africa |
Project economics can be attractive where water transport or disposal is expensive, but financing and service can dominate |
Currency risk, import duty, inland logistics, grid reliability, local technical support and operator training. |
6.1 Landed-Cost Adjustments
|
Adjustment |
Why it matters |
|
Freight and oversized transport |
Large separators and heat exchangers may require break-bulk shipping, special trailers, route surveys and temporary road works. |
|
Import duty and tax |
Classification may differ between complete plant, pressure vessels, compressors, pumps and electrical cabinets. |
|
Certification and inspection |
ASME/PED, welding qualifications, NDE, third-party inspection, hazardous-area compliance and local pressure-vessel registration. |
|
Site labor and cranage |
Can exceed ex-works savings in high-cost or remote markets. |
|
Power infrastructure |
Transformer, switchgear, VFD harmonic mitigation, backup strategy and grid connection are often outside vendor scope. |
|
Local service and spares |
A lower imported price may create higher downtime cost if compressor support and critical parts are distant. |
7. Competitive Logic and Supplier Positioning
Competition is bifurcating. Standardized packaged evaporators compete on modularity, delivery time and price, while large process and ZLD systems compete on process guarantees, compressor efficiency, feed chemistry expertise and plant integration. The strongest suppliers increasingly combine pilot testing, thermodynamic modeling, evaporation, crystallization, dewatering, automation and long-term service rather than selling an isolated vessel.
|
Competition dimension |
Low-price offer |
Lifecycle-value offer |
|
Process design |
Based on nominal flow and limited feed data |
Mass balance, boiling-point elevation, scaling prediction, pilot trials and defined operating envelope. |
|
Energy guarantee |
Nameplate motor power or generic SEC |
Measured SEC boundary, correction curves, turndown and liquid concentration conditions. |
|
Materials |
Minimum stated grade |
Corrosion review, material certificates, weld procedures and inspection plan. |
|
Reliability |
Single critical train and limited spares |
Redundancy study, critical-spares list, remote diagnostics and overhaul plan. |
|
Automation |
Local PLC and basic interlocks |
Plant DCS integration, historian, predictive maintenance, cybersecurity and recipe/CIP management. |
|
Commercial terms |
Short warranty, narrow exclusions |
Performance LDs, availability test, service response and lifecycle support. |
7.1 Where Lowest Price Still Wins
Lowest-price competition remains strong for clean, low-capacity, non-critical wastewater streams where disposal alternatives are available and downtime has limited production impact. It is less rational for continuous production, hazardous feed, high-salinity ZLD, valuable-product concentration or sites where a compressor failure stops the entire plant.
7.2 Bankability and Performance Acceptance
For project-financed or mission-critical installations, buyers increasingly require reference plants with similar chemistry and scale, guaranteed evaporation capacity, specific power, condensate quality, product concentration, availability and emissions/noise compliance. The contract should define correction methods and test duration so the supplier cannot pass acceptance under unusually favorable conditions.
8. Procurement Recommendations
|
Procurement checkpoint |
Required action |
|
Feed characterization |
Provide seasonal and upset analyses: TDS, COD/TOC, hardness, silica, sulfate, chloride, alkalinity, oil, suspended solids, foaming tendency and target solids. |
|
Pilot testing |
Require pilot or bench evaporation where scaling, foaming, crystallization, product quality or corrosion is uncertain. |
|
Mass and energy balance |
Obtain guaranteed water evaporation, concentrate flow, condensate quality, compressor power, pump power, steam at start-up and cooling demand. |
|
Battery limits |
Mark every mechanical, electrical, instrument, civil and utility tie-in on a responsibility matrix. |
|
Performance guarantee |
Define feed envelope, capacity, SEC, final concentration, condensate quality, turndown, availability and test method. |
|
Materials and fabrication |
Specify corrosion basis, material certificates, weld procedures, NDE, pickling/passivation and third-party inspection. |
|
Compressor package |
Confirm technology, pressure ratio, efficiency, anti-surge/control logic, bearings, seals, noise, vibration limits and overhaul support. |
|
Fouling and cleaning |
Set design fouling factor, cleaning interval target, CIP chemistry, cleaning duration and waste-disposal responsibility. |
|
Electrical quality |
Review motor starting, VFD harmonics, power factor, transformer capacity, grid stability and emergency shutdown. |
|
Spares and service |
Price commissioning spares, two-year operating spares, critical rotating spares, remote support and guaranteed response time. |
|
Commercial protection |
Use milestone payments tied to design approval, FAT, shipment, mechanical completion and performance acceptance; include LDs and warranty extensions. |
|
TCO comparison |
Normalize 10–20 year CAPEX, electricity, steam, chemicals, maintenance, downtime, recovered water/product and avoided disposal. |
9. Price Outlook for 2026–2028
|
Segment |
Expected price direction |
Reasoning and risks |
|
Standard clean-liquid falling-film MVR |
Stable to modestly softer in real terms |
Supplier competition, modular designs and manufacturing scale can offset copper and labor pressure. Nominal prices may still rise with inflation. |
|
Forced-circulation industrial wastewater MVR |
Broadly stable to moderately firmer |
Custom engineering, large pumps, separators, solids tolerance and site integration limit commoditization. |
|
High-alloy ZLD evaporator-crystallizers |
Firm / upward bias |
Nickel has eased, but duplex, nickel alloy or titanium fabrication, crystallization controls, dewatering and long testing remain expensive. |
|
Large process-industry retrofits |
Project-specific rather than market-wide |
Tie-in constraints, outage planning, existing steam/cooling infrastructure and owner standards dominate equipment inflation. |
|
Delivered systems in high-cost labor markets |
Upward bias |
Civil, electrical, compliance, installation and commissioning costs are likely to rise faster than factory equipment costs. |
|
Energy-driven TCO |
Increasingly favorable where low-carbon electricity is available |
MVR benefits improve as steam, gas, carbon and water-disposal costs rise, but high electricity demand charges can reverse the result. |
9.1 Base-Case View
The most likely global pattern is not a sharp decline in MVR evaporator prices. Standardized process packages may see better value per unit of evaporation, while custom high-alloy and ZLD systems remain firm because engineering, compressor, automation and site-integration content are difficult to commoditize. Buyers should expect quotation dispersion to remain wide and should treat unusually low bids as a signal to review feed assumptions, material grade, auxiliary loads and excluded scope.
9.2 Upside and Downside Risks
|
Risk |
Effect on delivered cost |
|
Copper and aluminium price increase |
Raises motors, drives, transformers, switchgear and cabling cost. |
|
Renewed nickel or alloy surcharge volatility |
Raises stainless, duplex and nickel-alloy heat-transfer equipment and piping cost. |
|
Power price volatility |
Changes OPEX and may alter compressor staging or hybrid steam/electric design. |
|
Tighter ZLD or discharge regulation |
Supports demand but increases pretreatment, crystallization, monitoring and solids-handling scope. |
|
Supply-chain localization |
Can reduce logistics and service risk, but local-content rules may raise near-term CAPEX. |
|
Compressor technology improvement |
Can reduce SEC and lifecycle cost, though premium high-efficiency equipment may raise initial price. |
Conclusion
MVR evaporators should not be purchased as generic wastewater equipment. Their economics arise from the interaction of thermodynamics, feed chemistry, rotating equipment, heat-transfer area, materials and site utilities. Public evidence confirms that MVR can reduce energy use dramatically in favorable applications and can outperform conventional evaporation on both operating and project cost. However, specific electricity consumption ranges from very low values in clean, low-lift duties to 65–75 kWh/t in demanding ZLD service, making feed-specific guarantees essential.
The price outlook through 2028 is therefore segmented. Standard clean-liquid packages may become more competitive, while forced-circulation and high-alloy crystallizing systems are likely to remain firm. Lower nickel prices alone will not create broad equipment deflation because copper, aluminium, skilled fabrication, compressors, controls and integration remain material cost drivers.
For buyers, the correct decision metric is guaranteed lifecycle cost per tonne evaporated at the required availability. A technically complete bid should disclose the energy-metering boundary, feed envelope, battery limits, materials, cleaning interval, compressor service plan and performance-test method. Suppliers that can demonstrate similar references, pilot-test difficult feeds and support the compressor locally are more likely to deliver real savings than suppliers offering the lowest initial skid price.