1. Global Market Scale and Growth Stage
Public market-revenue estimates differ because some datasets count battery packs only, while others include power conversion systems (PCS), energy management software, containers, civil works, engineering, procurement and construction (EPC), development fees, or long-term service. Capacity additions and installed-cost data are therefore more reliable for cross-market trend analysis than a single global revenue figure.
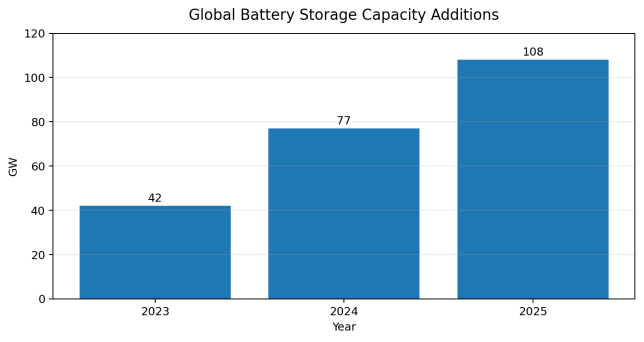
Figure 1. Global Battery Storage Capacity Additions
Source: IEA, Batteries and Secure Energy Transitions (2024) and Global Energy Review 2026. 2024 is an implied value based on the reported 2025 growth rate.
The 2025 addition of 108 GW was roughly eleven times the annual deployment level implied by 2021, according to the IEA. Growth is being driven by solar and wind integration, peak shifting, capacity adequacy, transmission congestion, frequency response, resilience requirements and increasingly by data-center and industrial-power demand. The next phase will involve both short-duration batteries and a broader portfolio of long-duration storage, flexible demand, grid expansion and dispatchable generation.
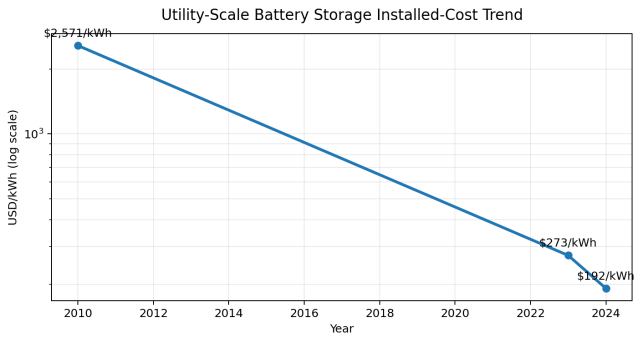
Figure 2. Utility-Scale Battery Storage Installed-Cost Trend
Source: IRENA, Renewable Power Generation Costs in 2024; IRENA World Energy Transitions Outlook 2024.
|
Metric |
Latest verified signal |
Interpretation |
|
Global battery additions |
108 GW in 2025 |
Approximately 40% above 2024; fastest-growing power technology. |
|
Dominant chemistry |
LFP ~90% of 2025 deployments |
Stationary systems prioritize cost, life and safety over maximum energy density. |
|
Utility-scale installed cost |
USD 192/kWh in 2024 |
Global benchmark; not a turnkey quote for every market or duration. |
|
2030 system requirement |
Global storage capacity more than sixfold versus 2023 in the IEA pathway |
Batteries supply about 90% of incremental storage; pumped hydro provides most of the remainder. |
|
U.S. additions |
15 GW in 2025; 24 GW planned for 2026 |
Pipeline remains large, but planned capacity is subject to delay or cancellation. |
2. Regional Market Structure
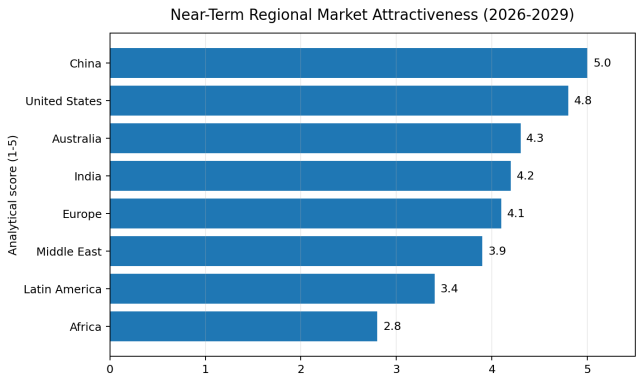
Figure 3. Near-Term Regional Market Attractiveness
Source: Analytical index based on deployment momentum, policy support, grid need, bankability and entry barriers; not a market-share forecast.
|
Region |
Market character |
Primary opportunity |
Principal entry constraint |
|
China |
Largest manufacturing base and rapid domestic deployment |
Utility-scale renewable integration, shared storage, C&I systems |
Severe price competition and qualification requirements |
|
United States |
Fast growth in ERCOT, CAISO and other markets |
Merchant and contracted utility-scale BESS; solar-plus-storage |
Interconnection queues, changing trade policy, local codes |
|
Europe |
Fragmented but deep flexibility market |
Balancing, capacity, congestion relief, C&I optimization |
Country-specific market design and permitting |
|
Australia |
High-renewables, mature big-battery market |
Grid-forming systems, energy shifting and ancillary services |
Revenue cannibalization and connection studies |
|
India |
Large renewable and peak-demand need |
Tenders for standalone and renewable-hybrid storage |
Aggressive tariffs, payment risk and localization |
|
Middle East |
Rapid solar expansion and state-backed procurement |
Large solar-plus-storage and isolated-grid projects |
Tender concentration and bankability requirements |
|
Latin America |
Growing renewable curtailment and resilience need |
Chile, Brazil, Mexico and islanded systems |
FX, financing and regulatory uncertainty |
|
Africa |
High need but uneven project bankability |
Mini-grids, mines, telecom, C&I and island systems |
Financing, service coverage and weak grids |
China sets the global equipment cost curve through cell, PCS and system-integration scale. The United States is a major profit pool because storage can participate in energy, capacity and ancillary-service markets, although project economics vary by region. Europe has strong demand for balancing and flexibility but remains highly fragmented. Australia is an important reference market for large batteries, grid-forming controls and high renewable penetration. Emerging markets often show strong technical need, but financing and contract design are the decisive filters.
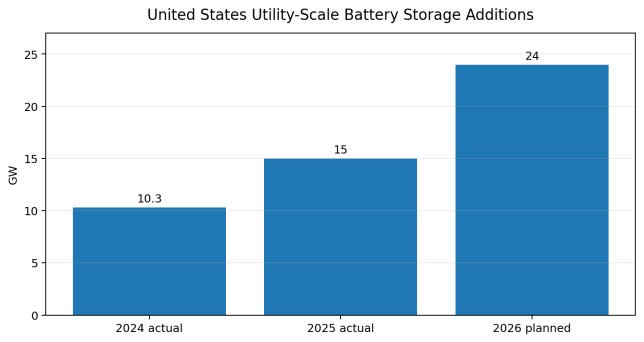
Figure 4. United States Utility-Scale Battery Storage Additions
Source: U.S. Energy Information Administration. 2024 and 2025 are reported additions; 2026 is developer-planned capacity as of February 2026.
3. Technology Roadmap and Product Evolution
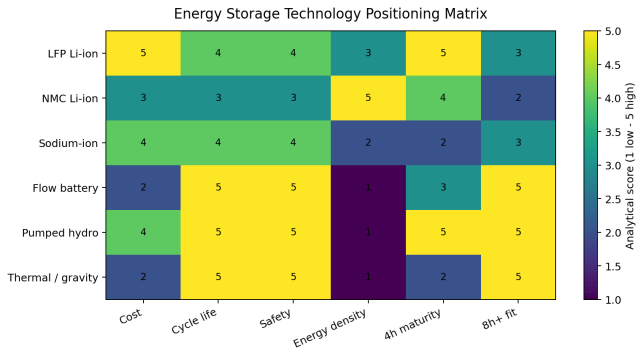
Figure 5. Energy Storage Technology Positioning Matrix
Source: Author analysis using public technical characteristics. Scores are comparative and illustrative, not test results.
|
Technology |
Typical duration |
Commercial position |
Best-fit applications |
Key limitation |
|
LFP lithium-ion |
1-6 hours |
Global default for new BESS |
Frequency response, peak shifting, solar firming, C&I |
Thermal-event management and degradation |
|
NMC lithium-ion |
1-4 hours |
Mature but losing stationary share |
Space-constrained or high-energy-density systems |
Higher cost and more demanding thermal safety |
|
Sodium-ion |
2-6 hours |
Early commercial scale-up |
Cost-sensitive stationary systems, cold climates |
Lower energy density and limited bankability history |
|
Flow batteries |
4-12+ hours |
Commercial niche / scaling |
High-cycle long-duration systems |
Higher upfront cost and larger footprint |
|
Pumped-storage hydro |
6-20+ hours |
Mature, dominant installed capacity |
Bulk storage and system adequacy |
Long development time and site dependence |
|
Thermal, gravity, compressed air |
4 hours to multi-day |
Technology-specific demonstrations and early projects |
Industrial heat, long-duration and capacity applications |
Project-specific efficiency and limited reference base |
LFP has become the standard chemistry because stationary storage values usable lifetime, safety and cost more than vehicle-grade energy density. Future product evolution will include higher-voltage architectures, larger container blocks, liquid cooling, improved propagation resistance, grid-forming inverters, direct-to-DC architectures, artificial-intelligence-assisted diagnostics and more sophisticated state-of-health estimation. Larger blocks can reduce balance-of-plant cost, but may increase concentration of failure risk and complicate fire separation and maintenance.
4. Cost, Pricing and Project Economics
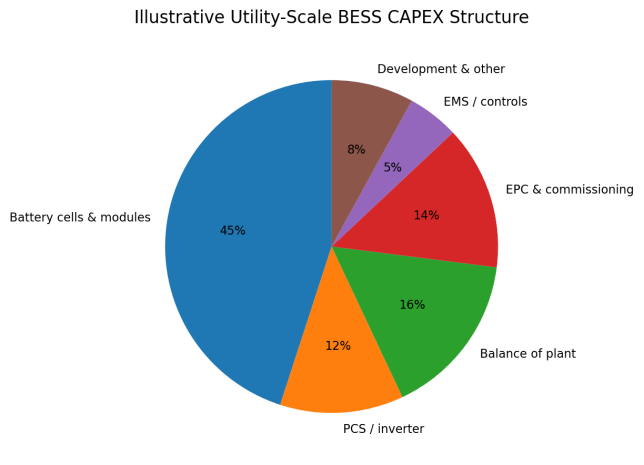
Figure 6. Illustrative Utility-Scale BESS CAPEX Structure
Source: Illustrative synthesis for a containerized lithium-ion project. Actual shares vary by duration, location, grid scope, tariff and contracting model.
A storage quotation should state whether pricing is ex-works, free on board (FOB), cost-insurance-freight (CIF), delivered-duty-paid (DDP), equipment-only, installed or turnkey EPC. Buyers should also distinguish nominal energy from usable energy at the point of interconnection and should normalize bids for duration, depth of discharge, efficiency, degradation, augmentation and end-of-life capacity.
|
Cost driver |
Direction |
Why it matters |
|
Battery cells |
Generally downward but volatile |
Largest equipment cost; sensitive to lithium, phosphate, graphite, utilization and trade measures. |
|
PCS and transformers |
Moderating with scale |
Grid-code, voltage and grid-forming requirements can add premiums. |
|
Civil and electrical balance of plant |
Location-specific |
Soil, drainage, fire setbacks, substation and cable runs create large project variance. |
|
Interconnection |
Often upward / uncertain |
Network upgrades and delay costs can dominate development economics. |
|
Financing |
Highly market-specific |
Interest rates, merchant exposure and warranty bankability affect weighted average cost of capital. |
|
Operations and augmentation |
Underestimated in low bids |
Capacity retention may require replacement modules, HVAC maintenance and software support. |
Levelized cost of storage (LCOS) is useful only when assumptions are explicit. Results change materially with cycle frequency, charging cost, round-trip efficiency, degradation, residual value, discount rate and revenue stacking. A four-hour battery used daily has a different economic profile from a reserve asset cycled only occasionally. Procurement should therefore evaluate a defined dispatch profile rather than rely on a generic LCOS number.
5. Value Chain and Supply Structure
The value chain includes critical minerals, active materials, cells, modules and racks, thermal management, battery management systems, PCS, transformers, switchgear, containers, fire detection and suppression, energy management software, project development, EPC, financing, market optimization and long-term service. Cell manufacturing remains concentrated in Asia, especially China. This creates cost advantages but also exposes projects to tariffs, shipping rules, local-content requirements and evolving cybersecurity or supply-chain restrictions.
|
Value-chain segment |
Current pressure |
Where premium remains |
|
Cells and standard containers |
Commoditization and overcapacity |
Traceability, safety validation, cycle life and warranty strength |
|
PCS / inverter |
Price competition |
Grid-forming capability, weak-grid performance and local grid-code certification |
|
System integration |
Margin compression |
Validated system architecture, controls, commissioning and availability guarantees |
|
Software / optimization |
Growing strategic value |
Forecasting, dispatch, market bidding, cybersecurity and multi-asset control |
|
EPC and grid connection |
Bottleneck in many markets |
Permitting, utility relationships, construction execution and risk allocation |
|
Long-term service |
Increasing value |
Local spares, augmentation planning, response times and balance-sheet support |
6. Competitive Landscape
Competition spans battery manufacturers, vertically integrated system suppliers, independent integrators, inverter companies, EPC contractors and software optimizers. Chinese suppliers compete strongly on manufacturing scale and price. North American and European firms often emphasize market integration, local compliance, optimization software and bankability. The boundary between supplier categories is becoming less distinct as cell makers offer complete AC or DC blocks and inverter manufacturers move into integrated solutions.
Supplier ranking should not rely on shipment volume alone. A bankable shortlist should test operating references in the target climate and grid, audited safety evidence, warranty reserves, response capability, software ownership, cybersecurity governance, local spare parts, augmentation commitments and the financial capacity to honor a 15- to 20-year service obligation.
7. International Market Entry and Export Opportunities
|
Entry route |
Best suited to |
Advantages |
Risks |
|
Direct equipment export |
Standardized C&I and utility blocks in import-friendly markets |
Fast market entry and low fixed cost |
Weak local service and importer dependence |
|
Local distributor / service partner |
Fragmented C&I and residential markets |
Customer access and local-language support |
Channel conflict and uneven technical capability |
|
EPC or developer partnership |
Utility-scale tenders and solar-plus-storage |
Project references and shared delivery risk |
Lower margin and dependence on partner pipeline |
|
Local assembly / integration |
Markets with tariffs or local-content rules |
Improved eligibility and service response |
Working-capital and quality-control burden |
|
Joint venture |
Strategic state-led markets |
Local credibility, licenses and financing access |
Governance, IP and partner-alignment risk |
|
Software / controls specialization |
Markets with commoditized hardware |
Higher recurring-value potential |
Requires proven interoperability and cyber compliance |
Exportable opportunities are strongest in standardized container systems, PCS, thermal management, fire safety components, battery management and energy management software, prefabricated substations, testing services, maintenance, repowering and augmentation. Direct equipment export is viable where standards are harmonized and local-content rules are limited. Local assembly, EPC partnership or service centers are more important in the United States, India, parts of Europe and state-led Middle Eastern procurement.
8. Procurement and Project Implications
- Define rated power, nominal energy, usable energy, point-of-interconnection capacity and duration separately.
- Compare guaranteed round-trip efficiency at the actual operating point, including HVAC and auxiliary loads.
- Require a degradation and augmentation schedule tied to the intended dispatch profile and ambient conditions.
- Specify availability, response time, ramp rate, reactive power and grid-forming obligations with test procedures.
- Review cell, rack, container and plant-level safety evidence, emergency response planning and local fire-code compliance.
- Test warranty exclusions for cycling, temperature, state of charge, downtime, software updates and third-party dispatch.
- Evaluate the supplier and guarantor balance sheet, not only the project special-purpose company.
- Clarify responsibility for grid studies, harmonic compliance, commissioning, performance testing and liquidated damages.
- Require cybersecurity controls, data ownership, remote-access governance and software-support commitments.
- Calculate lifecycle cost under downside cases for delayed interconnection, lower spreads and earlier augmentation.
9. Principal Risks and Mitigation
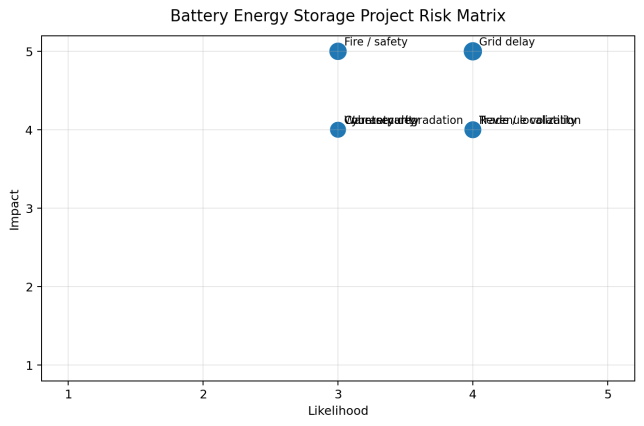
Figure 7. Battery Energy Storage Project Risk Matrix
Source: Author assessment for a typical utility-scale project; project-specific due diligence is required.
|
Risk |
Potential consequence |
Mitigation |
|
Thermal event / fire |
Asset loss, shutdown, permitting delay and reputational damage |
Propagation testing, separation, detection, ventilation, emergency plans and insurer review |
|
Grid-connection delay |
Lost revenue and financing carry |
Early studies, milestone rights, upgrade caps and delay contingencies |
|
Revenue compression |
Lower merchant returns |
Conservative forecasts, contracted floors and multi-market capability |
|
Degradation underperformance |
Reduced usable energy and early augmentation |
Dispatch-linked warranty, independent model review and performance tests |
|
Trade and localization changes |
Higher cost or ineligible equipment |
Dual sourcing, customs review, origin traceability and local assembly options |
|
Supplier distress |
Unsupported equipment and warranty loss |
Parent guarantees, escrow, step-in rights and spare-parts strategy |
|
Cybersecurity breach |
Operational disruption or market manipulation |
Network segmentation, access controls, patch policy, logs and incident response |
10. Conclusion and Outlook
The global energy storage system market will continue to expand rapidly, but growth quality is changing. Hardware prices are falling and standard lithium-ion blocks are becoming more commoditized. The value pool is shifting toward grid access, controls, optimization, safety engineering, project execution, financing and long-term service. Markets with high renewable penetration and functioning flexibility mechanisms will remain the most attractive, while emerging markets will require stronger guarantees and financing structures to convert technical demand into bankable projects.
LFP will retain the dominant position in short- and medium-duration battery storage through the near term. However, the requirement for eight-hour, multi-day and seasonal flexibility will create a portfolio market rather than a single-technology market. Successful suppliers will combine competitive equipment with certified safety, grid-code capability, transparent degradation guarantees, local service and credible balance-sheet support. Successful buyers will procure lifecycle performance and dispatch capability, not simply the lowest equipment price per kilowatt-hour.