1. Market Definition and Statistical Boundaries
This report defines FGD equipment as systems designed primarily to remove sulfur dioxide and related acid gases from combustion or process flue gas. The scope includes absorbers, spray towers, circulating fluidized-bed reactors, dry sorbent injection systems, reagent preparation and conveying, oxidation and dewatering, slurry pumps, fans, mist eliminators, wastewater systems, controls and project integration. It excludes general dust collectors, selective catalytic reduction systems and carbon-capture equipment unless they are commercially integrated with the FGD scope.
|
Market component |
Included in this report |
Typical commercial boundary |
|
Complete wet-FGD island |
Yes |
Absorber, reagent preparation, oxidation, gypsum dewatering, fans, ductwork and controls |
|
Dry / semi-dry FGD system |
Yes |
Reactor, sorbent handling, recirculation, fabric filter interface and controls |
|
Replacement and aftermarket |
Yes |
Pumps, nozzles, linings, mist eliminators, agitators, valves, instruments and service |
|
General air-pollution-control market |
No |
Broader market includes particulate, NOx, VOC and mercury-control equipment |
|
Civil works and full EPC |
Only where integral |
Commercial quotes may include or exclude foundations, buildings, stack modification and owner costs |
2. Global Demand Base and Market Stage
Coal-fired generation remains the largest installed demand base for FGD systems. Global Energy Monitor reported that 44.1 GW of coal capacity was commissioned and 25.2 GW retired in 2024, producing a net increase of 18.8 GW and taking the operating fleet to approximately 2,143 GW. Growth was highly concentrated in China and India. By 2025, coal development had become even more geographically concentrated, which implies that future large-unit FGD demand will be geographically narrower than the historical global roll-out.
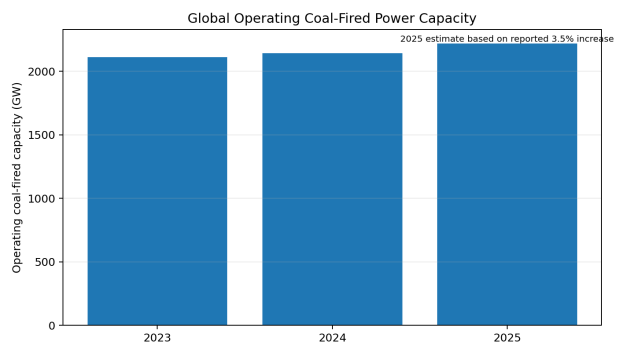
Figure 1. Global Operating Coal-Fired Power Capacity
Source: Global Energy Monitor, Boom and Bust Coal 2025 and 2026; 2025 value is an analytical estimate based on the reported annual percentage increase.
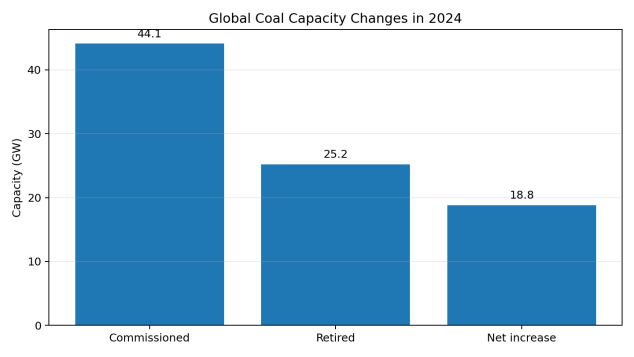
Figure 2. Global Coal Capacity Changes in 2024
Source: Global Energy Monitor, Boom and Bust Coal 2025.
The power-sector market is mature in several developed economies, but maturity does not mean absence of demand. Existing installations require absorber relining, pump and nozzle replacement, oxidation-system upgrades, wastewater treatment, mercury co-control optimization, digital monitoring and efficiency improvement. In emerging markets, the opportunity is more capital-equipment intensive and often tied to new generating units or mandatory retrofits.
Non-power industries are increasingly important. In China, ultra-low-emission programs for steel, cement and coking have broadened the addressable market. In the European Union, Industrial Emissions Directive permits and Best Available Techniques conclusions support continued investment in acid-gas control. Waste-to-energy plants and hazardous-waste incinerators also require high-reliability acid-gas removal, frequently favoring dry or semi-dry processes.
3. Regional Market Structure
|
Region |
Demand profile |
Preferred routes |
Commercial outlook |
|
China |
Large installed power fleet; replacement, optimization and non-power ultra-low-emission projects |
Wet FGD in power; CFB, SDA and integrated systems in steel/cement |
High volume but intense price competition; strong domestic supplier base |
|
India |
New coal units, delayed retrofits, high-sulfur fuel variability and compliance enforcement |
Wet limestone for large units; dry/semi-dry for selected industrial sites |
One of the strongest medium-term project markets |
|
Southeast Asia |
Coal additions in selected countries, industrial expansion and variable regulatory enforcement |
Wet FGD for utility projects; compact systems for industrial plants |
Project-specific opportunity; financing and implementation risk remain important |
|
Middle East |
Industrial boilers, refineries, smelters and selected power/desalination applications |
Seawater FGD, wet scrubbing and dry systems depending on location |
Moderate but high-value EPC-driven demand |
|
Europe |
Declining coal use but stringent industrial-emission regulation and refurbishment needs |
BAT-compliant wet or dry systems; retrofit and wastewater upgrades |
Low new-build volume, high compliance and service value |
|
North America |
Mature coal fleet, retirement uncertainty and established installed base |
Wet and dry FGD upgrades, parts and optimization |
Aftermarket-focused; capital projects selective |
|
Latin America |
Mining, metals, refining, industrial boilers and selected coal assets |
Site-specific wet, seawater or semi-dry systems |
Moderate demand constrained by financing and currency risk |
|
Africa |
Mining, smelting, cement, utility and industrial projects |
Low-water dry/semi-dry routes often attractive |
Long-term need is high, but bankable near-term projects are fewer |
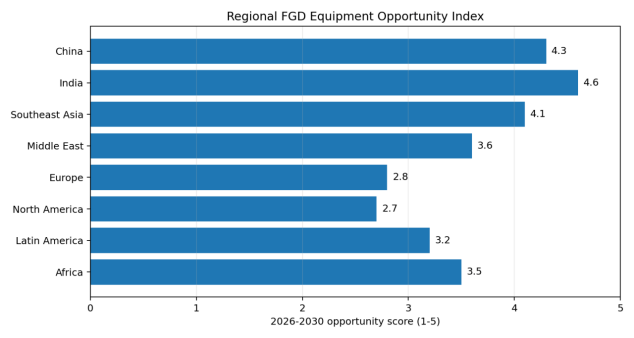
Figure 3. Regional FGD Equipment Opportunity Index
Source: Analytical index based on coal and industrial project pipeline, regulatory pressure, installed-base needs, financing conditions and local implementation capability. Not a market-share estimate.
4. Technology Roadmap and Product Evolution
Wet limestone-gypsum FGD remains the dominant large-unit technology because it can achieve high sulfur-dioxide removal over a broad operating range and can produce saleable gypsum where purity and local demand are adequate. However, wet systems involve significant pumps, tanks, corrosion-resistant materials, water consumption and wastewater management.
Spray dryer absorbers and circulating fluidized-bed dry scrubbers reduce liquid effluent and can fit tighter retrofit sites. Their commercial attractiveness rises where unit size is moderate, fuel sulfur is manageable, water is scarce, or the plant already uses a fabric filter. Dry sorbent injection has the lowest physical complexity but usually higher sorbent consumption and lower removal capability, making it better suited to polishing, smaller sources or moderate compliance requirements.
|
Technology |
Typical SO₂-removal capability |
Water use |
Best-fit applications |
Key limitations |
|
Wet limestone-gypsum |
High; commonly selected for >95% design removal |
High |
Large coal units, high sulfur loading, long operating hours |
Water, wastewater, corrosion, footprint and outage complexity |
|
Seawater FGD |
High where seawater chemistry and discharge rules permit |
Uses seawater |
Coastal power and industrial plants |
Location-specific; marine-discharge permitting |
|
Spray dryer absorber |
Medium to high |
Low to moderate |
Waste-to-energy, industrial boilers, smaller power units |
Sorbent cost, solids handling and temperature-window constraints |
|
Circulating fluidized-bed dry FGD |
High for suitable designs |
Low |
Steel sintering, cement, boilers and retrofit sites |
Pressure drop, solids recirculation and process-control complexity |
|
Dry sorbent injection |
Low to medium |
Very low |
Polishing, small sources, short remaining asset life |
High reagent consumption and limited deep-removal capability |
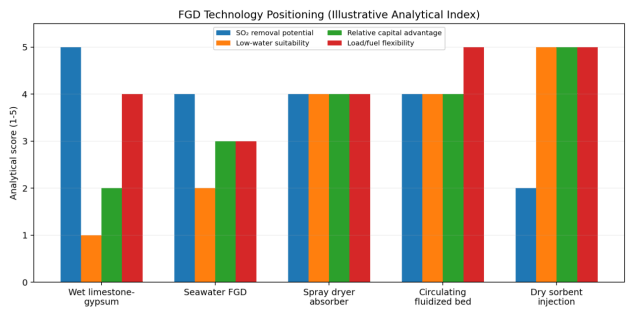
Figure 4. FGD Technology Positioning
Source: Illustrative analytical comparison prepared for this report. Scores are directional and project-specific engineering remains necessary.
5. Cost and Price Trends
FGD project prices are not directly comparable unless scope boundaries are normalized. A quotation may cover only the absorber and process equipment, while another includes civil works, duct modification, booster fans, stack works, electrical systems, wastewater treatment, commissioning, owner engineering and outage costs. Retrofits can cost substantially more per unit of flue-gas flow than greenfield installations because of congestion, tie-ins, structural reinforcement and outage constraints.
The U.S. Environmental Protection Agency's Air Pollution Control Cost Manual distinguishes direct equipment and installation costs from indirect and owner-related costs. It also notes that wastewater requirements can materially increase total capital investment for wet FGD. Dry systems often offer lower capital and water-management burden, but the advantage can be offset by reagent consumption, residuals disposal and lower sorbent utilization.
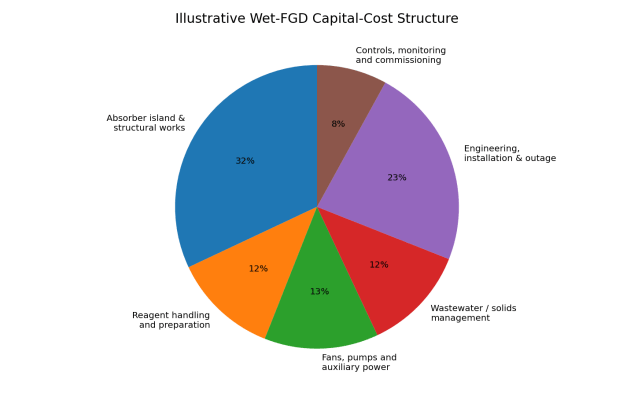
Figure 5. Illustrative Wet-FGD Capital-Cost Structure
Source: Analytical allocation for comparison only. Actual shares vary by plant size, retrofit complexity, wastewater scope, material selection and local construction cost.
|
Cost driver |
Direction of impact |
Why it matters |
|
Fuel sulfur content and variability |
Higher sulfur increases equipment duty and reagent consumption |
Affects absorber sizing, liquid-to-gas ratio, oxidation, dewatering and operating cost |
|
Removal guarantee and outlet limit |
Stricter guarantee raises design margin and equipment intensity |
Especially important for daily or hourly compliance limits |
|
Water availability and discharge standard |
Can materially raise CAPEX and OPEX |
May require zero-liquid-discharge or advanced wastewater treatment |
|
Retrofit congestion and outage window |
Raises installation and schedule risk |
Duct routing, crane access and tie-ins are often critical |
|
Reagent price and quality |
Direct OPEX driver |
Limestone reactivity and purity affect consumption and by-product quality |
|
By-product market |
Can offset cost or create disposal liability |
Gypsum sales depend on purity, transport distance and local construction demand |
|
Materials and corrosion allowance |
Higher-grade alloys and linings raise CAPEX but protect availability |
Poor material selection can dominate lifecycle maintenance cost |
|
Auxiliary electricity |
Permanent operating-cost burden |
Fans, pumps, mills, dewatering and wastewater systems reduce net plant output |
6. Value Chain and Supply Structure
The upstream value chain includes limestone, lime, sodium-based sorbents, specialty alloys, rubber and flake-glass linings, pumps, valves, nozzles, agitators, fans, mills, filters, instrumentation and control systems. Midstream value is created through process design, guarantees, equipment integration and retrofit engineering. Downstream value lies in construction, commissioning, reagent logistics, by-product marketing, wastewater management, long-term service and performance optimization.
Basic steelwork and commodity components are increasingly price competitive, while premium value remains in process know-how, corrosion management, guarantees under variable fuel conditions, control algorithms, wastewater integration and rapid service response. Suppliers able to bundle particulate, SO₂, acid-gas, mercury and NOx control can also capture larger EPC scopes, but integration risk and guarantee interfaces become more complex.
7. Competitive Landscape
The competitive landscape consists of global environmental-technology groups, regional boiler and power-engineering companies, specialized scrubber suppliers, Chinese engineering contractors and component manufacturers. Market position varies by region and application; no single supplier leads every segment. Large utility projects tend to require proven references, process guarantees, balance-sheet strength and local execution capacity. Industrial projects place greater weight on compact layout, integration with existing dust-control equipment and operating flexibility.
|
Supplier tier |
Typical strengths |
Typical weaknesses |
Best-fit opportunity |
|
Global process licensors and EPC groups |
Strong references, guarantees, engineering depth and international compliance |
Higher cost and slower commercial response |
Large utility, refinery, smelter and complex retrofit projects |
|
Chinese integrated suppliers |
Competitive equipment pricing, broad manufacturing base and large domestic reference pool |
Bankability, localization and long-term overseas service vary by company |
Asia, Middle East, Africa and price-sensitive EPC projects |
|
Regional engineering firms |
Local codes, construction capability and customer access |
May depend on external process technology |
Retrofit, installation and service partnerships |
|
Specialist component suppliers |
Technical depth in pumps, nozzles, linings, controls or dewatering |
Limited ability to guarantee complete-process performance |
Aftermarket, efficiency upgrades and OEM partnerships |
|
Small system integrators |
Fast response and customization |
Limited balance sheet and reference scale |
Industrial boilers and compact dry/semi-dry systems |
8. International Market Entry and Export Opportunities
Direct equipment export is most viable for standardized components and modular subsystems, including slurry pumps, agitators, nozzles, mist eliminators, reagent-preparation packages, dry-sorbent skids, dewatering equipment, control cabinets and corrosion-resistant internals. Complete FGD islands usually require local engineering, civil integration, installation supervision, emissions guarantees and long-term service.
- Prioritize markets where emission rules are enforceable, project finance is credible and host assets have sufficient remaining life.
- Use local EPC or boiler-partner channels where permitting, civil works and outage execution dominate project risk.
- Prepare performance references by fuel sulfur, flue-gas volume, inlet temperature, chloride concentration and required outlet limit rather than by plant capacity alone.
- Provide English and local-language operating manuals, spare-parts plans, commissioning procedures and training packages.
- Clarify Incoterms and scope boundaries, particularly civil works, electrical systems, stack modification, wastewater treatment and performance testing.
- Build local service capability before offering long-term availability or consumption guarantees.
9. Procurement and Project Implications
|
Procurement checkpoint |
Buyer question |
Reason |
|
Design basis |
Are fuel sulfur, flue-gas flow, oxygen basis, moisture and temperature ranges fully defined? |
Incorrect design basis is the most common cause of performance and cost disputes |
|
Guarantee basis |
Is the outlet limit hourly, daily or annual, and at what reference oxygen and dry/wet basis? |
Guarantees are meaningless without a normalized measurement basis |
|
Scope boundary |
Who supplies ductwork, fans, electrical systems, wastewater plant, stack works and civil foundations? |
Prevents false low-price comparisons |
|
Reagent and by-product |
What limestone quality is assumed and what gypsum purity is guaranteed? |
Directly affects OPEX and disposal economics |
|
Materials |
What chloride level, pH, temperature and erosion duty were used for material selection? |
Critical to corrosion and reliability |
|
Auxiliary load |
Is power consumption guaranteed at design and turndown conditions? |
Affects net plant efficiency and operating cost |
|
Availability and maintenance |
What redundancy, spare-parts inventory and service response are included? |
High removal efficiency is insufficient if the system is unavailable |
|
Wastewater |
Are selenium, mercury, chlorides and discharge limits addressed? |
Can become a separate high-cost project |
|
Testing |
Who appoints the test agency and how are fuel or load deviations handled? |
Avoids acceptance disputes |
|
Asset life |
Does the FGD payback match the remaining operating life of the host plant? |
Prevents overinvestment in assets facing early retirement |
10. Key Risks
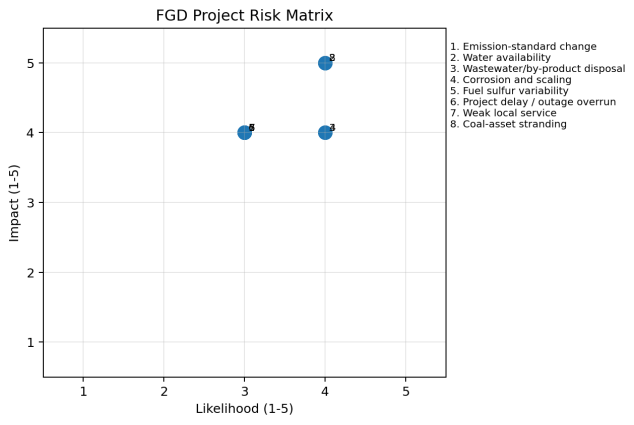
Figure 6. FGD Project Risk Matrix
Source: Analytical assessment for international FGD projects; project-specific risk scores should be developed during due diligence.
Water scarcity and wastewater disposal are among the most material risks for wet FGD. Corrosion, scaling and erosion are the main reliability risks. Commercially, the largest risks are under-defined scope, unrealistic outage assumptions, weak local service and guarantees that do not match the actual fuel envelope. At portfolio level, coal-asset retirement and declining utilization can undermine the economics of a new FGD investment even where environmental compliance remains technically achievable.
11. Outlook to 2030
Through 2030, the global FGD equipment market is expected to remain active but become more concentrated and application-specific. Large greenfield wet-FGD projects will be led primarily by Asian coal and industrial projects. Mature markets will emphasize aftermarket, reliability, digital optimization, wastewater treatment and selective refurbishment. Dry and semi-dry technologies should gain share in non-power industries and water-constrained regions, particularly where multi-pollutant control and compact retrofit design are valued.
The strongest suppliers will not necessarily be those with the lowest initial equipment price. Competitive advantage will increasingly depend on verified lifecycle performance, integration capability, local service, corrosion management, flexible-load operation and the ability to guarantee emissions under changing fuel and process conditions.