1. Scope, Definitions and Methodology
1.1 Product Scope
The term “seawater desalination equipment” covers a hierarchy of supply packages. At the narrowest level, it may mean an RO skid or membrane train. At utility scale, it can include seawater intake and screening, pretreatment, cartridge filtration, high-pressure pumping, energy recovery, RO membranes and pressure vessels, chemical dosing, clean-in-place systems, remineralization, disinfection, brine discharge, electrical distribution, automation, buildings and commissioning. Thermal projects add evaporators, condensers, heat-transfer systems and steam integration.
1.2 Price Definitions Used in This Report
|
Price boundary |
What it includes |
What it usually excludes |
|
Equipment-only / process package |
RO trains, pumps, energy-recovery devices, membranes, pressure vessels, dosing and local controls. |
Marine works, major civil works, grid connection, buildings, owner’s costs and financing. |
|
Ex works (EXW) |
Equipment made available at the supplier’s works. |
Export packaging, inland freight, port charges, ocean freight, insurance, duties and installation. |
|
FOB / CIF |
FOB adds export clearance and loading; CIF adds ocean freight and insurance to destination port. |
Import duties, inland delivery, civil works, installation, commissioning and performance testing. |
|
EPC price |
Engineering, procurement and construction within defined battery limits. |
Financing, owner’s network works, water conveyance and items expressly excluded from battery limits. |
|
Total project investment |
EPC plus development, owner’s costs, financing reserves and other disclosed project components. |
May still exclude off-site transmission or government-provided infrastructure. |
|
Water-production cost / IWP tariff |
Long-term unit cost or tariff reflecting capital recovery, energy, O&M, financing and risk allocation. |
Retail distribution, sewerage, wastewater treatment and sometimes water conveyance. |
1.3 Data Quality and Normalization
- All material figures are traceable to World Bank publications, official utility disclosures or developer project pages available through June 2026.
- Project investment was divided by disclosed design capacity to create a directional capital-intensity indicator. This is not presented as equipment price because project scope varies.
- The Hassyan investment was converted from AED to US dollars using the UAE dirham’s fixed rate of AED 3.6725 per US dollar; 180 imperial million gallons per day was converted to approximately 818,280 m³/day.
- Commodity series use annual nominal averages and are indexed to 2021 = 100. They indicate input-cost pressure rather than a direct bill-of-materials pass-through.
- Forward-looking statements are analytical scenarios, not confirmed supplier quotations or investment outcomes.
2. Technology and Equipment Architecture
2.1 SWRO Process and Cost-Relevant Equipment
Modern seawater reverse osmosis (SWRO) applies pressure above the seawater osmotic pressure, typically through high-pressure pumps, to force water through semipermeable membranes while retaining dissolved salts. Typical recovery is approximately 40–60%, meaning that intake, pretreatment and brine-handling capacity must be sized above product-water output. The economic performance of the plant therefore depends on the complete process chain, not only the membrane element.
|
System block |
Main equipment |
Primary cost and performance variables |
|
Seawater intake |
Open intake screens, pumps, tunnels/pipes or beach wells |
Marine geology, algal events, suspended solids, pumping head, environmental constraints and redundancy. |
|
Pretreatment |
Coagulation, dissolved-air flotation, media filtration, ultrafiltration and cartridge filters |
Feedwater variability, biofouling risk, chemical use, footprint, backwash and waste handling. |
|
High-pressure section |
High-pressure pumps, motors, variable-speed drives and manifolds |
Pump efficiency, pressure requirement, availability, corrosion resistance and spare philosophy. |
|
RO trains |
Pressure vessels, membranes, interconnectors and instrumentation |
Flux, salt rejection, recovery ratio, membrane life, cleaning frequency and train redundancy. |
|
Energy recovery |
Isobaric pressure exchangers or turbine-based devices |
Efficiency, turndown, maintenance and interaction with pump configuration. |
|
Post-treatment |
Remineralization, pH adjustment and disinfection |
Product-water quality, corrosion control, chemical consumption and local drinking-water standards. |
|
Brine and outfall |
Diffusers, outfall pipelines, pumps and monitoring systems |
Bathymetry, dispersion, cumulative impacts, permitting and environmental monitoring. |
|
Electrical and controls |
Transformers, switchgear, drives, SCADA, analyzers and cybersecurity |
Grid voltage, harmonic requirements, redundancy, automation architecture and local certification. |
2.2 SWRO Versus Thermal Routes
|
Technology |
Typical energy use |
Typical recovery |
Economic strengths |
Cost and risk constraints |
|
SWRO |
2.5–5.5 kWh/m³ electricity |
40–60% |
Lowest energy demand; modular; strong scale economics; compatible with renewable electricity. |
Sensitive to feedwater quality and biofouling; requires robust pretreatment and membrane management. |
|
MED / MED-TVC |
5.5–12.0 kWh/m³ equivalent |
25–40% |
Lower thermal energy than MSF; can use low-grade heat; suitable where waste heat is available. |
Heat-transfer surfaces, scaling, steam integration and larger thermal-equipment scope. |
|
MSF |
9.0–16.0 kWh/m³ equivalent |
20–30% |
Mature, robust and historically integrated with large power plants. |
Highest energy intensity; large civil/thermal scope; increasingly displaced by RO in new projects. |
|
Hybrid |
Project-specific |
Project-specific |
Balances power/water demand and can share intake/outfall and infrastructure. |
More complex dispatch, controls and lifecycle optimization; not automatically cheaper. |
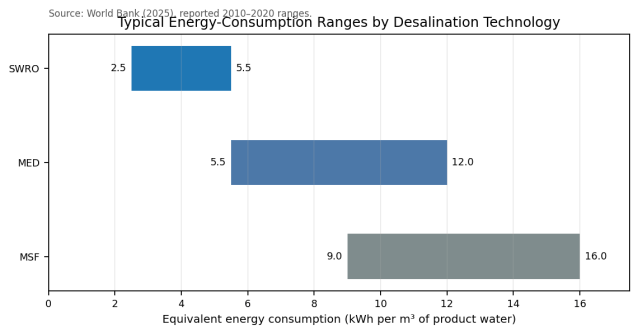
Figure 1. Typical energy-consumption ranges by desalination technology. Thermal values are expressed on an equivalent-energy basis.
3. Price, CAPEX and Water-Cost Evidence
3.1 Why There Is No Single Global Equipment Price
A desalination project is engineered around source-water quality, output specification, intake conditions, marine outfall, site elevation, power interface and environmental requirements. A 100,000 m³/day plant using a screened open intake in benign Mediterranean water is not economically identical to a plant of the same output in warm, high-salinity Gulf water with severe algal risk. Equipment quotations are also commonly confidential and use different battery limits. A defensible price analysis must therefore separate publicly disclosed EPC or project investment from water-production tariffs and from narrow equipment packages.
3.2 Published Cost and Tariff Benchmarks
|
Benchmark |
Published value |
Period / scope |
Interpretation |
|
Long-term cost reduction |
US$2.5–5.0/m³ in the 1980s to an average below US$1.0/m³ |
World Bank 2025 historical synthesis |
Broad desalination cost trend; not an inflation-adjusted equipment-price index. |
|
Leading project range |
Approximately US$0.4–0.5/m³ |
Late 2010s and early 2020s |
Best-in-class water cost/tariff evidence under favorable scale and financing conditions. |
|
MENA RO awards |
Median US$0.52/m³ across 17 RO plants |
Projects awarded 2019–2025 |
Useful recent regional benchmark, but plant and contract scopes differ. |
|
Hassyan IWP |
US$0.36536/m³ |
180 MIGD UAE IWP; completion planned Q1 2027 |
Contracted water tariff, not equipment price; benefits from scale and long-term offtake. |
|
Indicative EPC range |
US$2–6 million per 1 MCM/year placed online |
Subset of plants ≥5 MCM/year awarded since 2010 |
Equivalent to roughly US$730–2,190 per m³/day; published range for EPC, not all-in investment. |
3.3 Capital Intensity of Selected Large Projects
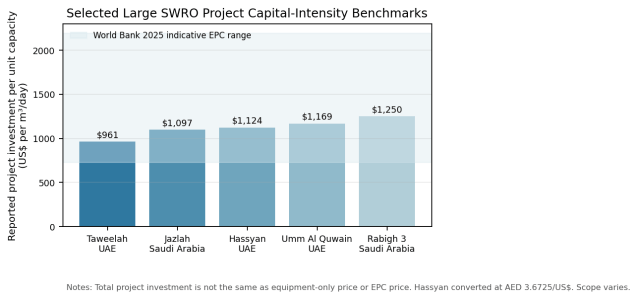
Figure 2. Selected project capital-intensity benchmarks. Values are directional because total project investment and scope are not standardized.
|
Project |
Capacity (m³/day) |
Reported investment |
Calculated intensity |
Scope note |
|
Taweelah RO, UAE |
909,200 |
US$874 million |
US$961 per m³/day |
Large IWP; project-level investment. |
|
Jazlah IWP, Saudi Arabia |
600,000 |
US$658 million |
US$1,097 per m³/day |
Includes integrated project development; 45.5 MW solar disclosed separately in project description. |
|
Hassyan SWRO, UAE |
≈818,280 |
AED3.377 billion (≈US$919.5m) |
US$1,124 per m³/day |
Under development; clean-energy IWP; all phases planned by Q1 2027. |
|
Umm Al Quwain IWP, UAE |
681,900 |
US$797 million |
US$1,169 per m³/day |
Large IWP project investment. |
|
Rabigh 3 IWP, Saudi Arabia |
600,000 |
US$750 million |
US$1,250 per m³/day |
Large operational SWRO IWP. |
3.4 What Drives Project-Level Price Dispersion
|
Driver |
Lower-cost configuration |
Higher-cost configuration |
|
Intake |
Existing shared intake, favorable bathymetry, screened open intake |
Long offshore tunnel, beach wells, difficult geology, high redundancy or severe algal risk. |
|
Pretreatment |
Stable feedwater, conventional filtration |
DAF/UF-heavy pretreatment, seasonal algae, oil contamination or extreme turbidity. |
|
Power |
Low-cost long-term supply, short grid connection |
Remote grid reinforcement, backup generation, storage or high power price. |
|
Plant scale |
Large standardized trains with high utilization |
Small custom plant, low capacity factor or high redundancy. |
|
Water conveyance |
Coastal use near plant elevation |
Long-distance transmission, large reservoirs and high lift. |
|
Environmental scope |
Existing outfall and moderate monitoring |
New marine outfall, cumulative-impact studies, diffuser optimization and long-term monitoring. |
|
Commercial structure |
Creditworthy offtaker and competitive debt |
Weak offtaker, currency mismatch, high interest rate, political risk and expensive guarantees. |
4. Cost Structure and Operating Economics
4.1 Capital-Cost Structure
The process equipment package is central to plant performance, but it is not the majority of total capital cost in every project. A World Bank reference range for MENA SWRO projects assigns approximately 30.0–35.5% to the desalination-system equipment itself. Construction-related items account for 52–68% in aggregate, while engineering, project development, financing and contingency can account for the remaining 32–48%. The relatively large indirect-cost share explains why projects with similar membrane capacity can have materially different total investment.
|
SWRO capital-cost item |
Reference share of total CAPEX |
Procurement implication |
|
Site preparation, roads and parking |
0.5–1.5% |
Usually local civil scope; land and geotechnical conditions matter. |
|
Seawater intake |
4.5–6.0% |
Can rise substantially where tunnels, offshore works or beach wells are required. |
|
Pretreatment |
8.0–10.0% |
Must be designed around real feedwater variability, not average laboratory values. |
|
Desalination-system equipment |
30.0–35.5% |
RO trains, pressure vessels, pumps, ERDs and local process systems. |
|
Post-treatment |
1.0–2.0% |
Depends on potable-water standard and remineralization route. |
|
Concentrate disposal |
1.5–2.0% |
Reference share can be exceeded by long outfalls or difficult marine permitting. |
|
Electrical and instrumentation |
1.5–2.5% |
Grid voltage, redundancy, switchgear, drives, automation and cybersecurity. |
|
Buildings |
2.5–3.5% |
Local climate, architecture, noise and corrosion-control requirements. |
|
Start-up and acceptance testing |
1.0–2.0% |
Performance tests, consumables, training, commissioning spares and temporary works. |
|
Engineering services |
10.0–15.0% |
Pilot testing, detailed design, construction oversight and integration. |
|
Project development |
6.0–9.0% |
Permitting, environmental studies, legal work and contract management. |
|
Financing costs |
6.0–10.0% |
Interest during construction, reserves and financing fees. |
|
Contingency |
10.0–15.0% |
Site maturity, design completeness and risk allocation drive the requirement. |
4.2 Operating-Cost Structure
SWRO OPEX is dominated by electricity but remains strongly influenced by chemicals, membranes, cartridge filters, maintenance, labor and environmental monitoring. The World Bank’s MENA reference ranges indicate electrical energy at 37–45% of O&M, chemicals at 10–12%, membrane and cartridge-filter replacement at 4–6%, and waste-stream disposal at 2.5–5%. Fixed O&M—labor, maintenance, monitoring and indirect costs—accounts for approximately 32–46.5%.
|
SWRO O&M item |
Reference share of O&M |
Main volatility factors |
|
Electrical energy |
37–45% |
Electricity tariff, SEC, plant loading, pumping head and grid losses. |
|
Chemicals |
10–12% |
Feedwater quality, dosing strategy, chemical prices and cleaning frequency. |
|
Membranes and cartridge filters |
4–6% |
Flux, fouling, integrity, warranty, replacement interval and disposal. |
|
Waste-stream disposal |
2.5–5% |
Sludge volume, brine management, monitoring and local disposal charges. |
|
Labor |
12–14.5% |
Automation level, staffing model, localization and labor market. |
|
Maintenance |
13–15% |
Equipment redundancy, corrosion, preventive maintenance and spares strategy. |
|
Environmental/performance monitoring |
2–5% |
Permit conditions, marine ecology and online analyzer requirements. |
|
Indirect O&M |
5–12% |
Insurance, administration, security, training and corporate overhead. |
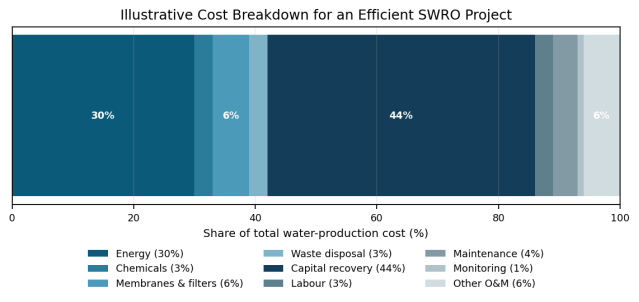
Figure 3. Illustrative water-production cost breakdown for an efficient SWRO project. This is a reference case, not a universal bill of costs.
5. Raw Materials and Supply-Chain Exposure
5.1 Commodity Exposure Is Concentrated in Specific Packages
Desalination plants are not traded as a single commodity, but several equipment groups remain exposed to global metals and engineered-material markets. Copper affects motors, transformers, switchgear, variable-speed drives and cabling. Aluminium is used in electrical and structural applications. Nickel-bearing stainless and duplex steels are relevant to high-pressure piping, pumps, valves and corrosion-resistant components. Carbon steel and iron ore influence civil reinforcement, structural frames and pipework, while polymers and fiberglass-reinforced plastic affect low-pressure piping and vessels.
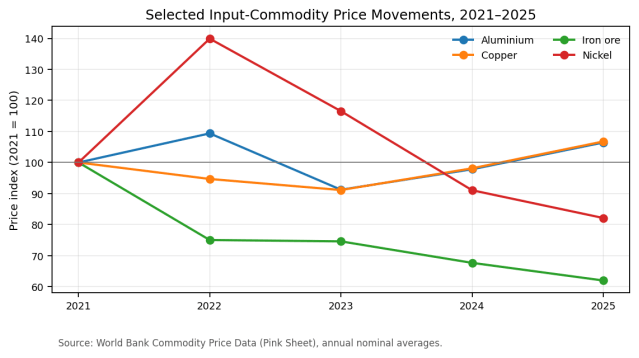
Figure 4. Selected input-commodity price indices. Commodity movements do not translate one-for-one into equipment prices because fabrication, engineering, qualification, supplier margins and contracts intervene.
5.2 Interpretation of the 2021–2026 Cost Cycle
- Iron ore’s 2025 annual average was approximately 38% below its 2021 level, easing some structural-steel pressure, although fabricated and corrosion-protected structures also depend on labor, energy and local capacity.
- Nickel’s annual average fell materially from its 2022 peak and ended 2025 below 2021, but stainless and duplex-alloy quotations can remain sticky because alloy surcharges, fabrication complexity and qualification requirements lag the commodity cycle.
- Copper and aluminium ended 2025 above 2021 averages. These metals are disproportionately important to electrical distribution, motors and high-efficiency rotating equipment.
- The World Bank’s April 2026 commodity outlook increased its metals and minerals price forecast, with copper and aluminium expected to reach record annual averages in 2026. Buyers should therefore avoid assuming that falling iron ore or nickel automatically reduces the complete plant quotation.
5.3 Non-Commodity Supply Risks
|
Supply category |
Risk mechanism |
Recommended commercial response |
|
RO membranes |
Qualified-product concentration, lead time, feedwater compatibility and warranty limitations. |
Approve equivalent makes only after performance modelling and lifecycle-cost review; lock in replacement terms. |
|
Energy recovery devices |
High efficiency and reliability are critical; limited substitutes in some performance classes. |
Specify guaranteed efficiency, turndown, vibration limits, spare rotor/cartridge policy and service response. |
|
High-pressure pumps |
Long-lead castings, duplex materials, motors and factory testing. |
Reserve manufacturing slots, witness performance tests and define spare rotating assemblies. |
|
Electrical packages |
Copper, semiconductors, transformers and switchgear can have volatile lead times. |
Require vendor schedule transparency, approved alternates, harmonic studies and staged inspection. |
|
Marine equipment |
Large pipes, diffusers, screens, tunnelling and specialist vessels are location-dependent. |
Separate geotechnical risk, survey responsibilities and marine-weather allowances clearly. |
|
Chemicals and consumables |
Local availability, import restrictions and product consistency affect OPEX. |
Test locally available chemicals, define quality standards and establish dual sourcing. |
6. Levelized Cost of Water and Total Cost of Ownership
6.1 The Relevant Economic Metric
For municipal and industrial buyers, the relevant metric is the levelized cost of water (LCOW): the present value of capital recovery, energy, chemicals, membranes, labor, maintenance, environmental compliance and residual obligations divided by the present value of delivered product water. A quotation can be cheaper while LCOW is higher if it uses more electricity, has lower availability, requires more frequent cleaning, shortens membrane life or transfers important scope back to the owner.
6.2 Electricity Sensitivity
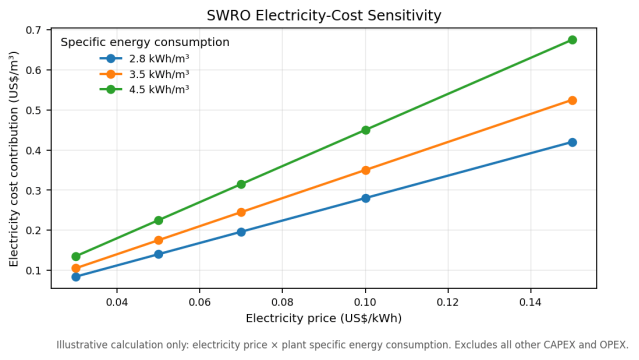
Figure 5. Electricity-cost contribution to product-water cost. This calculation excludes capital recovery and all non-energy O&M.
|
Electricity price |
2.8 kWh/m³ |
3.5 kWh/m³ |
4.5 kWh/m³ |
|
$0.03/kWh |
$0.084/m³ |
$0.105/m³ |
$0.135/m³ |
|
$0.05/kWh |
$0.140/m³ |
$0.175/m³ |
$0.225/m³ |
|
$0.07/kWh |
$0.196/m³ |
$0.245/m³ |
$0.315/m³ |
|
$0.10/kWh |
$0.280/m³ |
$0.350/m³ |
$0.450/m³ |
|
$0.15/kWh |
$0.420/m³ |
$0.525/m³ |
$0.675/m³ |
6.3 Other High-Leverage LCOW Variables
|
Variable |
Why it matters |
Buyer test |
|
Capacity factor and availability |
Capital recovery is spread across actual delivered volume; outages sharply increase unit cost. |
Model at guaranteed, expected and downside availability; include liquidated damages and recovery plans. |
|
Recovery ratio |
Higher recovery reduces intake and pretreatment volume but raises scaling, osmotic pressure and brine concentration. |
Optimize total plant energy and chemical use rather than maximizing recovery in isolation. |
|
Membrane flux and life |
High flux can reduce initial membrane area but increase fouling and replacement risk. |
Review pilot data, normalized permeability decline, cleaning frequency and replacement warranty. |
|
Pretreatment resilience |
Under-designed pretreatment causes downtime, chemical use and membrane damage. |
Use seasonal source-water data and define performance during algal blooms and turbidity events. |
|
Financing cost |
Capital recovery can be the largest single LCOW component. |
Test WACC, debt tenor, construction delay and indexation; do not compare tariffs with different financing assumptions. |
|
Water conveyance |
Pumping and pipelines may equal or exceed plant-side savings. |
Calculate delivered-water cost at the demand centre, including lift, transmission losses and reservoirs. |
|
Residual and decommissioning obligations |
Marine structures, membranes, chemical systems and site restoration create end-of-life cost. |
Define ownership, removal obligations, residual value and environmental liability. |
7. Global and Regional Cost Analysis
Regional differences arise from a combination of feedwater conditions, plant scale, power cost, financing, environmental rules, labor, local content, port access and the maturity of the desalination supply chain. The table below describes procurement economics rather than ranking regions by a single price.
|
Region |
Typical economic profile |
Cost advantages |
Key cost risks |
|
GCC / Middle East |
Mega-scale IWP market with long-term offtake, strong competitive procurement and rapid shift to SWRO. |
Scale, repeat developers, standardized financing, low-cost solar and established EPC/O&M ecosystem. |
High salinity and temperature, algal blooms, cumulative marine impacts, local content, difficult intake/outfall and contract indexation. |
|
Mediterranean Europe / Israel |
Mature SWRO systems, strict potable-water and environmental requirements, high reliability expectations. |
Strong engineering capability, operating experience, competitive membranes and proven pretreatment design. |
Higher labor and permitting cost, energy-price volatility, marine ecology and complex public procurement. |
|
North America / Australia |
Project-specific plants with high regulatory, environmental and community-engagement requirements. |
Strong technical standards, bankable contracts and advanced automation. |
Long approvals, labor cost, intake/outfall mitigation, coastal permitting, grid cost and litigation risk. |
|
China and East Asia |
Large manufacturing base for pumps, pressure vessels, electrical equipment and modular systems; mixed municipal and industrial demand. |
Competitive fabrication, integrated supply chains and export capability. |
Qualification of equivalent equipment, project references, local standards, export logistics and lifecycle service in destination markets. |
|
India / South Asia |
Growing municipal and industrial demand; strong sensitivity to tariff and financing. |
Competitive engineering labor, industrial EPC capability and local manufacturing potential. |
Power reliability and price, currency, land, offtaker credit, intake conditions and delayed payment. |
|
Islands / Caribbean / Pacific |
Small to medium decentralized plants, often diesel- or renewable-powered, with limited redundancy and logistics. |
Modular systems, packaged treatment and potential solar integration. |
Small scale, high freight, fuel cost, limited spares, operator capacity, cyclone resilience and brine dispersion. |
|
Africa outside MENA |
Selective coastal municipal, mining and industrial projects; financing and utility bankability are central. |
Potential renewable integration and modular development in phases. |
Sovereign/currency risk, transmission, local O&M capability, spare-parts logistics and affordability. |
7.1 Delivered Cost and Trade Terms
Imported process equipment may look competitively priced at FOB level yet become expensive after ocean freight, oversized cargo handling, duties, inland transport, local installation, testing, certification and spare-parts stocking. Conversely, full local fabrication does not necessarily minimize LCOW when critical high-pressure, membrane or energy-recovery components lack proven references. The optimal sourcing strategy usually combines global qualified components with local civil works, piping, electrical installation and service.
|
Quotation checkpoint |
Question for bidder |
Economic consequence if omitted |
|
Incoterm and named place |
Is the price EXW, FOB, CIF, DAP or DDP, and which port/site is named? |
Unbudgeted freight, insurance, duties, customs clearance and inland delivery. |
|
Battery limits |
Where do intake, outfall, raw-water pumps, post-treatment, grid connection and product-water transmission begin and end? |
Owner must procure interfaces separately; schedule and integration risk rises. |
|
Taxes and duties |
Are VAT/GST, customs, withholding tax and temporary-import charges included? |
Apparent low price can be materially understated. |
|
Installation and commissioning |
Who supplies labor, cranes, temporary power, chemicals, test water and consumables? |
Mobilization and acceptance-test costs shift to owner. |
|
Performance guarantees |
Are capacity, product quality, SEC, recovery, availability and chemical use guaranteed at defined feedwater conditions? |
No enforceable basis for lifecycle economics or damages. |
|
Long-term spares and service |
What is included for start-up, two-year operation and major overhauls? |
High expedited-freight cost and prolonged outage after failures. |
8. Competitive Logic and Technology Direction
8.1 Competition Is Moving Beyond Membrane Price
The value proposition of a desalination supplier increasingly rests on integrated lifecycle performance. Membrane price is visible, but high-pressure pumping, energy recovery, pretreatment design, automation, availability, corrosion management and service response determine the operating outcome. A bidder that reduces plant SEC by 0.2 kWh/m³ or raises annual availability by one percentage point may create more value than a larger discount on membrane elements.
8.2 Where Low Price Still Dominates
- Standardized small RO skids for hotels, construction camps, ships and industrial utilities where product specification and feedwater are stable.
- Export markets in which the buyer or local EPC contractor retains intake, civil works, installation, controls integration and long-term maintenance.
- Industrial projects with short asset lives or limited financing requirements, provided reliability and product-water risks remain manageable.
8.3 Where Bankability and Lifecycle Value Dominate
- Municipal IWP/PPP projects with 20–30 year water-purchase agreements and lender technical due diligence.
- Plants exposed to algal blooms, high turbidity, oil contamination, warm high-salinity seawater or strict marine environmental constraints.
- Remote islands, mines and industrial facilities where a failed pump, membrane train or control system creates severe water-security or production losses.
- Projects with stringent SEC, availability, product-water quality and chemical-consumption guarantees backed by liquidated damages.
8.4 Technology Direction
|
Development |
Cost impact |
Commercial maturity / caution |
|
Higher-efficiency isobaric energy recovery |
Reduces high-pressure energy requirement and improves LCOW. |
Mature in modern SWRO; verify efficiency across operating range and maintenance strategy. |
|
Improved membranes and lower-pressure operation |
Incremental SEC reduction and/or higher productivity. |
Improvements are meaningful but bounded by thermodynamics; validate long-term fouling behavior. |
|
Advanced pretreatment and online monitoring |
Can reduce cleaning, downtime and membrane damage. |
Economics depend on feedwater risk; avoid over-complexity where conventional treatment is sufficient. |
|
Renewable electricity and flexible operation |
Can reduce energy cost and carbon intensity; may improve grid value. |
Intermittency, ramping, water storage and contract structure must be integrated. |
|
Digital twins, predictive maintenance and AI |
Potential reduction in chemical use, energy drift and unplanned outages. |
Benefits depend on sensor quality, data governance, cybersecurity and operator capability. |
|
Brine concentration and ZLD |
Reduces liquid discharge and may recover resources. |
Energy-intensive and generally high cost for seawater; use only where regulation, water recovery or resource value supports it. |
9. Procurement Recommendations
9.1 Minimum Technical and Commercial Comparison Sheet
|
Evaluation item |
Minimum bidder disclosure |
Reason |
|
Design feedwater envelope |
Temperature, salinity, turbidity, SDI, TOC, boron, algae, oil risk and seasonal extremes. |
Guarantees are meaningless without an agreed feedwater boundary. |
|
Product-water requirements |
Flow, TDS, boron, pH, hardness, alkalinity, disinfectant and blending assumptions. |
Determines pass configuration, post-treatment and chemical cost. |
|
Guaranteed SEC |
Plant boundary, auxiliaries included, reference conditions and degradation allowance. |
Prevents selective reporting of RO-block energy only. |
|
Recovery and flux |
Design and guaranteed values by season and train. |
High values may reduce CAPEX but increase fouling, pressure and chemical risk. |
|
Availability and redundancy |
Train philosophy, standby equipment, planned maintenance and excluded outages. |
Drives annual water output and capital recovery per delivered m³. |
|
Membrane and consumables plan |
Make/model, warranty, expected replacement, cartridge use and cleaning assumptions. |
Controls recurring cost and supply-chain exposure. |
|
Chemicals |
Annual consumption guarantees and product specifications. |
Local chemical price and logistics materially affect OPEX. |
|
Materials of construction |
Duplex/stainless grades, coatings, FRP standards and corrosion allowance. |
Incorrect material selection creates catastrophic lifecycle cost. |
|
Marine and civil boundary |
Intake/outfall, geotechnical basis, tunnelling, diffusers and temporary works. |
Largest source of scope gaps and change orders. |
|
Testing and damages |
Performance-test procedure, correction curves, LD caps and retest rights. |
Creates enforceable economic protection. |
|
Service and spares |
Response time, local engineers, critical spares and obsolescence support. |
Reduces outage duration and expedited-logistics cost. |
|
Price adjustment |
Currency, commodity, labor, tax and interest-rate indexation. |
Clarifies who bears inflation and long-lead procurement risk. |
9.2 Recommended Bid-Normalization Formula
A practical evaluation should calculate the present value of: (1) normalized EPC and owner-scope CAPEX; (2) electricity based on guaranteed SEC and a common tariff scenario; (3) chemicals and consumables; (4) membranes, cartridge filters and major spares; (5) labor and maintenance; (6) water conveyance and grid charges; (7) environmental monitoring and brine obligations; and (8) expected cost of availability shortfalls. The result should be divided by guaranteed delivered water over the evaluation period.
9.3 Red Flags
- Energy guarantee excludes intake, pretreatment, product-water pumping or other major auxiliaries without a separate whole-plant figure.
- Bid assumes average feedwater and excludes seasonal algae, turbidity, temperature or salinity extremes that appear in the site data.
- High recovery and flux are proposed without pilot evidence, scaling assessment or membrane-cleaning assumptions.
- Critical pumps, ERDs, membranes, switchgear or analyzers have no approved alternate and no long-term spare commitment.
- FOB equipment price is compared with another bidder’s installed or turnkey price.
- Water tariff is quoted without explaining contract tenor, financing, power price, indexation, capacity payment and offtake security.
- Environmental monitoring, brine diffuser performance, sludge handling or decommissioning obligations are left undefined.
10. Price Outlook for 2026–2028
10.1 Base Case
In the base case, standardized SWRO process-train costs continue to improve modestly in real terms through better design, scale, supplier competition and operating experience. However, nominal turnkey prices remain broadly stable to moderately higher because electrical metals, local labor, marine construction, environmental mitigation and financing offset part of the technology-driven savings. The largest cost improvements come from project structuring—site selection, scale, low-cost power, competitive debt and risk allocation—rather than a dramatic decline in membrane or pump prices.
10.2 Scenario Matrix
|
Scenario |
Equipment-package direction |
Turnkey / LCOW direction |
Trigger conditions |
|
Downside cost case |
Real prices fall; nominal prices flat to slightly lower. |
LCOW declines materially. |
Copper/aluminium ease, interest rates fall, stable freight, competitive EPC capacity, low-cost renewable PPA and mature coastal site. |
|
Base case |
Modest real reduction; nominal broadly stable. |
LCOW improves gradually for large bankable projects; smaller projects remain expensive. |
Incremental efficiency gains, mixed commodity prices, normal freight, stable financing and no major scope escalation. |
|
High-cost case |
Nominal equipment prices rise. |
Turnkey price and LCOW increase; project delays likely. |
Copper/electrical inflation, high interest rates, trade restrictions, local-content escalation, marine permitting delays or severe feedwater risk. |
|
Technology-led upside |
Premium equipment prices may remain firm. |
LCOW falls through lower energy, chemicals and downtime. |
Validated higher-efficiency pumps/ERDs, resilient pretreatment, digital optimization and strong availability guarantees. |
10.3 Cost Drivers to Monitor
|
Indicator |
Why it matters |
Expected influence |
|
Copper and aluminium prices |
Electrical distribution, motors, transformers, drives, cabling and switchgear. |
Upside risk to nominal package prices in 2026. |
|
Interest rates and sovereign spreads |
Capital recovery is often the largest single water-cost component. |
Potentially larger LCOW impact than a small equipment discount. |
|
Renewable PPA prices |
Energy can represent one-third to two-thirds of production cost depending on boundary. |
Low-cost long-term power supports tariff compression. |
|
Marine permitting and cumulative-impact rules |
Drive intake/outfall design, monitoring and schedule. |
Could raise CAPEX and extend development periods in sensitive coasts. |
|
Membrane and ERD performance |
Affects SEC, replacement, downtime and chemical use. |
Incremental LCOW improvement rather than a step-change price collapse. |
|
Local-content and trade policy |
Changes supplier selection, fabrication location, duties and qualification cost. |
May raise initial price while improving local service and resilience. |
|
Water conveyance distance and lift |
Plant-side tariff does not equal delivered-water cost. |
Can erase savings from a lower desalination tariff. |
Conclusion
Seawater desalination has moved from a thermal, energy-intensive infrastructure niche toward a highly competitive membrane-based industry. The strongest evidence is not a universal equipment-price curve but a combination of lower water-production tariffs, reduced specific energy consumption, larger standardized plants and the dominance of SWRO in new capacity. Modern utility-scale projects can achieve water tariffs near or below US$0.50/m³ under favorable conditions, but these values depend on scale, site, financing, electricity, offtake and risk allocation.
For procurement, the most important conclusion is that process-equipment price is not synonymous with delivered-water cost. The desalination system may represent roughly one-third of total CAPEX, while electricity, capital recovery, marine works, pretreatment, financing and availability shape lifecycle economics. Buyers should therefore compare quotations on a normalized LCOW basis, with identical feedwater envelopes, battery limits, energy boundaries, financing assumptions, utilization and warranty conditions.
Through 2026–2028, continued standardization and engineering improvement should restrain real process-package costs, but nominal turnkey costs are unlikely to fall uniformly. Copper and aluminium volatility, financing, local content, coastal permitting, brine management and water conveyance will remain major sources of price dispersion. Suppliers most likely to benefit are those able to combine energy-efficient equipment with resilient pretreatment, transparent performance guarantees, bankable references, local service and long-term lifecycle support.