1. Executive summary
Solar photovoltaics has moved from a high-growth renewable niche into the central technology of global power-sector expansion. By the end of 2025, global installed solar PV capacity reached about 2.38 TW, after a record net addition of roughly 510 GW during the year. That means the industry added more PV capacity in 2025 than the world had installed in total less than a decade earlier.
The market is no longer defined only by module cost declines. In the next phase, the binding constraints are grid connection, storage integration, land and permitting, power-price cannibalization, trade rules, and the financial health of the manufacturing supply chain. Solar modules are abundant and cheap; bankable grid capacity, flexible demand, and storage-backed revenue models are now scarcer and more valuable.
For English-speaking markets, the picture is mixed but strategically important. The United States remains the largest English-language solar market by scale, yet policy uncertainty, trade enforcement and interconnection queues are shaping project timing. Australia has become a global laboratory for rooftop solar, distributed batteries and flexible demand. The United Kingdom has re-accelerated from a smaller base, with rooftop deployment and utility-scale projects competing for grid access. Canada remains comparatively underpenetrated, but rising electrification, provincial clean-power procurement and storage development create a longer-cycle opportunity.
- Core thesis: solar PV is transitioning from a manufacturing-led cost story to a grid-and-flexibility-led infrastructure story.
- Market leader: China is the dominant installation and manufacturing market, with more than 1.2 TW of PV capacity by end-2025.
- English-market opportunity: the United States, Australia and the United Kingdom are not merely demand markets; they are test beds for solar-plus-storage, grid services, retail energy models and local-content strategies.
- Risk: low module prices improve project economics but compress manufacturer margins, creating consolidation pressure and trade disputes.
- Strategic winners: firms that combine high-efficiency modules, storage, power electronics, grid engineering, O&M and financing will have stronger resilience than companies selling stand-alone commodity panels.
2. Global market size and growth pattern
Global installed PV capacity expanded from about 293 GW in 2016 to 2,383 GW in 2025, implying a compound annual growth rate of roughly 26.2%. The 2025 net addition of 510 GW was about 11.5% higher than the already-large 2024 addition. The key message is not only that solar is growing, but that it is now growing at power-system scale.
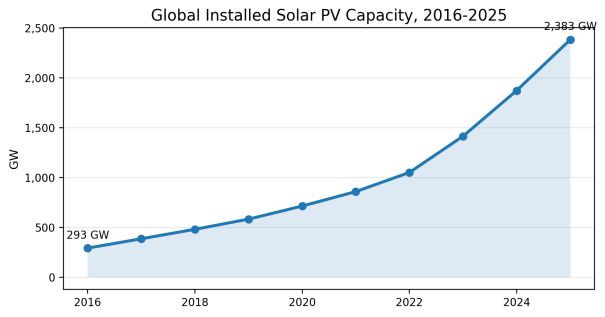
Figure 1. Global installed solar PV capacity, 2016-2025
Source: IRENA, Renewable Capacity Statistics 2026. Capacity is reported as net installed capacity connected at year-end.
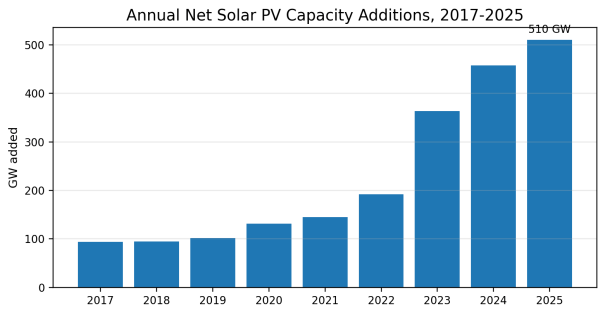
Figure 2. Annual net solar PV capacity additions, 2017-2025
Source: IRENA, Renewable Capacity Statistics 2026; Wedoany/author calculations from annual capacity series.
Solar PV accounted for nearly three-quarters of new renewable power capacity additions in 2025. This matters because PV has become the fastest scalable way to add electricity capacity in many markets. Its modularity allows deployment from kilowatt-scale rooftops to gigawatt-scale solar parks; its cost curve is supported by manufacturing scale; and its construction time is usually shorter than conventional thermal or large hydro projects.
3. Demand, economics and power-market role
The strongest driver of PV demand is no longer subsidy alone. It is a combination of low delivered electricity cost, energy security, corporate decarbonization, electrification of transport and industry, data-center demand, and the need for fast capacity additions. IRENA estimated the global weighted average levelized cost of electricity for utility-scale solar PV at about USD 0.043/kWh in 2024. In the United States, Lazard’s 2025 benchmark placed utility-scale solar in a broad USD 38-78/MWh range, which overlaps with or undercuts new gas generation in many cases, before considering fuel-price risk.
In generation terms, solar is now visible in the global electricity mix rather than marginal. Ember estimated that solar generation rose from 2,143 TWh in 2024 to 2,778 TWh in 2025, an increase of about 30%. Solar reached approximately 8.7% of global electricity generation in 2025, close to nuclear and wind on a share basis. The operational challenge is that solar output is concentrated in daylight hours, making storage, demand response and transmission expansion essential to capture the full value of new capacity.
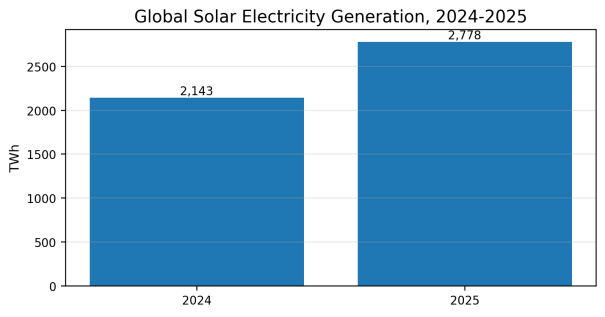
Figure 3. Global solar electricity generation, 2024-2025
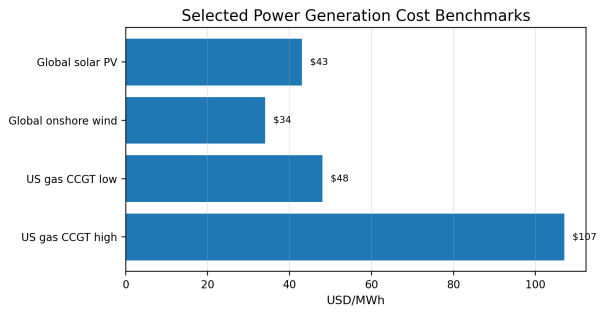
Figure 4. Selected power generation cost benchmarks
Source: IRENA Renewable Power Generation Costs in 2024; Lazard LCOE+ 2025 for US gas combined-cycle range. Scope and geography differ; chart is directional, not a like-for-like procurement quote.
4. Supply chain, technology and price cycle
The PV supply chain is in a structural oversupply phase. Public industry data indicate that global module manufacturing capacity moved well above annual installation demand, while China retained the largest share of polysilicon, wafer, cell and module capacity. This oversupply has pushed module prices down, benefiting project developers but weakening balance sheets for manufacturers, especially those with older PERC capacity or weaker channels.
Technology competition is also changing. TOPCon has become the mainstream high-efficiency route for new crystalline silicon cell capacity, while heterojunction, back-contact and tandem-perovskite approaches are being pursued for higher efficiency and product differentiation. For utility projects, the business case increasingly depends on bifacial modules, trackers, high-voltage inverters, battery energy storage systems, grid-code compliance and long-term O&M quality rather than module price alone.
|
Supply-chain factor |
Market signal |
Implication |
|
Module oversupply |
Manufacturing capacity exceeds annual installations |
Lower prices support demand but pressure producer margins and accelerate consolidation. |
|
High-efficiency cells |
TOPCon mainstreaming; HJT/BC/tandem R&D continues |
Efficiency and reliability become key for space-constrained and high-labor-cost markets. |
|
Trade and localization |
US, EU and India use tariffs, domestic-content incentives or procurement rules |
Buyers need traceability, bankability and local compliance, not only lowest FOB price. |
|
Storage integration |
Higher solar penetration causes midday price pressure and curtailment |
Solar-plus-storage, hybrid PPAs and grid services become central to returns. |
5. Regional landscape
Asia held about 64.1% of global installed PV capacity in 2025. China alone accounted for roughly 50.4% of the world total, with about 1.2 TW installed by year-end. The European market remained the second-largest regional bloc, while North America, South America and Oceania continued to expand from lower bases. Africa still represented less than 1% of global PV capacity in the IRENA dataset, which highlights both infrastructure constraints and long-run growth potential.
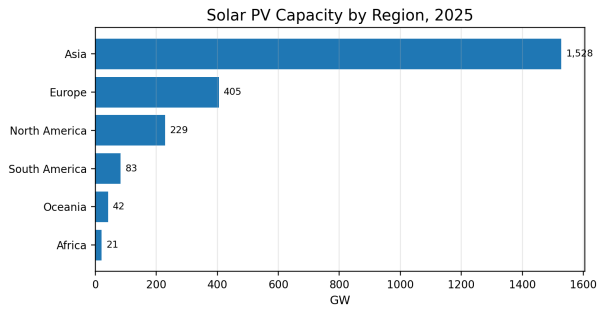
Figure 5. Solar PV capacity by region, 2025
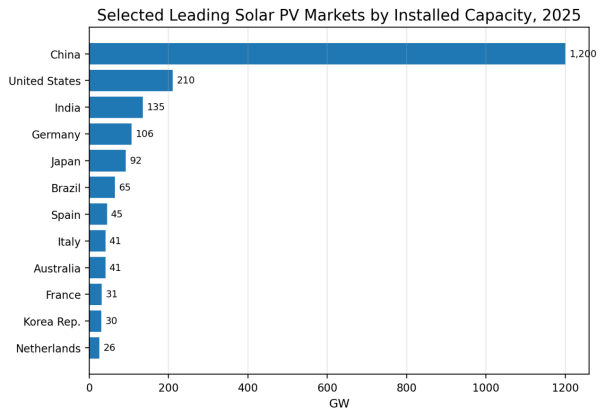
Figure 6. Selected leading PV markets by installed capacity, 2025
Source: IRENA, Renewable Capacity Statistics 2026. Chart includes selected leading countries/markets for comparison.
China remains the single most important demand market and manufacturing base. The EU added around 70 GW of solar PV in 2025, led by Germany and Spain. India accelerated strongly, with IRENA reporting 135 GW installed by end-2025 and IEA highlighting almost 50 GW of solar additions in 2025. Brazil has become a major distributed and utility-scale market in Latin America. The global pattern is therefore not a simple “developed versus emerging market” split: solar is expanding where policy, grids, capital availability and retail electricity economics align.
6. English-speaking markets: status and outlook
The major English-speaking PV markets represented roughly 282 GW of IRENA-reported installed PV capacity in 2025, or about 11.8% of the global total. Their strategic weight is larger than their capacity share because they influence project finance, technical standards, storage business models, corporate power procurement, trade policy and English-language industrial media narratives.
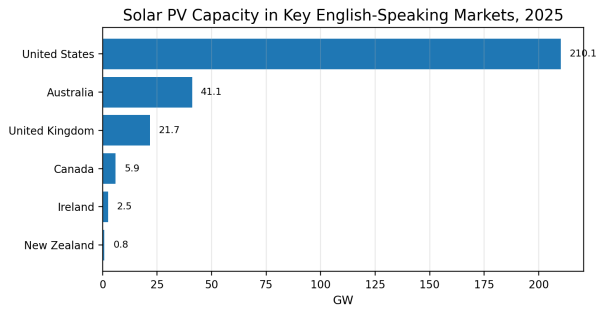
Figure 7. Solar PV capacity in key English-speaking markets, 2025
6.1 United States
The United States installed 43.2 GWdc of solar in 2025, down 14% from 2024, but solar still represented 54% of new US electricity-generating capacity. The US industry ended 2025 with about 279 GWdc installed in SEIA/Wood Mackenzie’s market dataset, while IRENA’s AC/grid-connected series reports 210 GW. The difference illustrates the importance of capacity definitions, but both sources confirm that the United States is the largest English-language PV market by far.
The near-term US outlook is defined by a conflict between strong demand and policy friction. EIA reported that developers planned 43.4 GW of utility-scale solar additions in 2026, while SEIA highlighted that new US policy rules and tax-credit deadlines could pull projects forward before later moderation. In practical terms, the United States will remain a large market for modules, inverters, trackers, transformers, switchgear, battery systems and grid interconnection services, but buyers will increasingly require domestic-content strategy, traceable supply chains and project-finance discipline.
6.2 United Kingdom
The UK solar market is smaller than the United States and Australia, but it re-accelerated in 2025. IEA-PVPS reported 21.6 GW of installed solar across about 1.918 million installations by December 2025, up 13.6% year on year. The UK market combines residential rooftop growth, commercial rooftops, ground-mounted solar farms and an emerging debate about balcony solar and local flexibility. Its largest constraint is not resource quality; it is grid connection, land planning and the value of solar output in a market with rising renewables penetration.
6.3 Australia
Australia is one of the world’s most important distributed-solar markets. APVI estimated more than 4.29 million PV installations and more than 45.1 GW of combined PV capacity by the end of 2025, while IRENA’s net connected series reports 41.1 GW. Rooftop solar generated 12.4% of Australia’s electricity in 2024, and household battery adoption is rising quickly. The market’s next phase is not simply more panels; it is orchestration of distributed energy resources, virtual power plants, dynamic tariffs, home batteries and grid-scale storage.
6.4 Canada, Ireland and New Zealand
Canada remains underdeveloped compared with its electricity demand and land resource. Hydropower dominance, provincial policy differences and colder-climate project economics have slowed adoption, but rising electrification and storage procurement could shift the market in the 2030s. Ireland and New Zealand are smaller markets, but their relevance lies in grid integration: both need flexible resources, careful siting and policy frameworks that allow solar to complement wind, hydro and storage rather than compete with them in isolation.
|
Market |
2025/Latest status |
Main constraint |
Forward view |
|
United States |
43.2 GWdc installed in 2025; solar was 54% of new US generating capacity. |
Policy volatility, trade rules, interconnection queues and transformer/grid-equipment bottlenecks. |
Still the largest English-language demand market; storage, domestic-content compliance and utility-scale procurement remain central. |
|
United Kingdom |
21.6 GW installed by Dec. 2025; about 1.918 million installations. |
Grid connection, planning, land-use debate and capture-price pressure. |
Growth likely in rooftops, commercial solar, utility projects and local flexibility. |
|
Australia |
More than 4.29 million PV installations and over 45.1 GW combined PV capacity by end-2025 in APVI data. |
Midday surplus, network hosting capacity and retail-market coordination. |
Global test bed for rooftop solar, batteries, virtual power plants and demand response. |
|
Canada |
IEA-PVPS reported 7.35 GWdc by end-2024; IRENA reports 5.93 GW connected PV by end-2025. |
Provincial policy variation, hydro-heavy grids and slower procurement cycles. |
Long-cycle upside from electrification, corporate PPAs and storage-backed clean capacity. |
7. Outlook to 2030: what changes next
IEA expects global renewable power capacity to increase by almost 4,600 GW between 2025 and 2030, with solar PV representing nearly 80% of the expansion. In round numbers, that implies about 3.7 TW of additional PV capacity over five years if the forecast mix is realized. Distributed solar is expected to contribute a large share of PV growth, but utility-scale projects will remain essential for bulk clean power and corporate procurement.
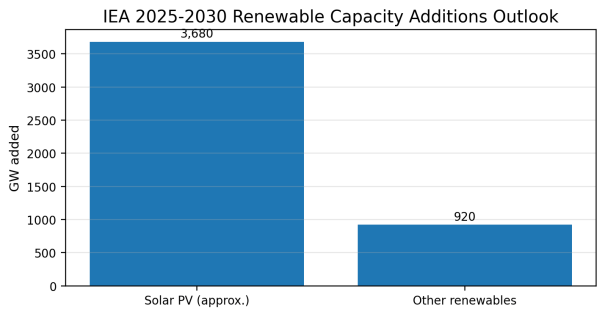
Figure 8. IEA renewable capacity additions outlook, 2025-2030
Source: IEA, Renewables 2025. Solar PV value is an approximate calculation from IEA’s “nearly 80%” share of almost 4,600 GW renewable additions.
The next five years will not be a straight-line volume story. Markets with high solar penetration will face curtailment and low midday prices unless they add batteries, transmission, flexible industrial demand and market designs that pay for capacity and flexibility. Markets with low penetration will still need basic policy stability, bankable PPAs, grid connection procedures and local construction capacity. Therefore, the global PV opportunity is broad, but the profit pool will shift from modules alone toward integrated systems and services.
|
2026-2030 trend |
Why it matters |
Likely winners |
|
Solar-plus-storage becomes normal |
Higher PV penetration reduces standalone capture prices. |
Battery integrators, PCS/inverter makers, project optimizers and O&M providers. |
|
Grid equipment bottlenecks persist |
Transformers, switchgear and interconnection studies delay projects. |
Grid-equipment manufacturers, EPC firms and digital grid-service providers. |
|
Local-content and traceability rules expand |
Governments seek domestic jobs and supply-chain security. |
Bankable manufacturers with transparent procurement, compliance and local partnerships. |
|
Distributed energy orchestration grows |
Rooftop PV becomes a grid resource only when aggregated and controllable. |
Retailers, VPP platforms, battery suppliers and smart-meter/data firms. |
|
Manufacturer consolidation accelerates |
Oversupply and price pressure reduce profitability. |
Scaled, efficient, financially strong players with differentiated technology. |
8. Strategic implications
For industrial suppliers, the PV market should be read as a broader electrical-infrastructure market. Modules remain important, but demand is spilling into inverters, battery energy storage, transformers, switchgear, cables, mounting structures, tracking systems, SCADA, weather analytics, cleaning robots, fire safety, recycling and O&M services.
For developers and investors, the value of a solar project increasingly depends on where and when it injects electricity into the grid. A cheap module does not guarantee a profitable project if the site is behind a weak grid, has long curtailment exposure, or lacks a bankable route to market. The strongest assets will combine good resource, grid access, storage optionality, credible offtakers and robust equipment warranties.