Executive Summary
Market rebound driven by AI, 5G, and broadband expansion. The global optical fiber cable market entered 2025 at an inflection point. After a trough in 2023-2024 driven by shrinking telecom capex in China and inventory destocking across the supply chain, demand has rebounded sharply, fueled by three structural forces: the accelerating buildout of AI data centers, a new wave of 5G-Advanced and submarine cable projects, and government-backed broadband expansion programs in North America and Europe. According to reconciled estimates from CRU, Grand View Research, Persistence Market Research, and industry research institutes, the global fiber optic cable market reached approximately USD 22.6 billion in 2025 and is projected to grow at a compound annual growth rate (CAGR) of 7-10% through 2030, reaching USD 37-44 billion depending on statistical scope.
The competitive landscape remains highly concentrated. The top ten manufacturers, spanning five countries, collectively control roughly 92% of global market share. Corning (US) leads at 19%, followed by a Chinese cluster — YOFC (13%), ZTT (11.3%), Hengtong (11.2%), and FiberHome (9.8%) — that together accounts for 45.3% of global supply. Japan's Furukawa, Sumitomo, and Fujikura hold a combined 13%, while Italy's Prysmian and India's Sterlite round out the top ten. Supply chain tightness has emerged as the defining constraint: optical fiber preform prices surged 180-550% in 2025, and the shortage is expected to persist through 2027, creating both margin pressure for cable makers and strategic openings for vertically integrated players.
Regionally, Asia Pacific commands 49% of global demand, with China alone consuming 54% of the region's volume. North America is the fastest-growing major market at 15.9% year-over-year in 2025, propelled by the USD 42.45 billion BEAD broadband program and hyperscale data center investment. Europe is recovering modestly at 2.3% growth, driven by FTTH rollout and submarine cable upgrades. This report analyzes the market across six dimensions: size and forecast, regional dynamics, competitive structure, demand drivers, supply chain bottlenecks, and technology trends, concluding with a strategic outlook for 2025-2030.
Contents
1. Market Size, Growth Trajectory, and Forecast
2. Regional Market Analysis
3. Competitive Landscape and Manufacturer Positioning
4. Demand Drivers and Application Segments
5. Supply Chain: The Preform Bottleneck
6. Technology Trends and Product Evolution
7. Strategic Outlook and Risk Assessment (2025-2030)
1. Market Size, Growth Trajectory, and Forecast
Statistical caliber matters. Reconciling data from multiple research firms reveals significant variance in reported market size, primarily due to differences in statistical scope. Persistence Market Research values the fiber optics market at USD 14.52 billion in 2024 (narrow definition: cables and basic components), while CRU and industry research institutes place the broader optical cable industry at USD 20-23 billion when including submarine systems, specialty cables, and installation services. PMarketing Research estimates the telecommunication fiber optic cable segment alone at USD 22.6 billion in 2025. This report adopts the broader industry definition, which is more representative of total commercial activity.
The market trajectory shows a clear V-shaped recovery. After contracting in 2023 due to Chinese telecom operators slashing fixed network investment and global inventory destocking, demand rebounded in late 2024 and accelerated through 2025. CRU reports global fiber optic cable demand grew 4.1% year-over-year in 2025, with the data center segment surging 75.9%. The forecast period 2025-2030 implies a CAGR ranging from 6.5% (conservative, IIM) to 10.0% (PMarketing), reflecting uncertainty about the pace of AI infrastructure investment and the timing of 5G-Advanced rollouts. The mid-point consensus of approximately 8% CAGR places the 2030 market at USD 37-42 billion.
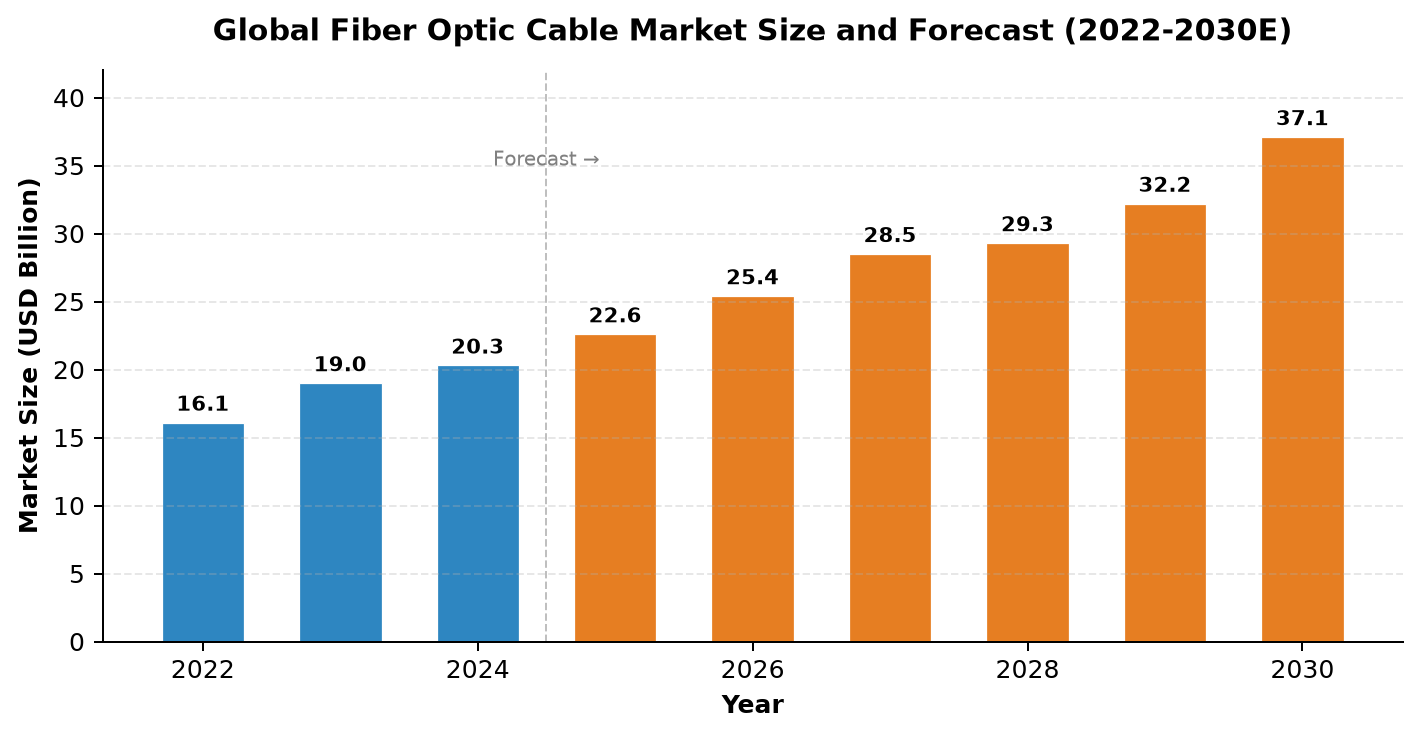
Figure 1. Global fiber optic cable market size and forecast, 2022-2030E. Sources: PMarketing Research, CRU, Persistence Market Research, IIM. Figures reconciled from multiple sources; 2025-2030 are forecast estimates (E).
Table 1 below compares market size estimates from five research organizations. The divergence underscores the importance of understanding each firm's definition: some count only finished cables, others include preforms and fiber, and the broadest definitions encompass installation and submarine systems.
|
Research Firm |
Market Scope |
2024 Size (USD B) |
2030E Size (USD B) |
CAGR |
|
Persistence Market Research |
Fiber optics (narrow) |
14.52 |
15.8 (2032E) |
10.7% |
|
Global Newswire / MarketIntel |
Fiber optic cable |
12.04 |
36.5 (2034E) |
11.7% |
|
PMarketing Research |
Telecom fiber optic cable |
20.3 |
37.1 |
10.0% |
|
IIM (broad) |
Optical cable industry |
21.5 |
32.0 |
6.8% |
|
DataHorizzon Research |
Fiber optics (regional sum) |
~7.8 |
~13.7 |
6.9% |
|
CRU (demand volume) |
Cable demand (fiber-km) |
534M fkm |
568M fkm (2025) |
6.2% (2025 YoY) |
Table 1. Global fiber optic cable market size estimates by research organization. Note the wide variance due to different statistical scopes. Sources: individual firm reports, 2024-2026.
2. Regional Market Analysis
Asia Pacific: scale leader, but growth shifting. Asia Pacific remains the gravitational center of the optical fiber cable market, accounting for approximately 49% of global demand in 2025. Within the region, China is both the largest consumer and producer: it consumed 375,000 tons of optical fiber cables in 2024 (54% of Asia-Pacific volume) and produced 750,000 tons (76% of regional output). However, China's demand growth has decelerated to 2.3% in 2025 as FTTH penetration approaches saturation and 5G wide-area coverage nears completion. The growth baton has passed to India and Southeast Asia, where India alone accounts for over 25% of Asia-Pacific demand (excl. China) and posted 21% year-over-year procurement growth in 2025.
North America is the standout growth market. CRU projects 15.9% demand growth in 2025, driven by three forces: the USD 42.45 billion Broadband Equity, Access, and Deployment (BEAD) program, which targets fiber deployment to underserved communities; hyperscale data center expansion by Amazon, Google, Microsoft, and Meta; and 5G network densification requiring fiber backhaul. The United States alone accounts for over 88% of North American demand. FTTP adoption, however, remains surprisingly low at 24.5% of premises as of mid-2024, versus 90.9% in Iceland, indicating substantial headroom for future fiber deployment.
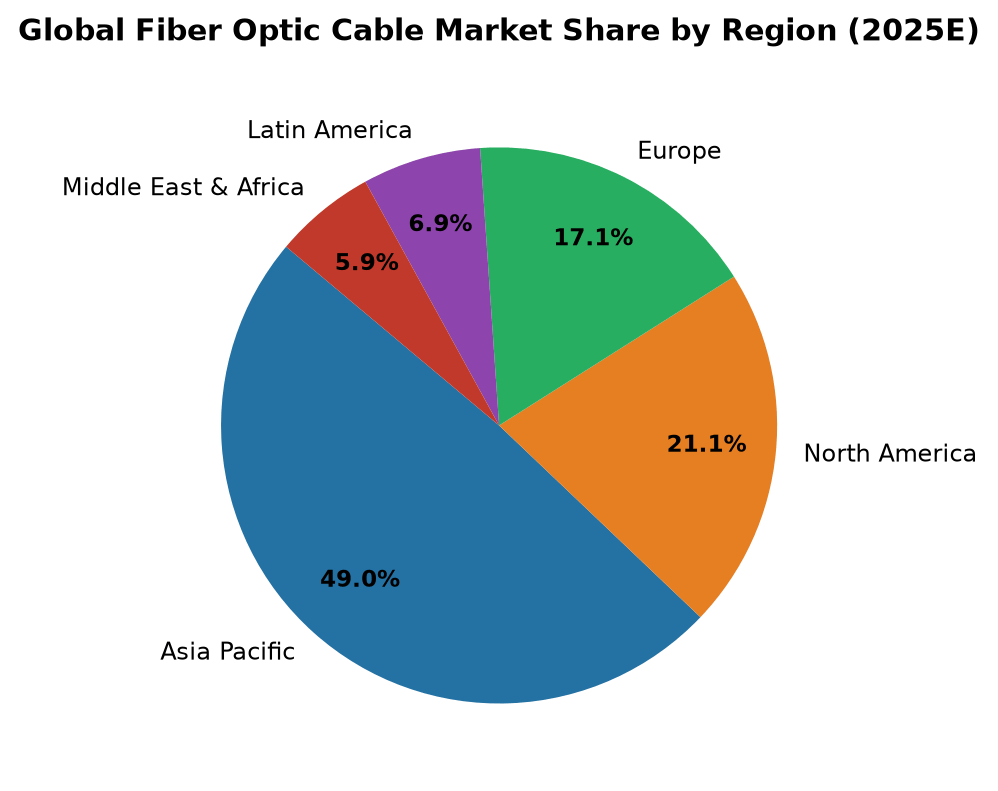
Figure 2. Global fiber optic cable market share by region, 2025E. Source: PMarketing Research, CRU regional breakdown, 2025.
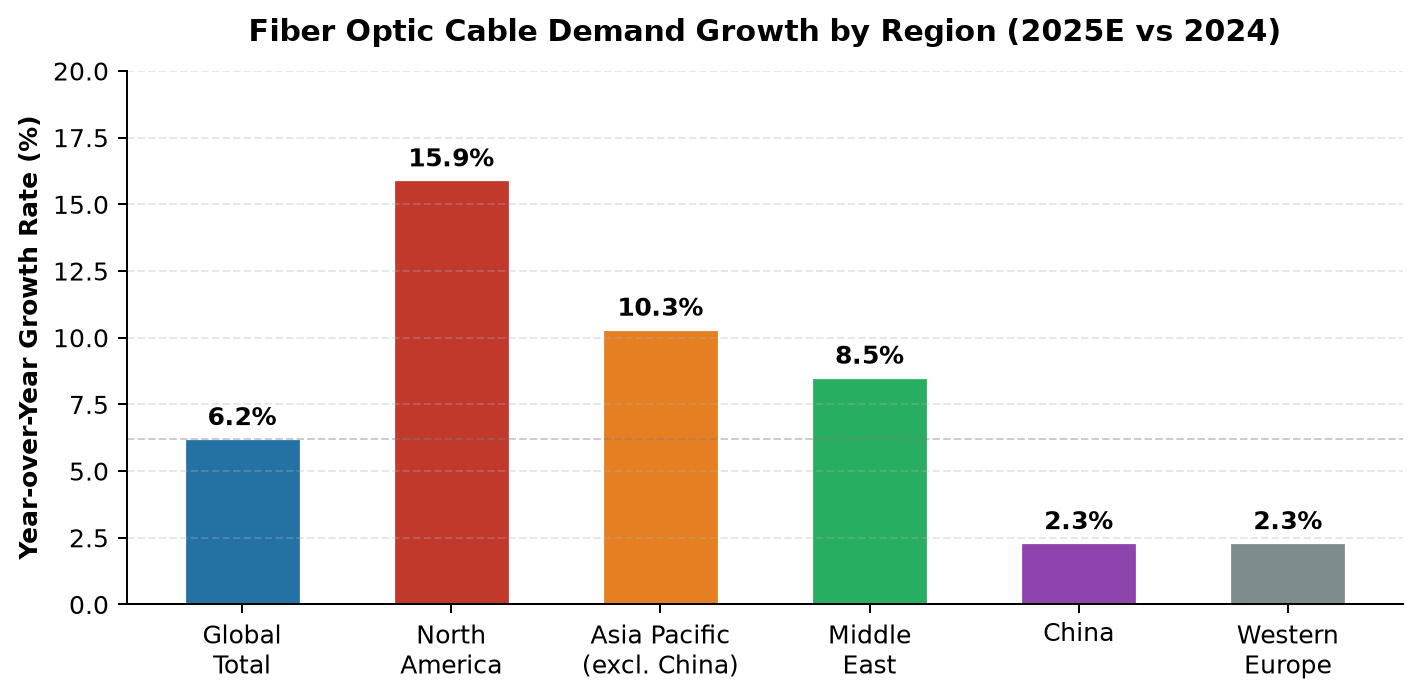
Figure 3. Year-over-year demand growth by region, 2025E vs 2024. Source: CRU World Fiber Optic Cable Conference, 2024.
Europe's market is characterized by moderate but steady recovery. Total demand reached approximately 67.5 million fiber-kilometers in 2024, with a slight contraction of 0.7% before rebounding to 2.3% growth in 2025. The region's demand is bifurcated: Western Europe is focused on replacing legacy copper networks and upgrading submarine cable infrastructure, while Eastern Europe posted 2% growth driven by greenfield FTTH projects. Germany's fiber cable industry alone is projected to reach USD 2.48 billion by 2034. Submarine cable manufacturing is a European strength, with Alcatel Submarine Networks (ASN) holding roughly 33% of the global submarine cable manufacturing share.
Table 2 summarizes the regional market picture, combining demand volume, growth rates, and key drivers.
|
Region |
2025 Market Size (USD B) |
Share (%) |
2025 YoY Growth |
Key Demand Drivers |
|
Asia Pacific |
11.08 |
49.0% |
+6.2% |
5G-A rollout, India broadband, data centers |
|
North America |
4.76 |
21.1% |
+15.9% |
BEAD program, AI data centers, 5G backhaul |
|
Europe |
3.86 |
17.1% |
+2.3% |
Copper-to-fiber migration, submarine upgrades |
|
Latin America |
1.55 |
6.9% |
+8.0% |
Broadband expansion, mobile backhaul |
|
Middle East & Africa |
1.35 |
5.9% |
+8.5% |
Smart city projects, national broadband plans |
Table 2. Regional fiber optic cable market breakdown, 2025E. Sources: PMarketing Research, CRU, IndexBox, 2025. Growth rates from CRU analyst presentations.
3. Competitive Landscape and Manufacturer Positioning
Concentration is extreme. The global fiber optic cable industry is one of the most concentrated segments in industrial manufacturing. According to data from the Network Telecom Information Research Institute, the top ten manufacturers in 2024 collectively held approximately 92% of global market share. These companies are distributed across five countries, reflecting a tripartite structure dominated by the United States, China, and Japan, with Italy and India playing supporting roles.
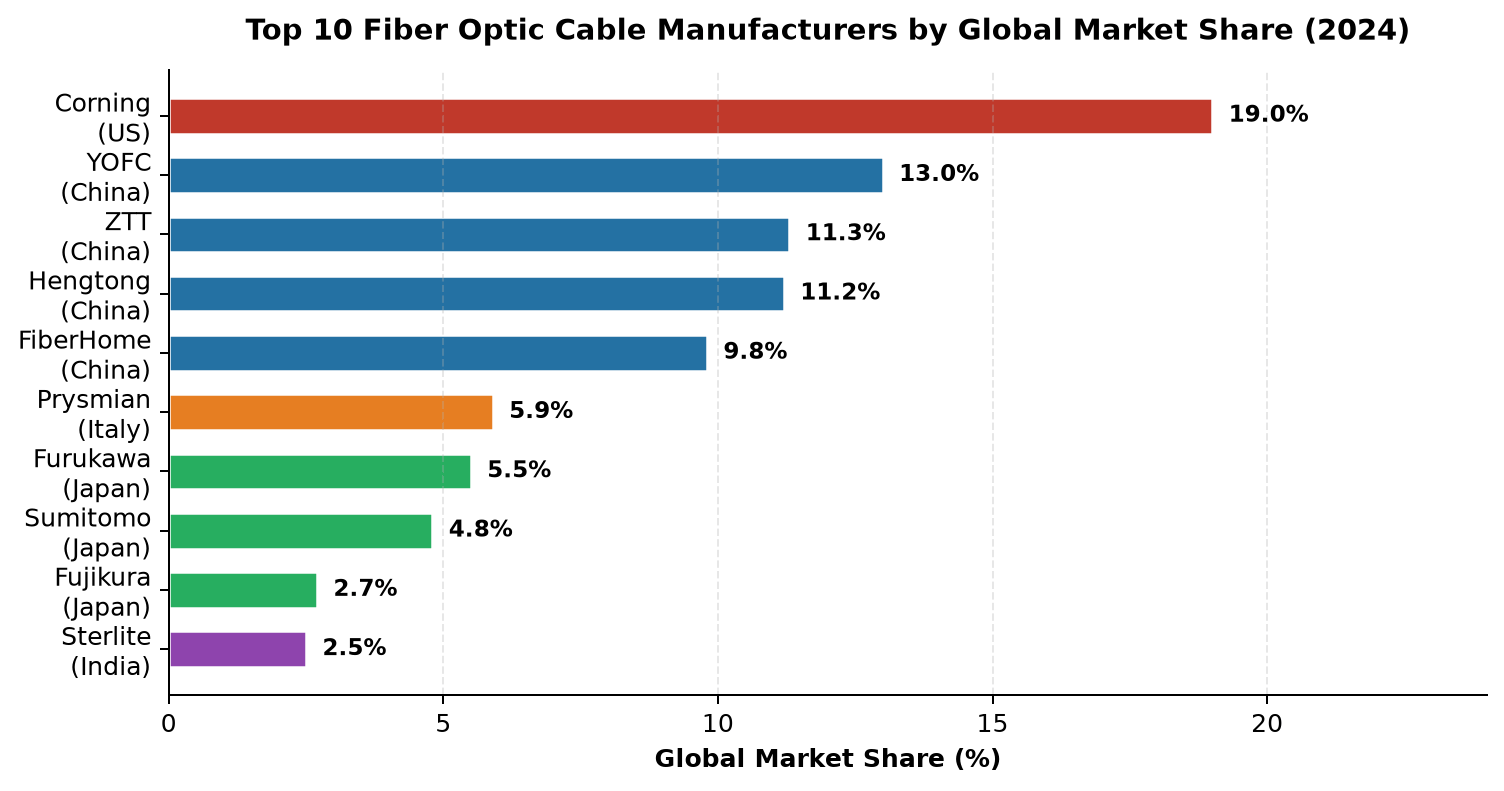
Figure 4. Top 10 fiber optic cable manufacturers by global market share, 2024. Source: Network Telecom Information Research Institute, 2024-2025.
Corning Incorporated maintains its position as the global market leader with a 19% share, anchored by its invention of the first low-loss optical fiber in 1970 and sustained R&D investment. The company's optical communications division generated USD 4.657 billion in revenue in 2024, up 16% year-over-year, and its global fiber deployment surpassed 5 billion kilometers. Corning's 2024 agreement with AT&T, valued at approximately USD 1 billion, and its 2025 announcement of an additional USD 500 million investment in AI data center fiber products, signal a clear strategic pivot toward high-margin data center applications. The company operates 21 manufacturing facilities and three R&D centers in China, where it has invested over USD 9 billion cumulatively.
The Chinese cluster — YOFC, ZTT, Hengtong, and FiberHome — represents 45.3% of global market share and has achieved this position through scale manufacturing and full supply chain integration. YOFC, in particular, is the only company worldwide that has mastered all three major preform manufacturing technologies (PCVD, VAD, and OVD). Its single preform drawing length improved from 7,000 km in 2013 to 10,000 km, and its overseas revenue grew 52.8% year-over-year in the first half of 2025, with international business now accounting for over 30% of total revenue. However, profitability remains under pressure: YOFC's net income fell 47.9% in 2024 to RMB 676 million, and its net profit margin contracted to 4.16% by September 2025, reflecting the margin compression affecting the entire Chinese fiber cable sector.
Japanese manufacturers — Furukawa Electric (which owns OFS Fitel), Sumitomo Electric, and Fujikura — collectively hold approximately 13% of the global market. Their competitive positioning emphasizes specialty and high-performance fibers rather than volume. Prysmian Group (Italy, 5.9% share) leverages its broader cable systems portfolio, including power cables and submarine systems, while Sterlite (India, 2.5%) serves the rapidly growing South Asian market. CommScope and TE Connectivity, while not ranked in the top ten by fiber cable volume, are significant players in connectivity solutions and enterprise networks.
|
Rank |
Company |
Country |
2024 Share (%) |
Strategic Positioning |
|
1 |
Corning Incorporated |
United States |
19.0 |
Technology leader; AI data center focus; USD 4.66B optical revenue |
|
2 |
YOFC (Yangtze Optical Fibre) |
China |
13.0 |
Only firm mastering PCVD+VAD+OVD; 30%+ overseas revenue |
|
3 |
ZTT (Zhongtian Technology) |
China |
11.3 |
Submarine cable strength; marine engineering integration |
|
4 |
Hengtong Optic-Electric |
China |
11.2 |
Full industry chain; expanding specialty fiber portfolio |
|
5 |
FiberHome Technologies |
China |
9.8 |
R&D depth in transmission systems; defense sector presence |
|
6 |
Prysmian Group |
Italy |
5.9 |
Power + telecom cable synergy; submarine systems leader |
|
7 |
Furukawa Electric / OFS |
Japan |
~5.5 |
Specialty fibers; long-haul and submarine applications |
|
8 |
Sumitomo Electric |
Japan |
~4.8 |
High-performance fibers; diversified industrial portfolio |
|
9 |
Fujikura |
Japan |
~2.7 |
Fusion splicing leadership; specialty optical components |
|
10 |
Sterlite Technologies |
India |
2.5 |
India domestic market; expanding to Africa and Europe |
|
Top 10 Total |
~92.0 |
Highly consolidated market structure |
Table 3. Top 10 global fiber optic cable manufacturers, 2024. Source: Network Telecom Information Research Institute; company annual reports. Shares for ranks 7-9 are estimates.
4. Demand Drivers and Application Segments
AI data center construction. The single most powerful demand driver in 2025 is the global buildout of AI training and inference data centers. CRU reports that data center fiber optic cable demand surged 75.9% year-over-year in 2025, making it the primary engine of market recovery. A single AI hyperscale data center consumes 5-10 times the fiber volume of a traditional facility, driven by the need for ultra-high-density intra-facility connectivity and data-center interconnect (DCI) links. The demand for high-performance optical fibers in AI data centers — particularly bend-insensitive G.657.A2 and OM4/OM5 multimode fibers — has pushed preform prices for these grades up by as much as 550% from early 2025 levels. CRU projects that AI-driven DC fiber demand will rise from less than 5% of total volume in 2024 to double-digit share by 2027.
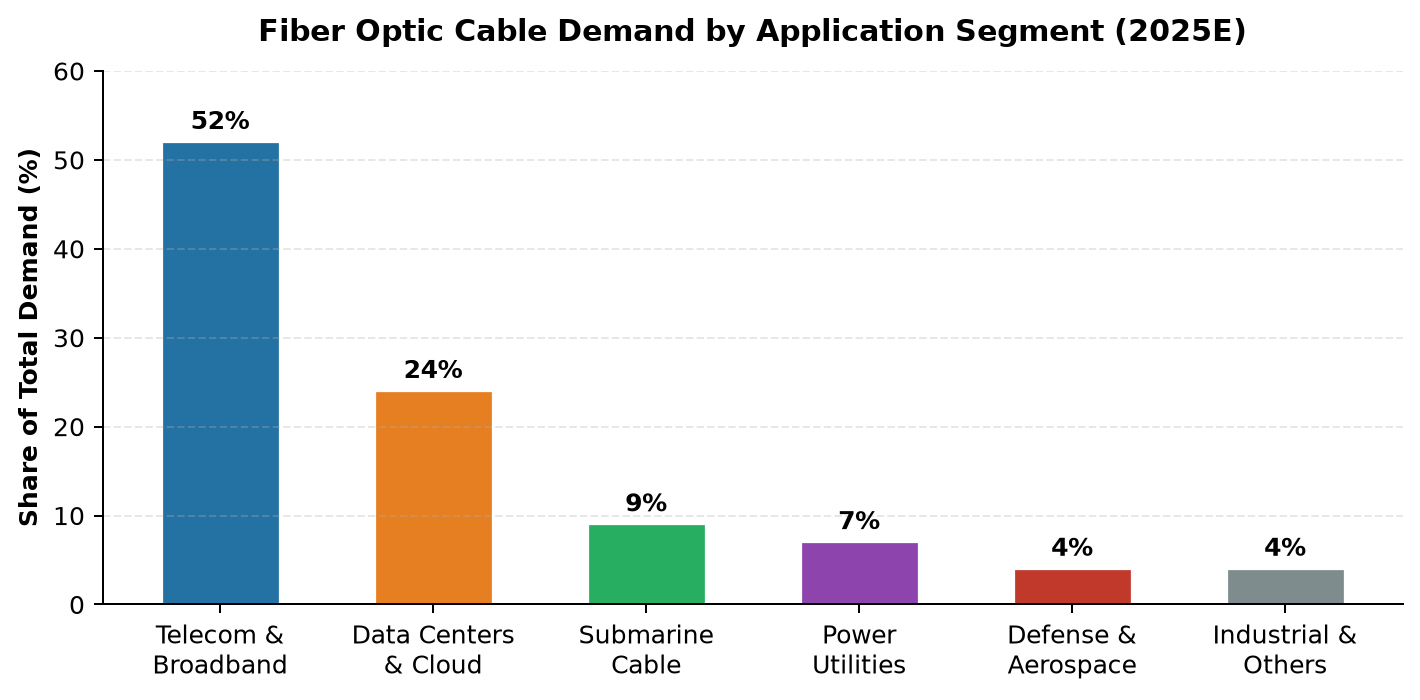
Figure 5. Fiber optic cable demand by application segment, 2025E. Sources: IIM, Data Bridge Market Research, CRU. Segment shares are estimates based on reconciled data.
5G and 5G-Advanced network deployment. The transition from 4G to 5G standalone architecture requires dense fiber backhaul, with each 5G small cell node demanding a dedicated fiber connection. By 2025, China had deployed over 6 million 5G base stations, while India's 5G rollout entered its densification phase. The cables required for 5G fronthaul and backhaul differ from traditional telecom cables: they demand higher fiber counts (up to 576 fibers per cable), smaller bend radii, and enhanced environmental resistance for aerial and duct installations. The shift to 5G-Advanced (3GPP Release 18) in 2025-2026 is expected to sustain this demand vector, particularly in Asia Pacific and the Middle East.
Government broadband expansion programs. Public policy has become a decisive demand catalyst. The United States' BEAD program allocates USD 42.45 billion for broadband equity, with fiber as the preferred technology. The Infrastructure Investment and Jobs Act commits a total of USD 65 billion to broadband expansion. In Europe, Germany's Federal Ministry of Digital and Transport launched nationwide fiber funding targeting underserved municipalities. These programs are creating multi-year demand visibility for fiber cable and optical transmission equipment suppliers. However, execution risk is real: permitting delays, right-of-way disputes, and labor shortages have slowed BEAD disbursement, and actual fiber deployment may lag funding allocation by 12-18 months.
Submarine cable systems. The submarine cable segment is experiencing its most intensive construction cycle in history. The global submarine cable market exceeded USD 200 billion in 2024 and is projected to reach USD 280 billion in 2025, with an estimated CAGR of 8-13% through 2030. Between 2026 and 2030, approximately 540,000 kilometers of new submarine cable lines are planned — a 60% increase over the 2021-2025 period. This surge is driven by hyperscaler investment (Google, Meta, Microsoft, Amazon now collectively own or lease over 50% of new submarine capacity), the need to connect emerging AI data center hubs, and the replacement of aging transoceanic systems. Submarine cable lines require specialized manufacturing capabilities — repeatered designs, armored constructions for shallow-water deployment, and ultra-low-loss fiber — creating high barriers to entry and premium pricing.
Beyond these primary drivers, several secondary demand vectors contribute to market breadth. Power utilities are deploying optical ground wire (OPGW) and all-dielectric self-supporting (ADSS) cables for smart grid communication networks. The defense sector invests in radiation-hardened and secure tactical fiber systems. Industrial automation and railway signaling applications are expanding, particularly in emerging markets. Healthcare and oil and gas sectors utilize specialty fiber optic sensing systems for distributed temperature and strain monitoring. These diverse end markets reduce the industry's dependence on any single demand cycle, though telecom and data centers remain dominant.
|
Application Segment |
2025 Share (%) |
Growth Outlook |
Key Demand Characteristics |
|
Telecom & Broadband |
52% |
Moderate (3-5% CAGR) |
High fiber count; long-haul and metro; price-sensitive |
|
Data Centers & Cloud |
24% |
Rapid (20%+ CAGR) |
High-density; OM4/OM5 multimode; bend-insensitive |
|
Submarine Cable |
9% |
Strong (8-13% CAGR) |
Ultra-low-loss; armored; repeatered; high margin |
|
Power Utilities |
7% |
Steady (5-7% CAGR) |
OPGW; ADSS; smart grid; long service life |
|
Defense & Aerospace |
4% |
Stable (4-6% CAGR) |
Radiation-hardened; secure; specialty specifications |
|
Industrial & Others |
4% |
Growing (6-8% CAGR) |
Sensing; railway; medical; harsh environment |
Table 4. Fiber optic cable demand by application segment, 2025E. Sources: IIM, Data Bridge Market Research, CRU. Growth outlook is author's assessment based on multiple sources.
5. Supply Chain: The Preform Bottleneck
A three-tier chain with a single bottleneck. The optical fiber cable supply chain operates in three tiers: preform manufacturing (the highest-value, most technologically complex step), fiber drawing, and cabling. Preform — the cylindrical high-purity quartz glass rod from which fiber is drawn — accounts for approximately 70% of the value chain's profit, yet its production line construction cycle is long (18-24 months) and capacity cannot be rapidly expanded. In 2025, this structural rigidity collided with surging AI-driven demand, creating the most severe preform shortage in a decade.
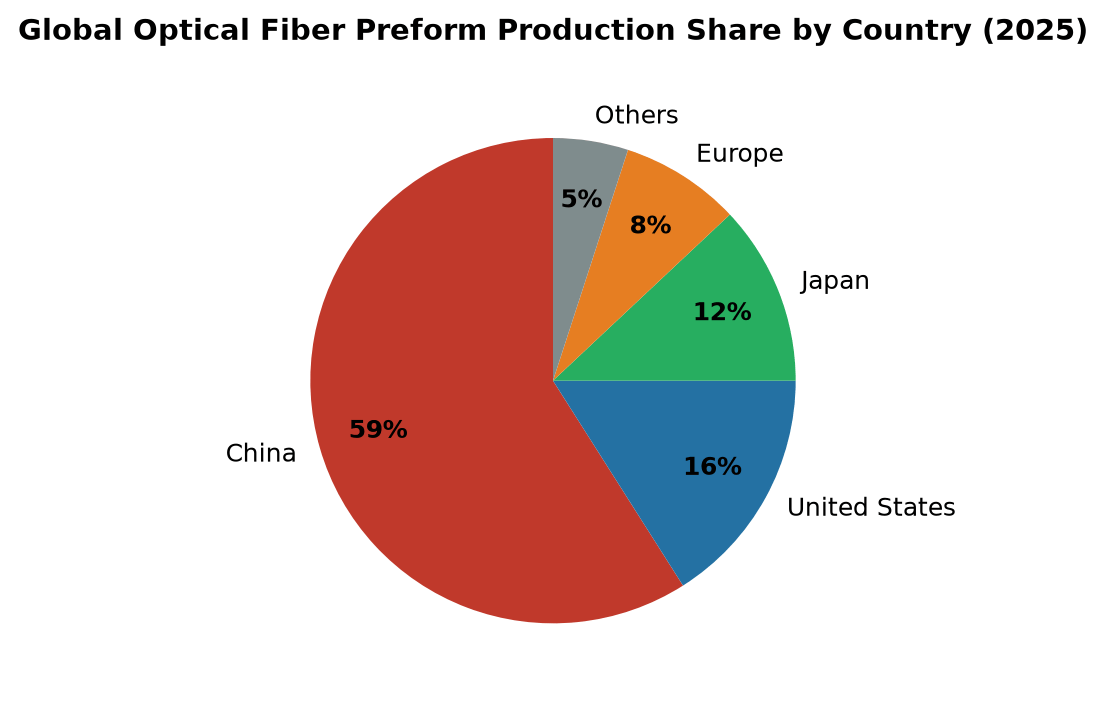
Figure 6. Global optical fiber preform production share by country, 2025. Source: Huatai Securities research report, 2025; company capacity reports.
China dominates preform production with a 59% global share, followed by the United States (16%, primarily Corning), Japan (12%, Furukawa, Sumitomo, Fujikura), and Europe (8%, Prysmian and Heraeus). In terms of finished fiber and cable, China accounts for 57% and 47% of global output, respectively. This concentration means that supply disruptions in China — whether from energy rationing, environmental inspections, or trade policy — have outsized global consequences.
Price impact has been dramatic. According to Shanghai Securities News, generic G.652D preform prices rose over 180% from early 2025 levels, while G.657.A2 preform — the grade used in data center high-density cabling — surged approximately 550%, from RMB 22-30 per equivalent fiber-kilometer to RMB 160. Multiple listed companies have confirmed that this price increase reflects genuine supply-demand imbalance rather than speculative hoarding, and they expect tightness to persist through 2027. The impact extends beyond standard telecommunications: specialty applications such as fiber optic sensors used in oil well monitoring and structural health monitoring also face extended lead times, as they compete for the same preform production capacity.
Capacity is maxed out. All major preform producers are operating at full capacity. Corning's preform plants reached maximum utilization in 2025, and the company has announced new capacity investments. YOFC, Hengtong, ZTT, and FiberHome have limited spare capacity, with utilization rates above 90%. The supply response is underway — YOFC expanded its Hubei preform facility in 2024, Corning announced USD 500 million in additional investment, and Hengtong is scaling specialty preform projects — but the lag between investment and output means the bottleneck will not ease materially before late 2026 or 2027.
|
Supply Chain Tier |
Value Share (%) |
Key Players |
Barrier to Entry |
|
Preform Manufacturing |
~70% |
Corning, YOFC, Sumitomo, Prysmian, Heraeus |
Very High (18-24 mo build; proprietary deposition tech) |
|
Fiber Drawing |
~20% |
Same as above + second-tier Chinese firms |
High (capital-intensive; technology license) |
|
Cabling |
~10% |
Hundreds of regional players; lower concentration |
Moderate (equipment standard; labor-intensive) |
|
Connectivity & Accessories |
Variable |
CommScope, Amphenol, TE Connectivity, Fujikura |
Moderate-High (precision tooling; qualification) |
Table 5. Optical fiber cable supply chain structure and value distribution. Source: Industry value chain analysis; company financial reports. Value shares are approximate.
6. Technology Trends and Product Evolution
Ultra-low-loss fiber for long-haul networks. The ITU-T G.654.E standard, defining ultra-low-attenuation (below 0.17 dB/km) and large effective area fiber, has become the preferred choice for new long-haul terrestrial and submarine routes. By 2025, G.654.E fiber achieved approximately 25% penetration in long-haul backbone networks, commanding a price premium of 2.3x over standard G.652.D fiber. The deployment of 400G and 800G coherent transmission systems — which require lower-loss fiber to maintain signal integrity over extended reach — is the primary driver. As fiber connectors and splicing techniques evolve to handle these larger-core fibers, the ecosystem is gradually shifting toward a new performance standard.
Multi-core fiber and SDM: beyond the Shannon limit. Multi-core fiber and space division multiplexing (SDM). With single-mode fiber approaching the nonlinear Shannon limit, multi-core fiber (MCF) — which multiplexes signals across multiple physical cores within a single cladding — has moved from laboratory demonstration to field trials. NTT and others have demonstrated transmission exceeding 1.6 Pbit/s over a single MCF strand. While commercial deployment remains limited to data center interconnect trials, the technology represents the most credible path to overcoming the capacity ceiling of conventional single-core fiber. CRU projects that multi-core and SDM fiber shipments grew over 25% year-over-year in 2025, albeit from a very small base.
Hollow-core fiber: the next frontier. Hollow-core fiber (HCF) represents a potentially disruptive leap. By guiding light through an air-filled core rather than solid glass, HCF achieves lower latency (approximately 30% faster than silica fiber), lower attenuation (theoretical limit below 0.1 dB/km), and higher damage threshold for high-power laser applications. YOFC has established multiple world-leading test networks for hollow-core fiber transmission, collaborating with domestic and international operators. While HCF is unlikely to displace conventional fiber in volume applications before 2028-2030, its trajectory bears monitoring for its implications in latency-sensitive financial trading, high-performance computing, and defense communications.
Cable design evolution: denser, smaller, tougher. On the cabling side, demand is shifting toward higher fiber density and smaller cable diameters. Ribbon cables, microduct cables, and high-fiber-count loose tube designs (up to 1,728 fibers or more) are gaining share in urban environments where duct space is constrained. Armored and ADSS cable designs remain dominant in aerial and harsh-environment deployments. For submarine applications, the industry is moving toward higher-pair-count cables and repeater designs that support multi-terabit-per-second capacity per fiber pair, with single-system design capacity now exceeding 1,000 Tbps.
|
Technology |
Current Status (2025) |
Key Advantage |
Commercial Timeline |
|
G.654.E Ultra-Low-Loss |
25% penetration in long-haul |
40% efficiency improvement vs G.652.D |
Mainstream now |
|
Multi-Core Fiber (MCF) |
Field trials; DCI applications |
Capacity beyond Shannon limit |
2026-2028 commercial |
|
Hollow-Core Fiber (HCF) |
Test networks; operator trials |
30% lower latency; 0.1 dB/km target |
2028-2030 niche |
|
Bend-Insensitive G.657.A2 |
High demand in data centers |
10mm bend radius; high-density |
Mainstream now |
|
576+ Fiber Count Cables |
Growing in metro/urban |
Maximizes duct utilization |
Mainstream now |
Table 6. Optical fiber cable technology roadmap, 2025. Sources: ITU-T standards, company announcements, CRU technology analysis.
7. Strategic Outlook and Risk Assessment (2025-2030)
A different cycle. The optical fiber cable market is entering a multi-year growth cycle that differs structurally from the 2015-2020 4G/FTTH boom. Three characteristics define the new cycle: first, demand is more diversified across application segments, reducing dependence on telecom operator capex cycles; second, the supply chain is tighter, with preform capacity as the binding constraint rather than fiber drawing or cabling; third, technology differentiation is accelerating, with ultra-low-loss, multi-core, and eventually hollow-core fiber creating premium segments that reward R&D investment.
For manufacturers, the strategic priorities are clear. Vertically integrated players with preform capacity — Corning, YOFC, Hengtong, Sumitomo — will capture disproportionate value, as they can allocate scarce preform output to the highest-margin applications. Companies lacking preform capability face margin compression and supply risk. International diversification is no longer optional: YOFC's 52.8% overseas revenue growth in H1 2025 demonstrates that demand growth has shifted from China to North America, India, and Southeast Asia, and manufacturing presence in these markets reduces logistics costs and trade barrier exposure.
Several risks warrant monitoring. The preform shortage, while beneficial for integrated producers in the short term, risks demand destruction if cable prices rise to levels that delay broadband projects. Trade policy is a second risk: U.S. tariffs on Chinese fiber and cable products, EU anti-dumping measures, and India's Make-in-India procurement rules all create market fragmentation. Technology disruption is a third: if hollow-core fiber commercializes faster than expected, it could render portions of the installed conventional fiber base economically obsolete, though this risk is unlikely to materialize before 2028.
The investment community should watch three indicators as leading signals: preform price trends (a proxy for supply-demand balance), hyperscale data center capex announcements (a proxy for AI-driven demand), and government broadband program execution rates (a proxy for policy-driven demand). The convergence of these indicators suggests that the current growth cycle has at least 3-5 years of runway, with the 2025-2027 period representing the tightest supply conditions and the most favorable pricing environment for integrated manufacturers.
|
Risk Factor |
Probability |
Impact |
Mitigation Strategy |
|
Preform shortage extends beyond 2027 |
Medium-High |
High (demand destruction) |
Accelerate capacity investment; long-term supply contracts |
|
Trade barriers restrict market access |
Medium |
Medium (regional fragmentation) |
Localize production; diversify manufacturing footprint |
|
AI capex slowdown in 2026-2027 |
Low-Medium |
High (demand deceleration) |
Diversify into submarine, utilities, defense segments |
|
Hollow-core fiber faster commercialization |
Low |
Medium (cannibalization risk) |
Invest in HCF R&D; position across technologies |
|
Broadband program execution delays |
Medium |
Medium (deferred demand, not lost) |
Focus on private network and enterprise segments |
Table 7. Key risk factors and mitigation strategies for the optical fiber cable market, 2025-2030. Author's assessment based on industry data and company disclosures.
Data Sources and Methodology
This report synthesizes data from the following sources, cross-referenced for consistency:
CRU Group — World Fiber Optic Cable Conference analyst presentations (2024); global demand volume and regional growth data
Persistence Market Research — Fiber Optics Market report (2024-2032); market size and CAGR estimates
PMarketing Research — Worldwide Telecommunication Fiber Optic Cable Market (2025-2032); regional market size breakdown
Network Telecom Information Research Institute — Global fiber optic cable manufacturer market share rankings (2024)
IIM (Industry Information Institute) — Global optical cable industry research reports (2026 editions); market size and segment analysis
DataHorizzon Research — Global Fiber Optics Market report (2025-2033); regional market size data
Data Bridge Market Research — Global Fiber Optic Cable Market report; application segment and cable type analysis
IndexBox — Asia-Pacific Optical Fiber Cables Market Overview (2024); production and consumption volume data
Company annual reports and investor presentations — Corning, YOFC, Hengtong, ZTT, FiberHome, Prysmian (2024-2025)
Shanghai Securities News (STCN) — Optical fiber preform price reporting (June 2026)
Huatai Securities — China preform/fiber/cable production global share research (2025)
U.S. Federal Communications Commission — Broadband deployment statistics; BEAD program documentation
C114 Communication Network — CRU analyst interviews and market commentary (2024-2025)
Methodology note: Where source data diverged significantly, the report presents range estimates or median values and notes the statistical caliber differences. All forecast figures are labeled with 'E' (estimated) and include the forecast period. Market size figures use the broader optical cable industry definition unless otherwise noted.
Disclaimer: This report is prepared for informational purposes based on publicly available data. Market size, growth rates, and company market shares reflect estimates from multiple research organizations and may differ due to differing statistical scopes and methodologies. Readers should consult primary sources for investment decisions.
Related Products

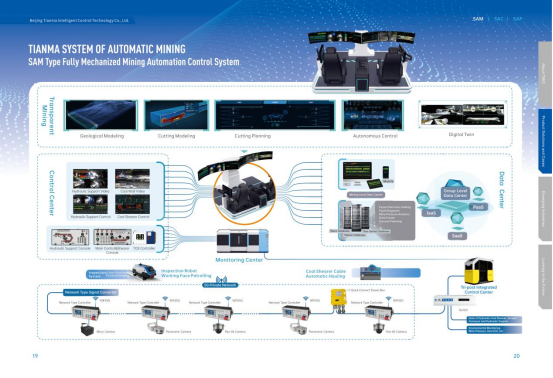
Comprehensive Mining Automation Control System
Beijing Tianma Intelligent Control Technology Co., Ltd.
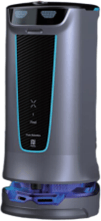
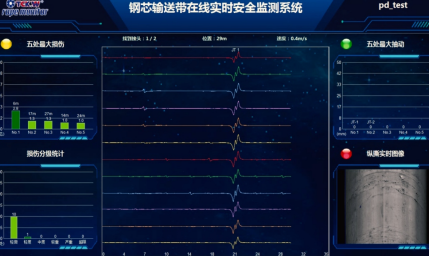
Conveyor Belt Intelligent Monitoring System
LUO YANG WIRE ROPE INSPECTION TECHNOLOGY CO., LTD.
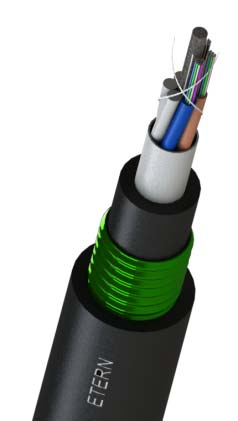
GYTA Type Non-Self-Supporting Aerial/Duct Optical Cable
TONGDING INTERCONNECTION INFORMATION CO., LTD.