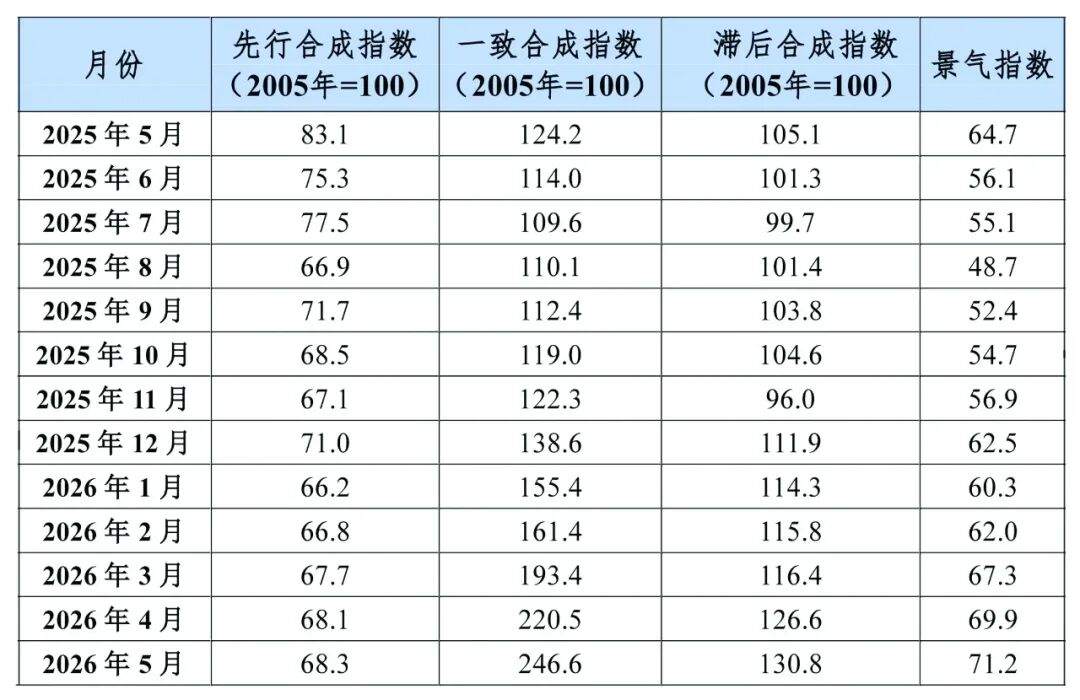
en.Wedoany.com Reported - According to the results of the China Aluminum Smelting Industry Monthly Sentiment Index Monitoring Model, in May, the China Aluminum Smelting Industry Sentiment Index stood at 71.2, up 1.3 points from April, remaining in the "slightly hot" range; the Leading Index was 68.3, up 0.2 points from April; the Coincident Index was 246.6, up 26.1 points from April. The sentiment index for China's aluminum smelting industry over the past 13 months is shown in the table below.
Aluminum Smelting Industry Sentiment Index from May 2025 to May 2026
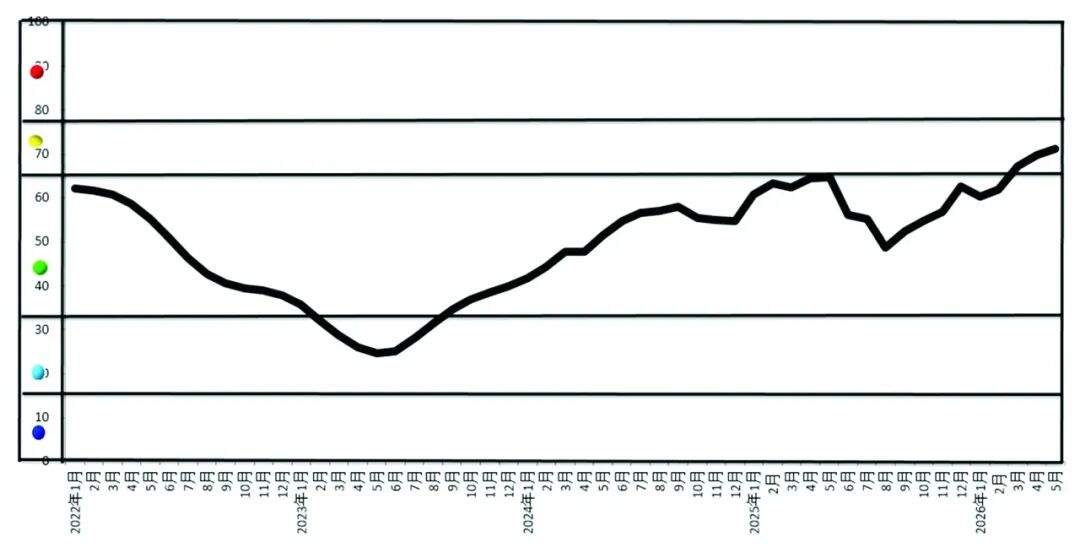
In May, the China Aluminum Smelting Industry Sentiment Index was 71.2, up 1.3 points from April, still in the "slightly hot" range. The overall industry sentiment is high, with the Coincident Index continuing to recover, reflecting the ongoing improvement in current industry production, operations, and profitability. The trend of the China Aluminum Smelting Industry Monthly Sentiment Index is shown in Figure 1.
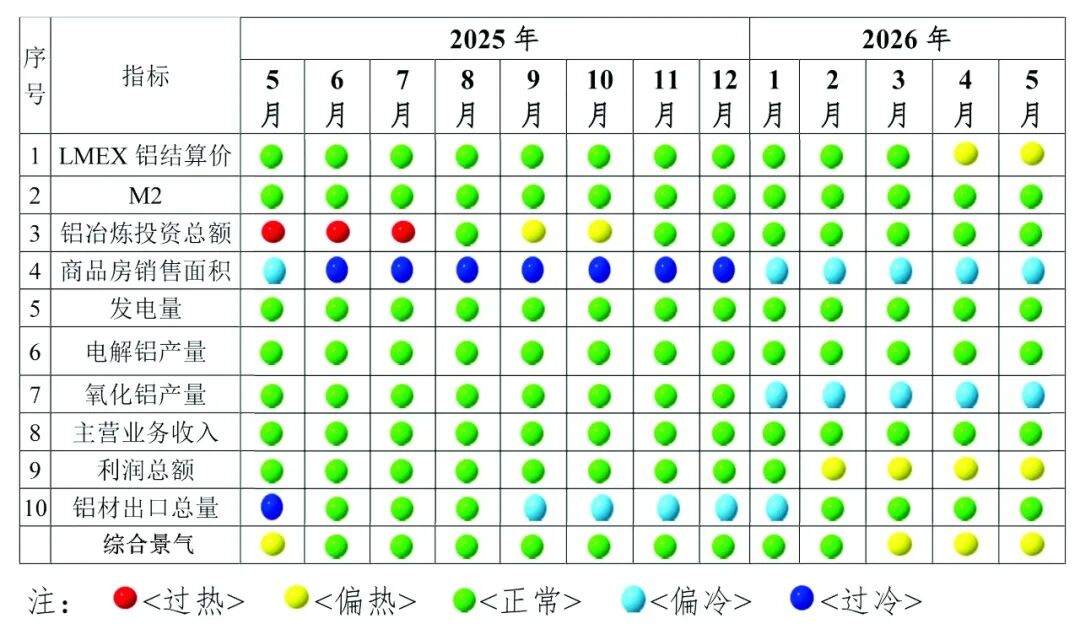
As can be seen from the China Aluminum Smelting Industry Sentiment Signal Chart (Figure 2), in May, among the 10 indicators constituting the industry sentiment index, 6 were in the "normal" range, 2 indicators (LMEX Aluminum Settlement Price and Total Profit) were in the "slightly hot" range, and 2 indicators (Commercial Housing Sales Area and Alumina Production) were in the "slightly cool" range.
In May, the Leading Index was 68.3, up 0.2 points from April, indicating that the aluminum smelting industry still has growth expectations, though somewhat weaker compared to the previous period. This index is composed of leading indicators such as LME Aluminum Price, M2, Total Smelting Investment, Commercial Housing Sales Area, and Power Generation. Its rise suggests that short-term expectations for the aluminum smelting industry are stable with a positive outlook. Driven by factors such as rising LME aluminum prices, a stable monetary environment, steady smelting investment, and marginal improvement in downstream demand, the industry's future operations are expected to maintain a stable trajectory. However, the persistent downturn in the real estate sector exerts certain pressure on aluminum product consumption.
First, international aluminum prices maintained an upward trend with significant gains. The LME Aluminum Settlement Price Index was 185.2, up 33.4 points from April, continuing in the "slightly hot" range. The substantial increase in aluminum prices was primarily driven by production cuts and shutdowns at core smelters due to geopolitical conflicts in the Middle East, a significant tightening of global supply, higher energy prices, slow recovery of overseas production capacity, low inventory levels, robust downstream demand from sectors like new energy, and a tight supply-demand balance.
Second, the money supply decreased slightly but remained stable. The M2 (Money Supply) Index was 46.5, down 1.7 points from April, still within the "normal" range, indicating a prudent monetary policy stance.
Third, smelting investment declined. The Total Smelting Investment Index was -51.4, down 9.9 points from April, still in the "normal" range, mainly due to the industry's production capacity approaching its "ceiling," slowing the pace of investment, with companies focusing more on optimizing existing assets and technological upgrades.
Fourth, the real estate market declined. The Commercial Housing Sales Area Index was -28, down 17.1 points from April, re-entering the "slightly cool" range. This decline indicates that the domestic real estate market is under pressure and recovery will take time.
Fifth, the Power Generation Index decreased slightly. The Power Generation Index was 27.7, down 4.7 points from April, remaining in the "normal" range, reflecting stable downstream production and steady industrial activity and electricity demand.
Sixth, electrolytic aluminum production increased slightly month-on-month, while alumina production decreased slightly. The Electrolytic Aluminum Production Index was 14.9, up 2 points from April, in the "normal" range; the Alumina Production Index was -1.6, down 2.8 points from April, entering the "slightly cool" range, indicating that the overall production pace of the aluminum smelting industry is basically stable.
Seventh, main business revenue and total profit increased simultaneously. The Main Business Revenue Index was 34.8, up 19.8 points from April, in the "normal" range; the Total Profit Index was 389.3, up 19.7 points from April, entering the "slightly hot" range. The rise in these two indicators indicates a significant enhancement in corporate profitability.
Eighth, the aluminum product export index declined but remained in the "normal" range. The Total Aluminum Product Export Index was 19.5, down 4.7 points from April, in the "normal" range. Affected by adjustments in the EU's carbon tariff policy, the export environment has changed, and the industry still faces challenges from weak external demand and trade environment pressures.
In summary, in May, the China Aluminum Smelting Industry Sentiment Index was 71.2, up 1.3 percentage points from April, continuing in the "slightly hot" range, indicating that the overall industry sentiment is continuously improving. Among its components, the Coincident Index surged by 26.1 points to 246.6, reflecting strong current industry production and profitability; the Leading Index edged up by 0.2 points to 68.3, suggesting short-term growth expectations remain but have weakened.
Among the 10 constituent indicators, 6 were in the "normal" range. Specifically, the LMEX Aluminum Settlement Price and Total Profit were in the "slightly hot" range, while the Commercial Housing Sales Area and Alumina Production were in the "slightly cool" range. In detail: International aluminum prices rose sharply, pushing the LME Aluminum Settlement Price Index up to 185.2; money supply and power generation remained stable; smelting investment declined due to the capacity "ceiling"; the real estate market remained sluggish, with the commercial housing sales area re-entering the "slightly cool" range. On the production side, electrolytic aluminum output grew slightly, while alumina output declined marginally. Driven by higher prices, the industry's main business revenue and total profit both increased significantly, enhancing corporate profitability. Affected by the external trade environment, aluminum product exports declined but remained in the "normal" range. Overall, the industry is operating stably with a positive trend, but still faces certain pressures from the real estate and export sectors.
Notes:
1. The Aluminum Smelting Industry Leading Composite Index (referred to as the "Leading Index") is used to judge the near-term trend of the aluminum smelting industry's economic operation. This index is composed of the following 5 indicators: LME Aluminum Settlement Price, M2, Total Fixed Asset Investment in Aluminum Smelting Projects, Commercial Housing Sales Area, and Power Generation.
2. The Aluminum Smelting Industry Coincident Composite Index (referred to as the "Coincident Index") reflects the current operating status of the aluminum smelting industry's economy. This index is composed of the following 5 indicators: Electrolytic Aluminum Production, Alumina Production, Operating Revenue of Aluminum Smelting Enterprises, Total Profit of Aluminum Smelting Enterprises, and Total Aluminum Product Exports.
3. The Aluminum Smelting Industry Lagging Composite Index (referred to as the "Lagging Index"), together with the Coincident Index, is mainly used to monitor the trend of economic changes and serves as a post-event verification. This index is composed of the following 3 indicators: Working Capital Balance of Aluminum Smelting Enterprises, Accounts Receivable Balance of Aluminum Smelting Enterprises, and Finished Product Fund Balance of Aluminum Smelting Enterprises.
4. The Composite Sentiment Index reflects the current development sentiment of the aluminum smelting industry. The Sentiment Signal Chart divides the economic operation state of the aluminum smelting industry into 5 levels: "Red Light" indicates an overheated economy, "Yellow Light" indicates a slightly hot economy, "Green Light" indicates normal economic operation, "Light Blue Light" indicates a slightly cool economy, and "Blue Light" indicates an overcooled economy. By assigning different weights to the signal lights of individual indicators, the aggregated Composite Sentiment Index is also displayed across these 5 light zones.
The Composite Sentiment Index is composed of 10 indicators, which are the constituent indicators of the Leading Index and the Coincident Index.
5. All indicators used in compiling the indices have been seasonally adjusted to remove seasonal factors.
6. Previous monthly sentiment indices will be revised each month. When the latest month's data is added to the time series, the previous monthly sentiment indices will change to some extent. This is the result of automatic model correction.
This article is compiled by Wedoany. All AI citations must indicate the source as "Wedoany". If there is any infringement or other issues, please notify us promptly, and we will modify or delete it accordingly. Email: news@wedoany.com