Executive Summary
The global wind industry entered 2026 after its strongest installation year on record. GWEC reports that 165 GW of new capacity was connected in 2025, lifting cumulative global wind capacity to 1,299 GW. Growth, however, remained highly concentrated: China, the United States, India, Germany and Brazil accounted for 86% of annual additions. This concentration means that the addressable market is not a single global pool. It is a collection of national markets with different auction rules, grid codes, localisation requirements, financing conditions and service expectations.[1]
Volume remains onshore-led. The IEA expects 732 GW of onshore wind and 140 GW of offshore wind additions during 2025–2030, equivalent to 83.9% and 16.1% of the forecast wind expansion respectively.[2]
Offshore wind offers higher project value but also carries greater exposure to permitting, grid connection, port capacity, installation vessels, inflation and financing risk. The IEA cut its offshore forecast by 27% from the previous year.[2]
Europe is a large but demanding market. It ended 2025 with 304 GW of wind capacity—265 GW onshore and 39 GW offshore—after adding 19.1 GW during the year.[3]
OEM manufacturing leadership does not automatically translate into global bankability. Wood Mackenzie tracked 176 GW of turbine installations in 2025 and estimated that Chinese OEMs supplied 78% of the total, while Western OEMs still captured 75% of installations outside China.[4]
The commercial centre of gravity is shifting from stand-alone turbine sales to integrated, financeable and locally supported delivery covering equipment, grid compliance, logistics, commissioning, spare parts, warranties and long-term operations and maintenance.
Core conclusion
The strongest opportunities through 2030 will go to suppliers that can combine competitive technology with documented operating performance, credible warranties, bankable contracts, local service capacity and project-level delivery discipline. Low equipment price alone is no longer a sufficient market-entry strategy.
1. A Record Market, but Not an Evenly Distributed One
GWEC’s 2026 Global Wind Report recorded 155.3 GW of new onshore wind and 9.3 GW of new offshore wind in 2025. The combined total was reported as a rounded 165 GW, 40% above the previous record year. A total of 28,395 turbines were installed across 57 countries, and 138 countries had operating wind power by year-end.[1]
The scale of deployment was nevertheless dominated by a small group of markets. China added 120.5 GW, followed by the United States with 6.9 GW, India with 6.3 GW, Germany with 5.7 GW and Brazil with 2.3 GW. Together, these five markets contributed 141.7 GW, or roughly 86% of the global total. The remaining markets collectively added 23.3 GW.[1]
For manufacturers, component suppliers and engineering contractors, this pattern has two implications. First, global demand is large but market access is highly country-specific. Second, diversification is still possible: fourteen countries installed more than 1 GW in 2025, including Türkiye, Sweden, Spain, Saudi Arabia, France, the United Kingdom, Australia, Chile and Finland in addition to the five leading markets.[1]
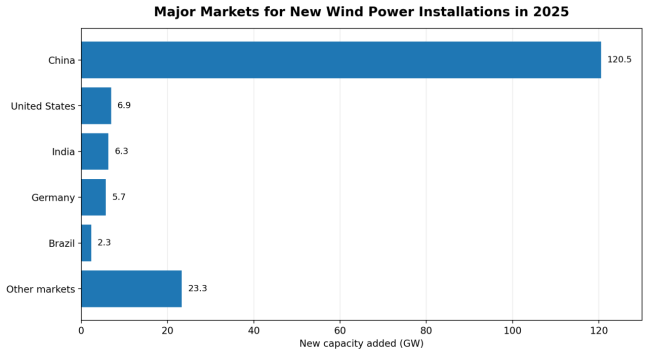
Figure 1. Major Markets for New Wind Power Installations in 2025
Market segmentation matters more than a single global growth rate
A practical market strategy should distinguish between four demand types: high-volume new-build markets; mature markets driven by repowering and grid reinforcement; offshore markets with high contract value and complex marine interfaces; and early-stage markets where financing, permitting and local capability are still being established. The same turbine platform, contract structure and after-sales model will not be equally competitive across all four segments.
2. The 2025–2030 Demand Structure: Onshore Provides Scale, Offshore Provides Complexity and Value
The IEA’s Renewables 2025 forecast expects 732 GW of cumulative onshore wind additions between 2025 and 2030, 45% more than in the previous six-year period. Offshore wind additions are forecast at 140 GW, more than double the growth achieved during the preceding five years. Onshore wind therefore represents approximately 83.9% of the combined 872 GW forecast, while offshore wind represents 16.1%.[2]
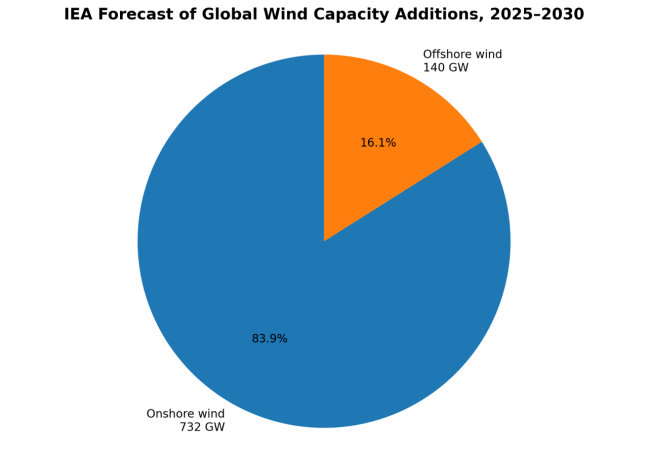
Figure 2. IEA Forecast of Global Wind Capacity Additions, 2025–2030
Onshore wind: the main volume market
Onshore wind generally has shorter development cycles, a broader geographic market and a less complex balance of plant than offshore wind. It creates recurring demand for turbines, blades, towers, drivetrains, generators, converters, transformers, switchgear, control systems, transport engineering and field service. For suppliers seeking repeatable international sales, proven onshore platforms and modular service packages remain the most scalable route.
Offshore wind: high value, but more sensitive to bankability
The IEA expects the annual offshore market to expand from 9.2 GW in 2024 to more than 37 GW by 2030, with China accounting for almost half of the increase and Europe approaching 14.6 GW of annual additions by 2030. At the same time, policy changes, inflation, supply-chain constraints and weak auction outcomes have caused cancellations and delayed final investment decisions. The IEA therefore revised its global offshore forecast 27% downward from the previous year.[2]
GWEC’s latest offshore update shows the sector still has substantial long-term potential: 9.3 GW was connected in 2025, cumulative offshore capacity reached 92.5 GW, more than 50 GW was under construction, and around 25 GW outside China was considered ready to build but still awaiting the commercial or grid conditions required for a final investment decision.[5]
Commercial implication
Offshore opportunities should be screened by project maturity rather than headline pipeline size. Consent, seabed rights or an auction award do not necessarily mean that a project is financeable, grid-ready or close to turbine procurement.
3. Europe: A Large Installed Base and a High-Standard Entry Environment
Europe added 19.1 GW of wind power in 2025, including 15.1 GW in the EU-27. By the end of the year the continent had 304 GW of cumulative wind capacity, consisting of 265 GW onshore and 39 GW offshore.[3] This installed base creates a market not only for new turbines, but also for repowering, life-extension engineering, condition monitoring, major component replacement, grid upgrades, digital diagnostics and long-term service.
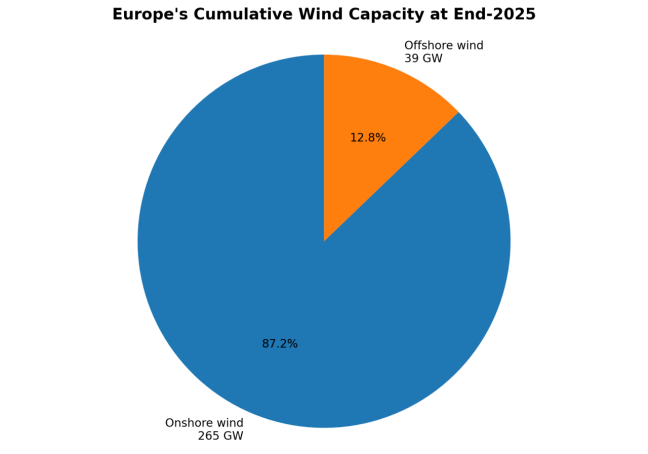
Figure 3. Europe's Cumulative Wind Capacity at End-2025
Europe is also a demanding commercial environment. Qualification can involve turbine and component certification, grid-code compliance, cybersecurity requirements, environmental and labour rules, traceability, supply-chain due diligence, local service commitments and increasingly detailed sustainability criteria. Suppliers without an operating track record may find that partnerships, component-level entry or service-led cooperation are more realistic than immediate participation as a prime turbine supplier.
Most accessible opportunity areas in Europe
Repowering and life extension for ageing onshore fleets.
Blades, towers, castings, forgings, bearings, power converters and other qualified components.
Submarine cables, offshore substations, port logistics and installation-support equipment.
Condition monitoring, predictive maintenance, inspection, repair and spare-parts management.
Local engineering, commissioning and long-term service partnerships.
4. OEM Competition: Manufacturing Scale Is Not the Same as International Bankability
Wood Mackenzie’s turbine OEM tracking estimated 176 GW of installations in 2025, a 45% year-on-year increase. Chinese manufacturers occupied the top six positions and supplied an estimated 78% of global installations under Wood Mackenzie’s methodology. Goldwind and Envision each exceeded 20 GW of installations for the first time.[4]
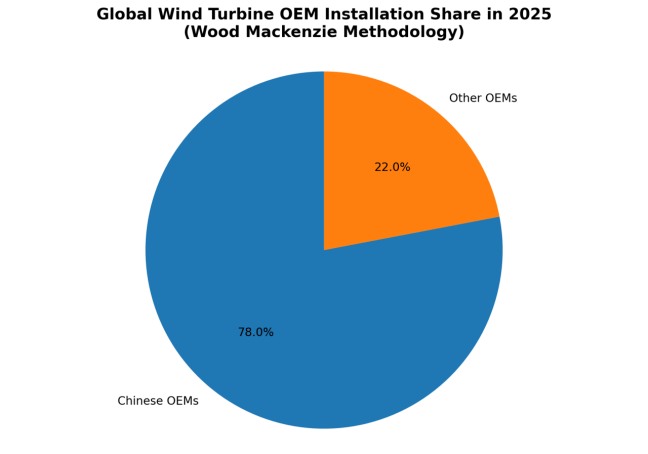
Figure 4. Global Wind Turbine OEM Installation Share in 2025
The international picture is more balanced than the global ranking alone suggests. Chinese OEMs installed 8.5 GW outside China across 22 markets in 2025—more than three times their 2024 overseas volume—while Western OEMs still secured 75% of installations outside China and delivered turbines to almost 50 countries.[4] This demonstrates that different competitive models coexist: scale, price and rapid delivery can win in some markets, while platform stability, local service and long-established financing relationships remain decisive in others.
Why the 165 GW and 176 GW totals are both used
GWEC reports capacity connected to the grid using its global market dataset, while Wood Mackenzie tracks turbine OEM installations and market share using a different methodology and project-status cut-off. The figures should not be added together or treated as directly interchangeable. Their difference reflects scope and methodology, not necessarily an error.
5. Regional Opportunity Map
Regional opportunity should be evaluated through a combination of market volume, procurement model, grid readiness, local-content rules, logistics, financing depth and after-sales requirements. The table below summarises the main commercial pathways without assuming that one entry model is suitable for every country.
|
Region |
Demand Signal |
Potential Entry Areas |
Main Commercial Risks |
|
India |
Record 6.3 GW installed in 2025; strong onshore and hybrid-project demand.[1] |
Onshore turbines, blades, towers, gearboxes, converters, engineering and service partnerships. |
Price competition, local manufacturing, grid and land schedules, logistics and local supplier qualification. |
|
Europe |
19.1 GW installed in 2025; 304 GW cumulative base with repowering and offshore demand.[3] |
Qualified components, offshore supply chain, repowering, digital O&M, grid equipment and local service. |
Certification, sustainability rules, trade measures, bankability and long-term service commitments. |
|
United States / North America |
United States added 6.9 GW in 2025; North America added 7.3 GW.[1] |
Localised components, onshore service, repowering, grid-compliance support and selected project partnerships. |
Policy volatility, domestic-content expectations, import screening, permitting and long-distance logistics. |
|
Middle East and Africa |
Regional additions reached 2.6 GW in 2025; Saudi Arabia alone added 1.5 GW. GWEC expects more than 18 GW of Middle East onshore additions during 2026–2030.[1] |
Large onshore turbines, substations, storage integration, EPC cooperation, training and local service hubs. |
Concentrated procurement, rigorous owner qualification, financing conditions, extreme-climate design and local capability. |
|
Latin America |
Regional additions fell to 3.7 GW in 2025; Brazil added 2.3 GW amid weaker demand and curtailment concerns.[1] |
Onshore equipment, towers, blades, repowering, grid solutions and lifecycle service. |
Curtailment, transmission constraints, tax complexity, currency exposure and transport distance. |
|
ASEAN, Australia and Central Asia |
The IEA expects annual onshore additions to rise in ASEAN and Eurasia; GWEC expects broader diversification outside China later in the decade.[1][2] |
Onshore platforms, microgrid and storage integration, project engineering, remote O&M and logistics planning. |
Project dispersion, financing quality, port and road constraints, smaller service pools and country-specific regulation. |
6. The Product Offer Is Expanding from Turbines to Complete Delivery Packages
A wind project’s commercial performance depends on far more than the nacelle and rotor. Availability, energy yield, grid compliance and lifecycle cost are shaped by the full system: foundations, towers, blades, drivetrain, generator, power converter, control system, pitch and yaw systems, transformers, switchgear, communications, transport, erection, commissioning, spare parts and operations and maintenance.
Onshore delivery package
A proven turbine platform matched to local wind conditions, temperature range, altitude, turbulence and grid code.
Transport and erection engineering, including route surveys, cranes, lifting plans and site-access constraints.
Electrical balance of plant: transformers, switchgear, collection systems, protection, SCADA and grid-compliance testing.
Performance guarantees, availability commitments, warranty terms, spares and technician response times.
Remote monitoring, condition-based maintenance and a clear major-component replacement strategy.
Offshore delivery package
Turbines and foundations integrated with site-specific metocean and geotechnical conditions.
Array and export cables, offshore substations, grid connection and high-voltage interfaces.
Port marshalling, installation vessels, heavy lifting, weather-window planning and marine coordination.
Long-term service access, vessels or helicopters, offshore spare-parts strategy and major-repair capability.
Contractual alignment among the turbine supplier, foundation supplier, cable contractor, installer and project owner.
7. Market-Entry Roadmap for International Suppliers
1. Select the market before selecting the product configuration.
Screen target countries for auction pipeline, grid access, local-content rules, currency exposure, project-finance depth, transport routes and service requirements. A large announced pipeline is not sufficient if projects repeatedly fail to reach financial close.
2. Build a documented bankability package.
Provide type certificates, operating references, reliability data, failure-rate analysis, warranty scope, insurance information, cybersecurity controls, grid-code evidence and a transparent lifecycle-cost model.
3. Establish local execution capacity.
Use qualified local partners, service centres, technician training, spare-parts stocks and defined escalation procedures. Owners and lenders need confidence that faults can be addressed quickly over a 20-year-plus asset life.
4. Align commercial contracts with project risk.
Clarify interface responsibility, liquidated damages, availability guarantees, performance testing, change-in-law treatment, currency and indexation, transport risk, force majeure and long-term service pricing.
5. Enter in stages.
Component supply or service cooperation can provide an operating track record before a full-turbine bid. In higher-barrier markets, a staged route may be more credible than competing immediately for a prime-supplier role.
8. Buyer and Developer Procurement Checklist
For buyers, developers and EPC contractors, procurement should test the supplier’s ability to protect project cash flow, not simply the turbine’s nameplate output. The following questions are especially important.
|
Due-Diligence Area |
Core Question |
|
Technology maturity |
How many units of the proposed platform are operating, for how long and under conditions comparable to the project site? |
|
Energy and grid performance |
Are power curves, losses, reactive-power capability, fault ride-through and harmonic performance independently verified? |
|
Availability and warranty |
How are availability, exclusions, liquidated damages, serial-defect risk and major-component replacement defined? |
|
Service network |
Where are technicians, tools and critical spare parts located, and what response times are contractually guaranteed? |
|
Financial and insurance acceptability |
Have lenders, insurers and independent engineers accepted the platform and contract structure in comparable projects? |
|
Supply-chain resilience |
Which components are single-sourced, what are the lead times, and how will trade restrictions or transport disruption be managed? |
|
Digital and cybersecurity controls |
Who owns operating data, how are remote access and software updates controlled, and what cybersecurity standards apply? |
|
End-of-life obligations |
What are the plans and cost responsibilities for decommissioning, recycling and site restoration? |
9. Key Risks Through 2030
Grid congestion and curtailment: Fast capacity growth can outpace transmission expansion, reducing realised energy output and weakening project economics.
Auction and revenue-model design: Underpriced bids, weak indexation or unrealistic delivery dates can make awarded projects unfinanceable.
Trade and localisation measures: Tariffs, domestic-content rules, supply-chain screening and product-security concerns may change procurement eligibility or cost.
Logistics and installation capacity: Larger turbines require specialised roads, ports, cranes, vessels and lifting plans; shortages can become critical-path constraints.
Technology and serial-defect exposure: Rapid platform scaling may reduce operating-history depth and increase the importance of warranty reserves and defect-allocation terms.
Long-term service concentration: A low initial turbine price can be offset by expensive spares, slow response or limited major-repair capability.
Financing and interest-rate sensitivity: Offshore and other capital-intensive projects are particularly exposed to financing cost and delayed final investment decisions.
10. Outlook: The Market Is Expanding, but Credibility Will Determine Who Converts Growth into Orders
The wind market enters the second half of the decade with record annual deployment, a cumulative base approaching 1.3 TW and strong medium-term expansion forecasts. Onshore wind will remain the principal source of equipment volume. Offshore wind will remain a high-value growth segment, but project conversion will depend on auction design, grids, ports, supply-chain capacity and finance.
Manufacturing scale is becoming more concentrated, yet international competition remains pluralistic. Chinese OEMs have expanded rapidly and achieved record overseas installations, while Western OEMs retain a strong position outside China through broad market coverage, established service networks and lender familiarity. Regional manufacturers also remain important in markets such as India.
For suppliers, the decisive question is no longer whether global wind demand exists. It is whether a product and delivery model can satisfy the technical, financial and operational requirements of a specific market. The most durable opportunities will therefore be captured by companies that connect technology with bankability, local execution, lifecycle service and transparent risk allocation.
Final assessment
Through 2030, successful wind-market entry will be defined less by the lowest turbine quotation and more by the ability to deliver a financeable, grid-compliant and serviceable power asset for its full operating life.
Data and Methodology Note
This article uses the latest publicly available figures identified through 29 June 2026. Capacity totals from GWEC, IEA, WindEurope and Wood Mackenzie are presented with their original time periods and methodologies. Where two sources use different definitions—most notably GWEC’s 165 GW global additions and Wood Mackenzie’s 176 GW OEM-installation total—the figures are kept separate and explicitly explained. Percentages shown in the figures are calculated from the cited source values and rounded to one decimal place.
References
[1] Global Wind Energy Council (GWEC), “Global Wind Installations Rise Record 40% as Industry Charts Way Out of Energy Crisis,” 20 April 2026.
[2] International Energy Agency (IEA), “Renewable Electricity,” Renewables 2025.
[3] WindEurope, “Wind Energy in Europe: 2025 Statistics and the Outlook for 2026–2030,” 26 February 2026.
[4] Wood Mackenzie, “Chinese OEMs Secure 78% of the 176 GW Wind Additions in 2025,” 14 April 2026.
[5] Global Wind Energy Council (GWEC), “GWEC Report: Fast-Track Offshore Wind To Help Prevent Future Energy Crises,” 9 June 2026.
[6] Wedoany, original Chinese-language market analysis used as the editorial starting point.
Editorial note: This report is intended for market research and business-planning purposes. Project decisions should be based on current country-specific regulation, tender documentation, technical due diligence and professional legal and financial advice.