en.Wedoany.com Reported - In June 2026, Australia's utility-scale solar photovoltaic and wind energy assets generated a total of 4.73 TWh, an 11% increase from 4.25 TWh in June 2025, continuing the year-on-year growth trend for this category since the start of 2026. In May, generation was 4.6 TWh, up 10% year-on-year; in April, it was 4.7 TWh, up 24%; and in March, it was also 4.7 TWh. The year-to-date peak occurred in February at 5 TWh, primarily due to strong summer solar irradiance in several states.
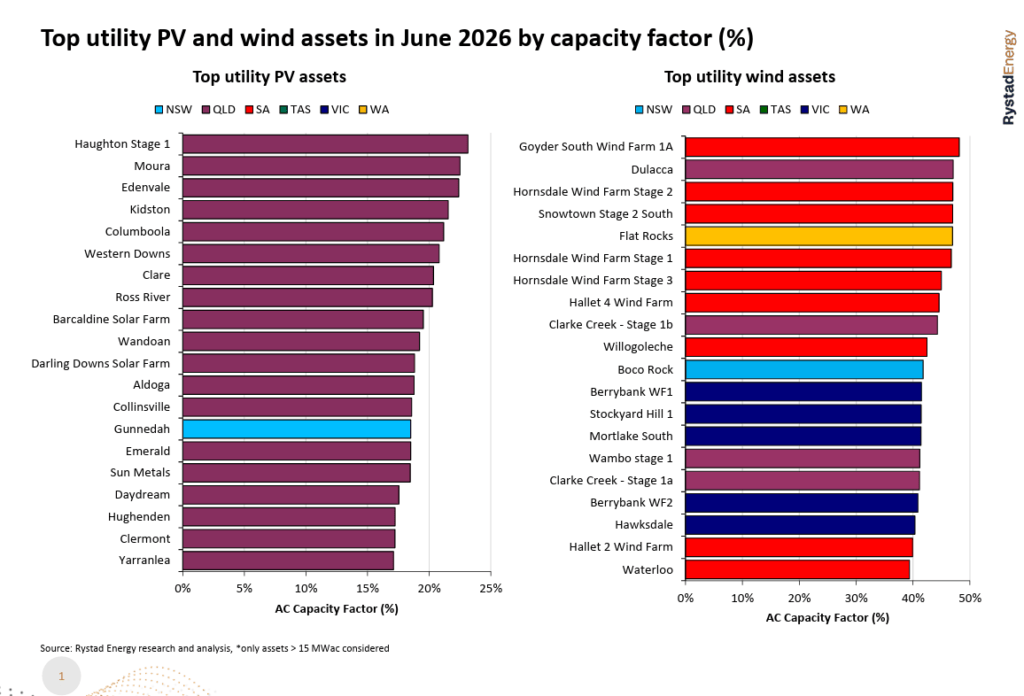
In June, Victoria led all states in total utility-scale solar and wind generation, reaching 1,369 GWh, of which utility-scale solar photovoltaic generation accounted for 114 GWh and wind generation for 1,255 GWh. In the utility-scale solar photovoltaic sector, the best-performing projects were all located in Queensland, where winter irradiance conditions favor low-latitude assets. Pacific Blue Australia's 100 MW Haughton Phase 1 project ranked first with a 23.1% AC capacity factor, followed by METKA's Moura project (22.5%) and the Sojitz/ENEOS Group's Edenvale project (22.4%). Among the top 20 utility-scale photovoltaic assets ranked by capacity factor, 19 were located in Queensland, with the sole exception being the Gunnedah Solar Farm in New South Wales. Queensland's dominance in the winter solar rankings reflects its low latitude and the recent commissioning of large-scale projects concentrated in the Central West and Darling Downs regions.
The most forward-looking indicator in the June data comes from the construction side. June 2026 marks the first time Australia has seen more than 3 GWdc of utility-scale solar photovoltaic construction commence within a calendar year, with over six months still remaining in the year. That month, Lightsource bp launched the 380 MWdc Lower Wonga solar-plus-storage project in Queensland, pushing the year-to-date total past this milestone. Dickson noted that of the 3 GWdc commenced so far in 2026, approximately 43% (about 1.3 GWdc) is located at remote mine sites, reflecting growing interest in behind-the-meter renewable energy generation in the resources sector, while the grid-connected project pipeline also advances.
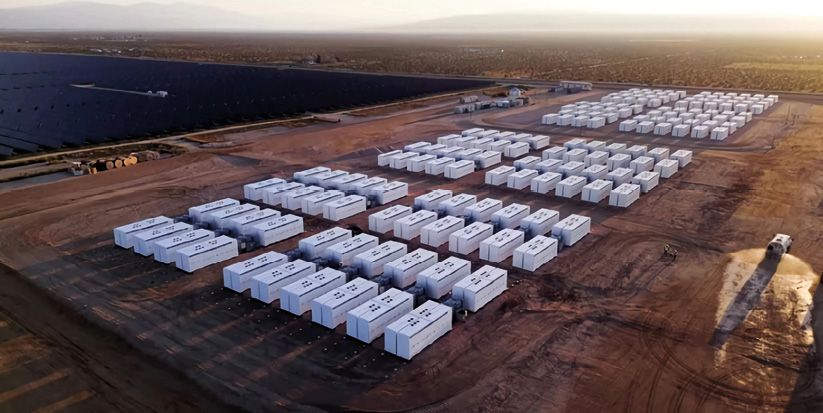
The results of the eighth round of the Capacity Investment Scheme (CIS) were announced in June, with the federal government awarding contracts for 15 battery energy storage projects totaling 4.2 GW and 16.1 GWh, covering the National Electricity Market (NEM). Queensland received the largest single-state allocation, with Ampyr Energy securing four of the 15 contracts, cementing the state's position as a primary destination for solar construction and new storage procurement in the current investment cycle.
In June, spot electricity prices remained low across most of the NEM, with all states except South Australia recording prices below AUD 90/MWh (USD 62/MWh). South Australia's monthly average was pushed above AUD 125/MWh due to a period of low wind generation at the end of the month, but the state overall set a record for wind generation in June.
The average hourly operational demand throughout the day in June 2026 was significantly lower than in June 2025, with New South Wales' evening peak demand at approximately 10 GW, compared to over 11 GW in the same period last year. Dickson attributed this decline primarily to higher-than-average winter temperatures reducing heating demand; however, the magnitude of the shift in morning and evening peaks also reflects the cumulative effects of rooftop solar self-consumption, improved building energy efficiency, and load absorption by household battery energy storage systems.