Rising European Demand Could Push Up 2026 US Natural Gas Futures Prices
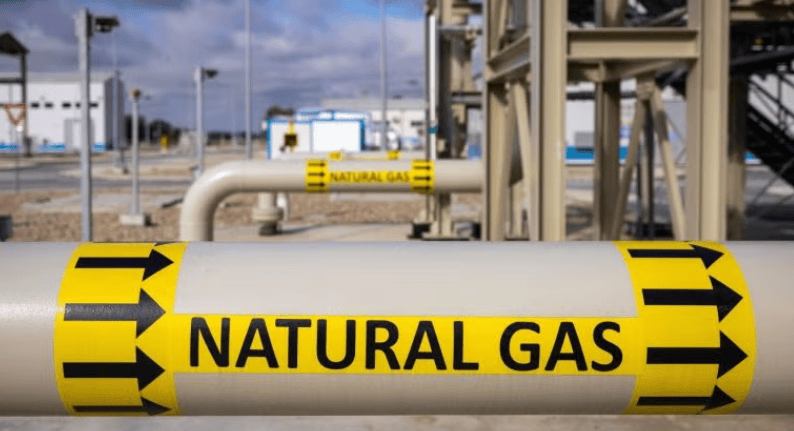
en.Wedoany.com Reported - The price gap between US and European natural gas is widening. Analysts noted on April 24, 2026, that if the war in Ukraine and hostilities in the Middle East persist or escalate, rising demand for liquefied natural gas (LNG) in Europe and Asia could increase demand for US LNG, thereby pushing up prices and keeping them above key technical support levels, potentially creating a bullish outlook for New York Mercantile Exchange (NYMEX) US natural gas futures in the coming months.
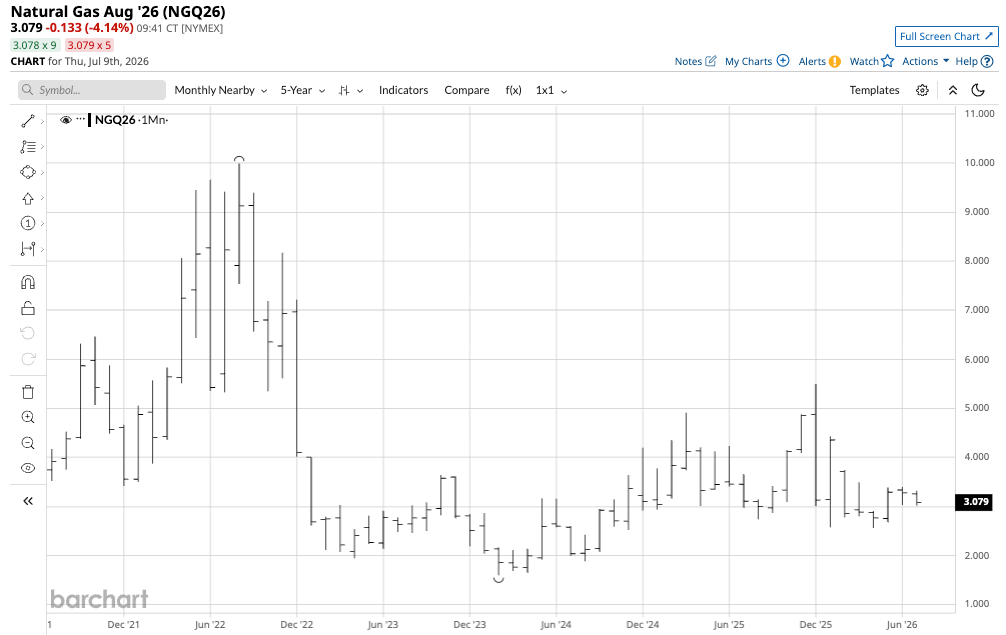
On April 23, the front-month US NYMEX natural gas price was $2.73 per million British thermal units (MMBtu). By July 2026, the front-month August contract price had exceeded $3 per MMBtu. US natural gas futures hit a low of $2.561 per MMBtu on April 14, 2026, during the shoulder season when both heating and cooling demand were absent.
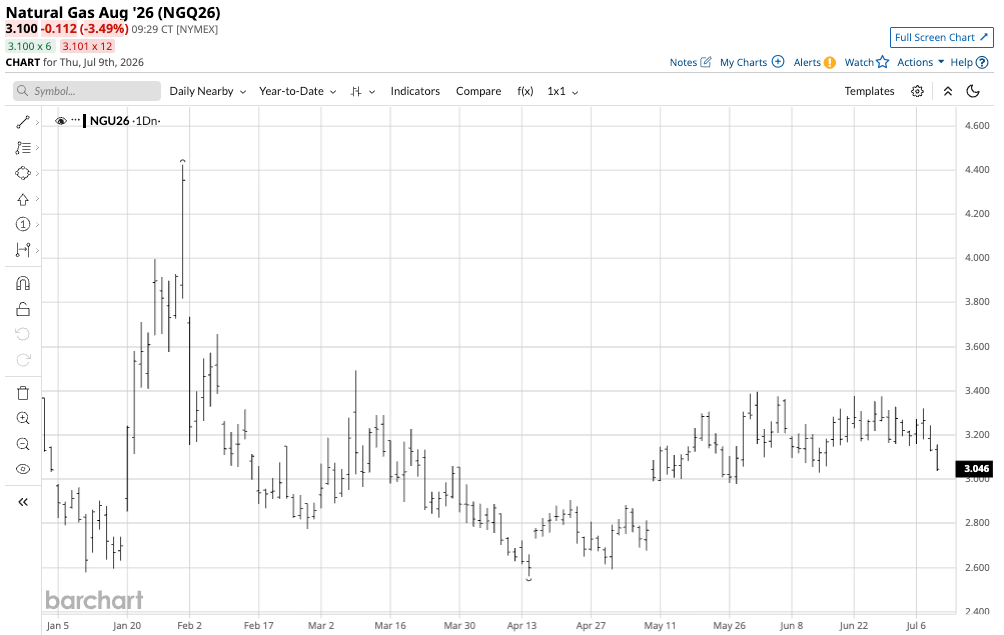
The daily chart shows that since mid-April, natural gas futures have formed higher lows, rising to a high of $3.396 per MMBtu on June 1, 2026. At just above $3.00, natural gas remains slightly above the midpoint between the mid-April low and the early June high. The energy commodity has formed higher lows but has been trading in a range just above $3 and just below $3.40 since late May, threatening the bottom of that range on July 9.
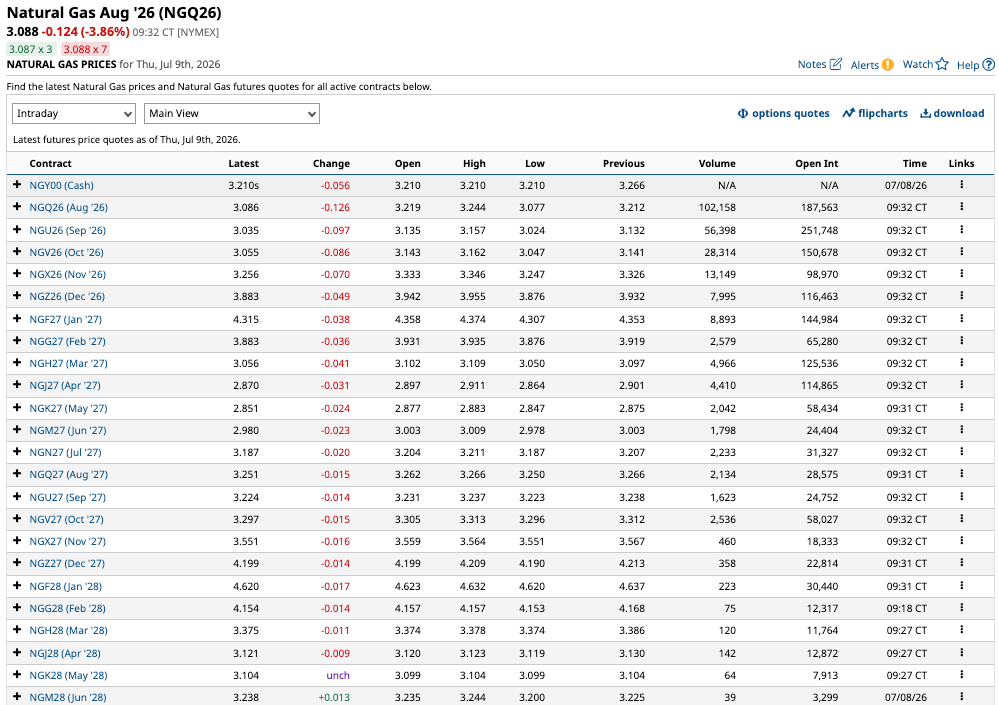
The forward curve from August 2026 to June 2028 shows prices peaking during the winter heating season, hitting lows during the April-May shoulder period, and then gradually climbing as the summer cooling season begins, reflecting the seasonal volatility characteristics of natural gas.
US natural gas futures began trading on the NYMEX division of the Chicago Mercantile Exchange (CME) in 1990, when the energy commodity was transported only via pipeline within the Americas. Advances in liquefaction technology created opportunities to export LNG to higher-priced regions beyond the pipeline network. The US has become a leading global producer and exporter of natural gas.
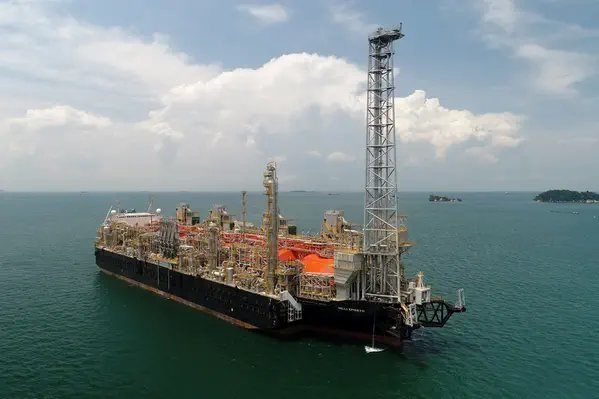
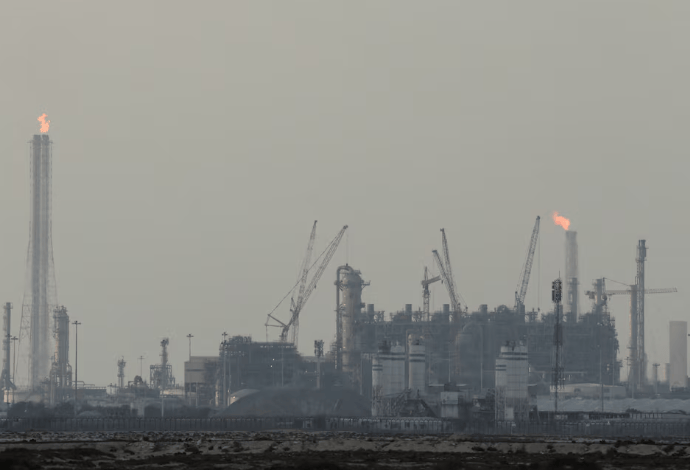
The US has the largest LNG capacity. Australia ranks second, with exports primarily directed to Asia. Qatar and Russia rank third and fourth, respectively, with combined export capacity exceeding that of the US. Historically, Europe relied on LNG supplies from Russia and Qatar, but sanctions and retaliatory measures stemming from the war in Ukraine have restricted Russian LNG exports to Europe. In 2026, hostilities near the Strait of Hormuz further limited Europe's access to Qatari LNG, thereby increasing demand for US LNG. The Strait of Hormuz is a critical logistical bottleneck for crude oil, LNG, fertilizers, and other commodities, with ongoing tensions in the Middle East causing supply shortages and concerns over future disruptions.
In July 2026, European natural gas futures prices remained elevated. The UK natural gas continuous monthly chart shows a price of 119.68 on July 9, 2026, higher than July 2025 (trading range 76.56-87.61) and July 2024 (trading range 70.00-87.25).
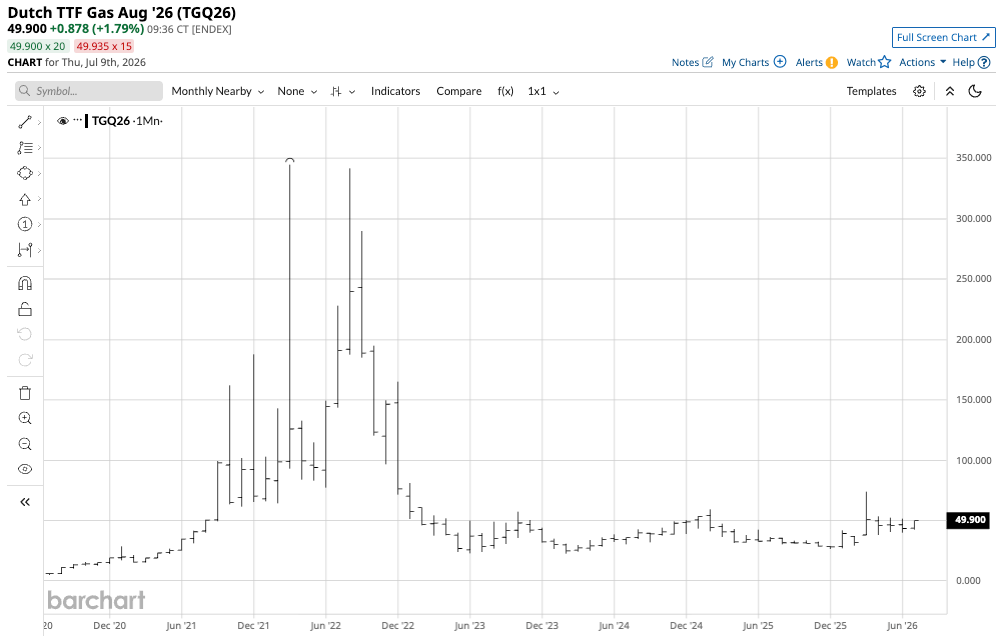
The Dutch natural gas continuous monthly chart shows a price of 49.90 on July 9, 2026, higher than July 2025 (trading range 32.365-36.32) and July 2024 (trading range 30.325-36.00).
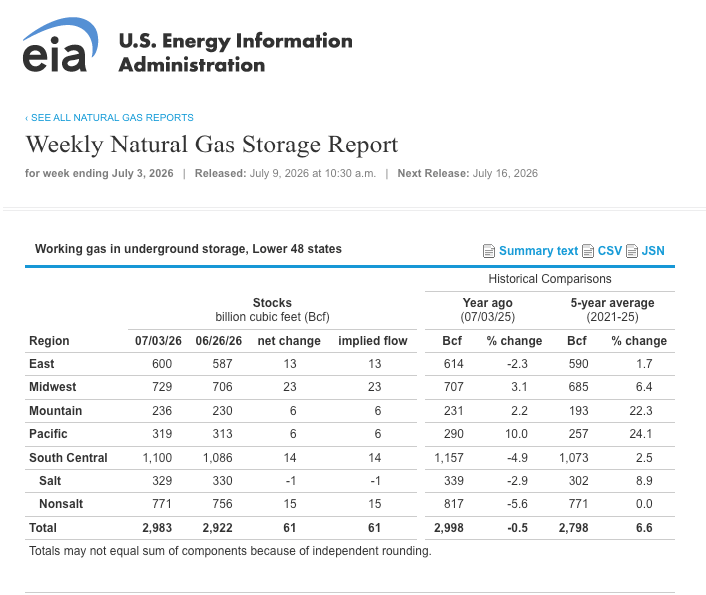
High European natural gas prices, sanctions on Russia, and the Strait of Hormuz issue are boosting Europe's demand for US LNG. Data from the US Energy Information Administration (EIA) shows that while US natural gas inventories were 6.6% above the five-year average as of the week ending July 3, 2026, they were 0.5% lower than levels at the beginning of July 2025. Increased LNG demand could lead to a year-over-year decline in inventories this year.
US energy policy under the Trump administration supports a production-increasing approach for crude oil and natural gas to achieve energy independence and boost exports. As of the week ending July 2, 2026, Baker Hughes reported 126 natural gas rigs operating in the US, up from 108 in the same period in 2025. Natural gas inventories are below year-ago levels, and production is increasing, reflecting rising LNG demand from Europe and other high-price regions, with supply concerns driving US export growth.
The five-year monthly continuous US natural gas futures chart shows a price range of $1.60 to $9.987 per MMBtu.
Ways to establish risk positions in the natural gas market include CME's NYMEX futures and futures options contracts. The United States Natural Gas Fund (UNG) is a non-leveraged product tracking US natural gas futures prices, trading at $11.02 per share, with $412.38 million in assets under management, an average daily trading volume of over 5.43 million shares, and an expense ratio of 1.24%. The bullish Ultra Bloomberg Natural Gas 2x Long ETF (BOIL) trades at $24.50 per share, with over $309.46 million in assets under management, an average daily trading volume of over 3.26 million shares, and an expense ratio of 0.95%. The bearish Ultrashort Bloomberg Natural Gas -2x Short ETF (KOLD) trades at $25.16 per share, with over $133.9 million in assets under management, an average daily trading volume of over 3 million shares, and an expense ratio of 0.95%. The leveraged BOIL and KOLD ETFs experience significant time decay as they use options and swap contracts to create leverage, making them suitable only for short-term trading.
Related Products
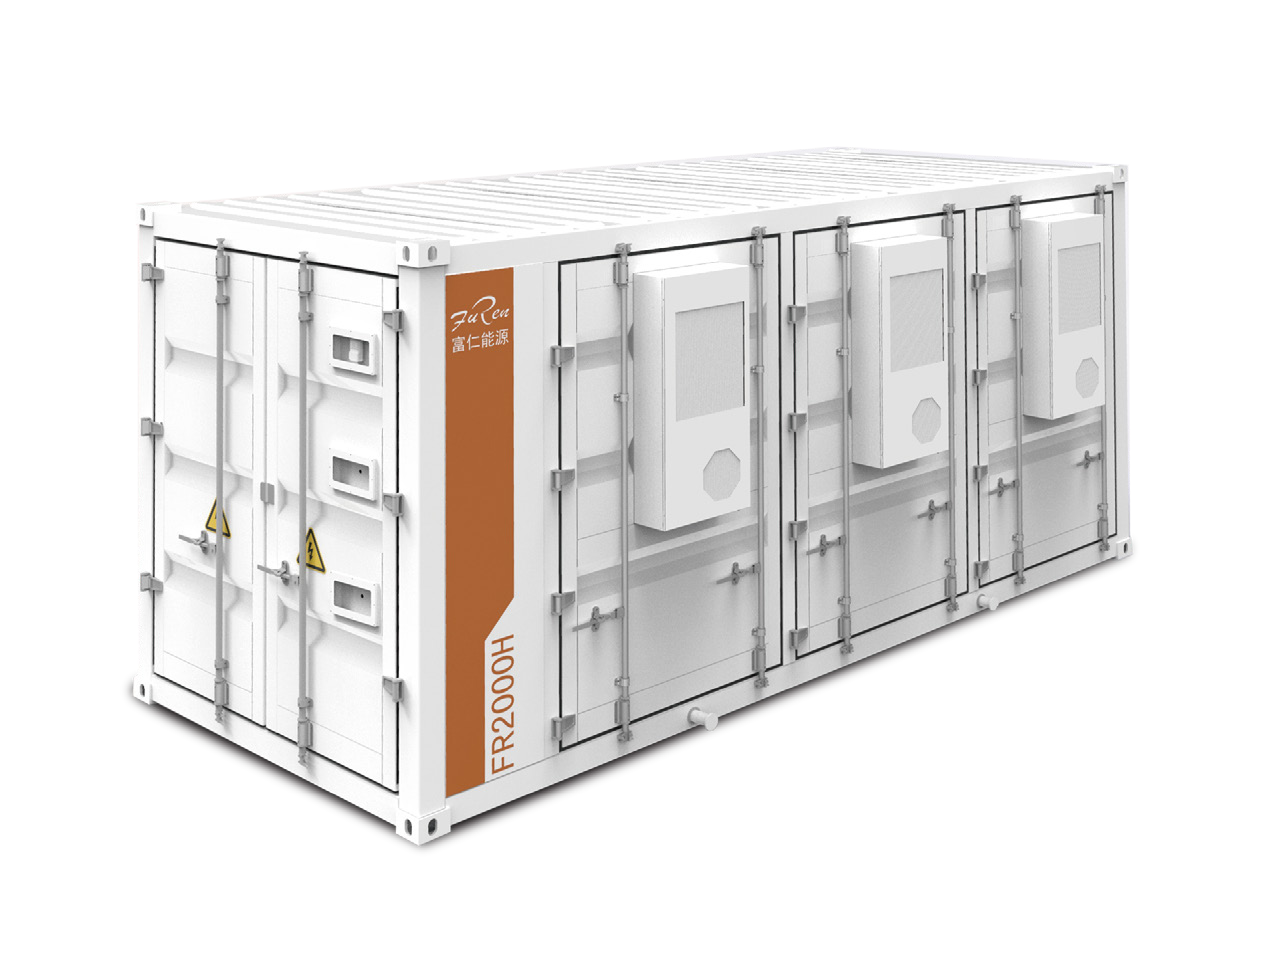

FR2000H 2.15MWh (Air-cooled) 20-foot Containerized Energy Storage System
Jiangyin Furen High-tech Co., Ltd.
GW4-40.5/72.5/126/145/170/252/363/420 Series Double-column Horizontal Rotary High-voltage AC Disconnect Switch
SHANDONG TAIKAI DISCONNECTORS CO., LTD.

Microcomputer Protection and Substation Automation
Beijing Agent Devote Power Technology Development Co., Ltd.




Yingping Mining Section Open-pit Tailings Backfill Treatment of Goaf Ecological Restoration EPC Project
China Bluestar Lehigh Engineering Corporation
Mars (Liquid Cooling) Series Industrial and Commercial Energy Storage Converter High Protection Module
Shenzhen Winline Technology Co., Ltd.