1. Product Scope and Price Segmentation
Steel pipe prices should first be separated by manufacturing route and end use. A supplier offering a low-cost welded hollow section is not economically comparable with a sour-service seamless line pipe, a high-temperature process pipe or a corrosion-resistant stainless pipe.
|
Product segment |
Typical route |
Principal standards / use |
Main price premium |
|
Commodity welded carbon pipe |
ERW/HFI from hot-rolled coil |
ASTM A53, structural and mechanical applications |
Coil price, diameter, wall thickness and galvanizing |
|
Large-diameter line pipe |
HFW, SAW/LSAW or spiral SAW from coil/plate |
API 5L; oil, gas, water and CO₂ transport |
Plate quality, weld process, PSL 2 testing, coating and project qualification |
|
Seamless carbon/alloy pipe |
Billet piercing, rolling, heat treatment and finishing |
ASTM A106/A335; refinery, power and high-temperature service |
Billet quality, heat treatment, dimensional control and NDE |
|
OCTG / premium tubulars |
Seamless or welded with heat treatment, threading and connections |
API 5CT and proprietary grades/connections |
Grade, collapse/burst performance, threading and field service |
|
Stainless / CRA pipe |
Seamless or welded stainless and nickel-alloy routes |
ASTM A312 and project specifications |
Nickel/chromium/alloy content, heat treatment, pickling and traceability |
|
Coated water / industrial pipe |
Welded or seamless with external/internal coating |
AWWA/project standards and coating specifications |
Surface preparation, coating material, holiday testing and handling |
1.1 Price Units and Conversion
Recommended bid units: USD/metric tonne for mill economics, USD/metre for project procurement, and installed USD/metre for EPC decisions. The same nominal pipe size can carry different mass and cost because schedule and wall thickness change.
Approximate carbon-steel mass formula: kg/m = 0.02466 × wall thickness (mm) × [outside diameter (mm) − wall thickness (mm)].
|
Worked example |
Calculation |
Result |
|
12-inch pipe, OD 323.9 mm, wall 9.53 mm |
0.02466 × 9.53 × (323.9 − 9.53) |
Approximately 73.9 kg/m |
|
Pipe at USD 1,200/t |
73.9 kg/m × USD 1.20/kg |
Approximately USD 88.7/m before coating, freight, duties and installation |
Dimensional standard reference: ASME B36.10M for welded and seamless wrought steel pipe. The mass formula is an engineering approximation using carbon-steel density; procurement should use certified mill mass and tolerances.
2. Price Trend Analysis, 2021–2026
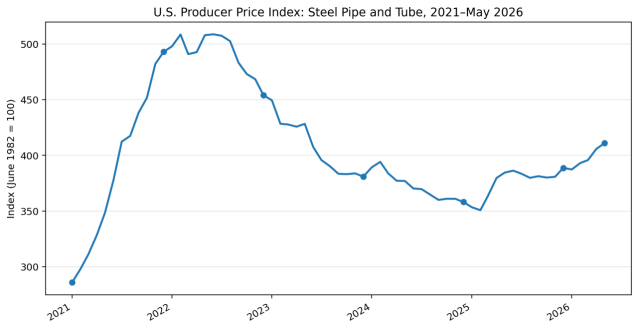
Figure 1. U.S. Producer Price Index for steel pipe and tube
Source: U.S. Bureau of Labor Statistics, Producer Price Index by Commodity, series WPU101706, accessed through FRED. The series measures U.S. producer selling-price changes and is not a transaction price in USD/t.
Cycle interpretation. The 2021–2022 surge reflected the broad steel shortage and price shock. Pipe prices corrected with a lag because manufacturers carried higher-cost inventory, contract pricing and conversion costs. By 2025 the index had largely stabilized; the 2026 increase coincided with firmer U.S. steel inputs and stronger trade protection.
|
Period |
Annual average / latest index |
Change |
Market reading |
|
2021 |
387.1 |
— |
Rapid escalation through the year |
|
2022 |
491.3 |
+26.9% YoY |
Peak annual average; monthly high early/mid-year |
|
2023 |
407.0 |
−17.2% YoY |
Inventory normalization and lower steel inputs |
|
2024 |
372.2 |
−8.6% YoY |
Further correction and weak demand |
|
2025 |
376.1 |
+1.0% YoY |
Broad stabilization; recovery in spring |
|
Jan–May 2026 |
398.6 |
+6.0% vs 2025 average |
Partial-year measure; renewed upward pressure |
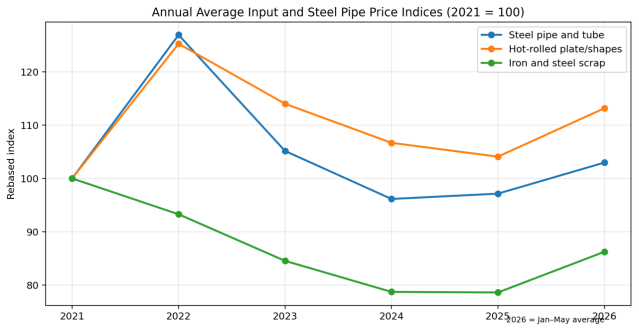
Figure 2. Relative movement of steel pipe, plate and scrap indices
Sources: U.S. Bureau of Labor Statistics/FRED series WPU101706, WPU101704 and WPU1012. Annual averages rebased to 2021 = 100. 2026 represents January–May only; series have different original base years and are compared only as relative movements.
Input-price pass-through is incomplete and delayed. Welded pipe follows coil or plate more directly; seamless pipe also reflects billet and scrap but retains larger processing, heat-treatment and qualification premiums. Inventory accounting, contract lags and mill utilization can temporarily widen the spread between steel input indices and finished-pipe prices.
3. Manufacturing Cost Structure
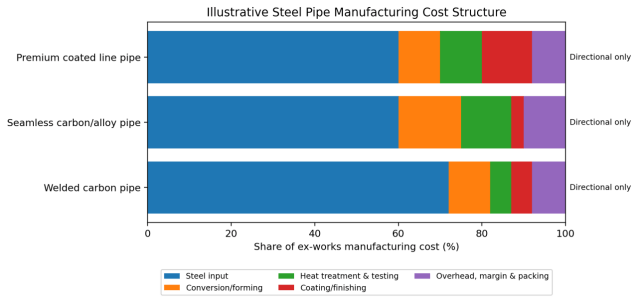
Figure 3. Illustrative steel pipe manufacturing cost structure
Directional model based on manufacturing-route economics and public producer disclosures. It is not a measured global average and is not intended for bid evaluation without supplier-specific cost data.
Public company evidence. Tenaris disclosed that, on average in 2025, steel scrap, pig iron, HBI and DRI represented about 20% of its steel pipe product costs; purchased billets, coils and plates represented about 14%; and direct energy represented about 3%. These figures reflect an integrated, premium global producer and should not be applied mechanically to a standalone welded-pipe mill.
|
Cost driver |
Welded pipe impact |
Seamless pipe impact |
Procurement implication |
|
Coil / plate / billet |
Very high; direct yield and width utilization |
High; billet grade and diameter mix |
Use an agreed steel-index adjustment formula where appropriate |
|
Yield loss and scrap |
Edge trim, weld trim and cut length |
Piercing loss, crop ends and heat-treatment rejects |
Specify yield assumptions only for open-book contracts |
|
Energy |
Welding, forming, heat treatment if required |
Piercing, rolling, reheating and heat treatment |
Regional electricity and gas prices affect conversion premium |
|
Labor and mill utilization |
High sensitivity at low order volume |
High fixed cost and long campaign setup |
MOQ and production-window commitments can reduce price |
|
Testing and documentation |
Hydrotest, eddy current/UT, dimensional inspection |
UT, hydrotest, heat treatment records and traceability |
Define inspection level, witness points and document language |
|
Coating and finishing |
Galvanizing, FBE, 3LPE/3LPP, internal lining |
Threading, beveling, varnish and premium connections |
Treat as separate line items with thickness and test requirements |
|
Packing and logistics |
Bundles, end protectors, container/open-top/breakbulk |
Heavy-wall handling and damage prevention |
Optimize lengths, nesting, port handling and storage |
4. Trade, Tariffs and Landed Cost
Trade treatment can now be larger than the manufacturing margin. A nominally cheaper mill can become the most expensive delivered source once Section 232 duties, EU quota status, anti-dumping/countervailing duties, origin rules, freight and inland logistics are applied.
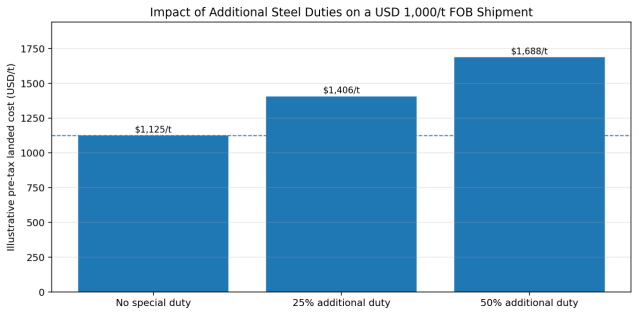
Figure 4. Illustrative impact of additional steel duties
Illustrative scenario only: USD 1,000/t FOB, USD 120/t freight/inland and USD 5/t insurance. Duty applied to the simplified customs base. Excludes ordinary customs duty, VAT/GST, anti-dumping/countervailing duties, brokerage, port storage and financing.
|
Destination / regime |
Current structural issue |
Commercial effect |
Buyer action |
|
United States |
Covered steel products are subject to a 50% Section 232 additional duty under the 2026 regime |
Imported pipe can lose any ex-works advantage; customs classification and metal-content rules are critical |
Confirm HTS code, country of melt/pour, derivative status and any applicable exclusions or special arrangements |
|
European Union |
From 1 July 2026, 18.3 Mt of tariff quotas are distributed by country/category; out-of-quota duty is 50% |
Quota timing can create a large landed-cost discontinuity |
Check CN category, country allocation, FTA status and live quota balance before shipment |
|
Other markets |
Anti-dumping, safeguards and local-content requirements vary by product and origin |
Duty exposure may be product-specific even within HS 7304–7306 |
Obtain a binding customs opinion and review active trade-remedy cases |
|
Project countries |
Local certification, inspection and domestic content can be mandatory |
Compliance and local processing may exceed ocean freight cost |
Separate imported mother pipe from local coating, threading and fabrication economics |
5. Global Supply Structure and Regional Pricing
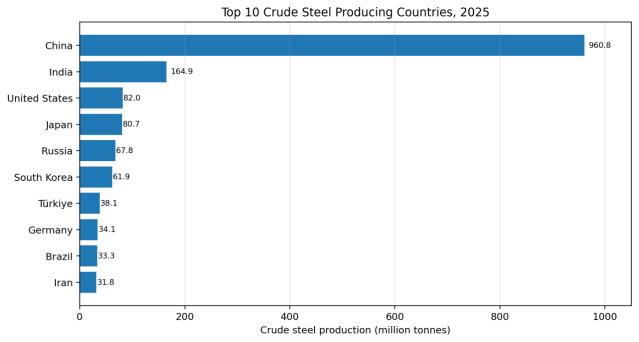
Figure 5. Top crude steel producing countries in 2025
Source: World Steel Association, 2025 global crude steel production totals. Crude steel output is a supply-base indicator, not steel pipe production.
Global crude steel production was 1,849.4 Mt in 2025, down 2.0% from 2024. China remained dominant at 960.8 Mt, while India rose 10.4% to 164.9 Mt. For steel pipe procurement, the relevant conclusion is not that every high-output country is the cheapest source; it is that large steelmaking bases have stronger access to coil, plate, billet, scrap and integrated logistics.
|
Region |
Typical cost position |
Pricing risks |
Best-fit sourcing logic |
|
China |
Highly competitive standard welded pipe and broad product range |
Trade remedies, quality-tier dispersion, origin scrutiny and export-policy changes |
Standardized products with strong inspection, traceability and landed-cost verification |
|
India |
Growing steel base and competitive seamless/welded capacity |
Long lead times in premium grades, local demand growth and logistics variability |
Diversification source for API/ASTM products after mill qualification |
|
Türkiye |
Strong welded pipe and regional logistics to Europe/MENA |
Scrap and energy exposure, EU quota/category treatment and currency volatility |
Regional projects where freight and short lead time matter |
|
United States |
High domestic selling prices but protected market and local availability |
Section 232, labor, scrap and plate volatility |
Critical projects requiring local content, short lead time and domestic certification |
|
European Union |
Premium quality, high energy/compliance cost and sophisticated product mix |
Energy cost, quota management and carbon-related compliance |
High-spec process, mechanical and energy projects |
|
Middle East |
Growing local line-pipe and coating capability |
Project cycles, local-content rules and feedstock dependence |
Large oil, gas, water and industrial projects with local finishing |
|
Southeast Asia |
Competitive regional welded pipe and fabrication |
Mill scale, qualification depth and imported steel input exposure |
Regional infrastructure and industrial applications |
|
Latin America / Africa |
Selective local capacity; significant import dependence |
FX, financing, ports, inland transport and project execution |
Optimize delivered length, local coating/fabrication and inventory strategy |
5.1 Excess Capacity and the 2026–2028 Price Ceiling
The OECD estimates global steel excess capacity at 640 Mt in 2025 and projects 745 Mt by 2028 as capacity grows faster than demand. This creates continuing downward pressure on export prices and encourages trade actions. The result is not a single low global price, but increasingly fragmented regional prices separated by duties, quotas, local-content rules and certification barriers.
6. Why Seamless, Line Pipe and Premium Tubular Prices Diverge
|
Premium factor |
Technical mechanism |
Price effect |
Verification |
|
Seamless route |
Billet piercing, elongation, sizing and multiple heat-treatment stages |
Higher conversion cost and lower yield than commodity ERW |
Mill route, heat-treatment cycle and production records |
|
High grade / alloy |
Microalloying, chromium, molybdenum, nickel or controlled chemistry |
Higher alloy input and tighter process control |
MTC chemistry, PMI and heat traceability |
|
PSL 2 / sour service |
Tighter chemistry, toughness, hardness, HIC/SSC and enhanced NDE |
Testing, reject risk and qualification premium |
API 5L edition, annexes, test frequency and third-party witness |
|
CO₂ / hydrogen-related service |
Fracture control, weld quality, toughness and compatibility requirements |
Engineering and qualification premium; product route may change |
Design code, gas composition, decompression analysis and qualification test plan |
|
Premium connections / threading |
Precision machining, gauging, phosphating and licensed designs |
High value-add and IP/service premium |
Connection license, gauges, torque-turn data and field service |
|
External/internal coating |
Blast cleaning, FBE/3LPE/3LPP/lining, holiday and adhesion tests |
Material plus factory and handling premium |
Coating thickness, cutback, repair and test standards |
|
Project documentation |
ITPs, MDRs, digital traceability and client audits |
Engineering-hours and schedule premium |
Document register, review cycles and language requirements |
Standards update. API published the 47th edition of API Spec 5L in June 2026. It adds requirements across more than 15 areas, including HFW pipe quality and pipe for CO₂ transport. New-edition adoption can affect qualification, test scope, documentation and bid comparability during the transition period.
7. Project Economics: From Pipe Price to Installed and Lifecycle Cost
The correct economic unit is often installed USD/metre. Pipe tonnage is only one part of a pipeline or process-piping system. Welding, coating repair, bends, fittings, NDE, hydrotesting, trenching, supports, corrosion control and commissioning can exceed the bare-pipe cost.
|
Lifecycle element |
Low-price failure mode |
Economic consequence |
Procurement control |
|
Dimensional consistency |
Ovality, wall variation and end mismatch |
Slower fit-up, more weld repair and lower construction productivity |
Tighter tolerances, end measurement records and trial fit-up |
|
Weld / body integrity |
Defects pass weak inspection or documentation |
Leak, rupture, replacement, shutdown and regulatory exposure |
Qualified NDE, data retention, third-party inspection and defect acceptance criteria |
|
Corrosion protection |
Coating damage, poor adhesion or wrong material |
Early corrosion, CP demand and excavation/repair |
Coating procedure, holiday testing, handling specification and field-repair system |
|
Material compatibility |
Wrong grade, hardness or sour-service performance |
Cracking, embrittlement or premature failure |
PMI, heat traceability, HIC/SSC tests and hardness mapping |
|
Weldability |
High carbon equivalent or inconsistent chemistry |
Preheat, slow welding, repair and schedule delay |
CE/Pcm limits and welding procedure qualification |
|
Length and logistics |
Short random lengths or transit damage |
More field welds, handling and wastage |
Optimize double-joint/long lengths, packing and damage protocol |
|
Supplier continuity |
Mill cannot reproduce or replace material |
Emergency premium and project delay |
Capacity reservation, spare quantity and replacement lead-time commitment |
7.1 Illustrative Installed-Cost Logic
|
Cost layer |
Typical basis |
Why it varies |
|
Bare pipe |
USD/t or USD/m |
Grade, route, dimensions, standard and order volume |
|
Coating / lining |
USD/m² or USD/m |
System, thickness, diameter, cutbacks and testing |
|
Freight and duties |
USD/t and ad valorem |
Distance, mode, quota, tariff, origin and port |
|
Field welding |
USD/joint or USD-metre |
Pipe length, wall thickness, process, productivity and repair rate |
|
Construction |
USD/m |
Terrain, trench, supports, traffic, water crossings and labor |
|
Integrity and O&M |
Annual and event-based cost |
Corrosion, inspection interval, leak consequence and shutdown cost |
8. Procurement Recommendations
8.1 Mandatory Quotation Normalization
- Use one line item per exact OD, wall thickness, grade, standard, length, end finish and coating. Do not accept blended USD/t pricing across sizes.
- Require the mill to state whether the quotation is ex-works, FOB, CIF, DDP or delivered to site and identify all taxes and duties excluded.
- Separate mother pipe, heat treatment, threading, coating, inspection, third-party fees, documentation, packing and freight.
- Define mass tolerance and whether invoicing is by theoretical mass, actual scale mass or piece count.
- Confirm country of melt and pour, manufacture, coating and finishing for origin and trade-remedy purposes.
- Fix the applicable edition of API, ASTM, ASME, ISO or EN standards and define the transition rule if a new edition becomes effective.
- Require a complete manufacturing and inspection plan before purchase order release.
8.2 Supplier Evaluation Matrix
|
Evaluation item |
Minimum evidence |
Commercial protection |
|
Mill capability |
Route, diameter/wall range, heat treatment, NDE and annual capacity |
No subcontracting without approval; named production line |
|
Quality system |
API/ISO licenses, audit results, NCR and claim history |
Right to audit and reject systemic nonconformance |
|
Material traceability |
Heat-to-pipe genealogy and digital records |
MDR acceptance linked to payment |
|
Testing |
Hydro, UT/ECT/RT, mechanical, impact, HIC/SSC as applicable |
Clear retest and rejection rules |
|
Delivery |
Rolling schedule, bottleneck equipment and raw-material booking |
Milestones, expediting and liquidated damages |
|
Trade compliance |
Origin, HTS/CN, quota and duty analysis |
Supplier indemnity for false origin or classification data |
|
Financial strength |
Audited statements, insurance and bank support |
Performance bond, retention and warranty security |
|
After-sales response |
Replacement stock, technical service and claim process |
Defined response and replacement lead time |
8.3 Risk Matrix
|
Risk |
Probability |
Impact |
Mitigation |
|
Steel input price moves after bid |
High |
Medium–High |
Index formula, validity period and raw-material booking evidence |
|
Tariff/quota status changes |
High |
High |
Customs review, alternative origin and duty-change clause |
|
Wrong standard edition or grade |
Medium |
High |
PO precedence clause, document review and pre-production meeting |
|
Dimensional or NDE failure |
Medium |
High |
ITP, witness/hold points and independent inspection |
|
Coating damage in transit |
Medium |
Medium–High |
Packing specification, loading survey and repair procedure |
|
Late delivery |
Medium–High |
High |
Capacity reservation, expediting, milestones and liquidated damages |
|
FX movement |
Medium |
Medium |
Currency hedge, price adjustment band and payment schedule |
|
Supplier lock-in for premium products |
Medium |
High |
Second-source qualification and long-term price mechanism |
9. Price Outlook, 2026–2028
|
Scenario |
Probability / trigger |
Expected price behavior |
Buyer strategy |
|
Base case: fragmented stability |
Global excess capacity persists; protected markets remain protected |
Competitive export prices outside protected markets; firm U.S./EU landed prices; premiums remain for qualified seamless and line pipe |
Dual-source globally, but lock quota/tariff treatment and qualified capacity |
|
Upside case |
Energy/raw-material shock, stronger oil and gas investment, trade restrictions expand |
Fast increase in plate, scrap and premium tubular prices; longer lead times |
Index-linked ceiling, early raw-material booking and capacity reservation |
|
Downside case |
Global demand weakens and export competition intensifies |
Lower generic welded-pipe prices and narrower mill margins; premium grades fall less |
Avoid excess inventory; negotiate shorter validity and flexible call-offs |
|
Project-specific spike |
Large pipeline/OCTG awards absorb qualified mills |
Premium product price and delivery escalation despite weak commodity steel |
Prequalify multiple mills and reserve production slots |
Industrial judgement. Generic steel pipe prices are unlikely to sustain a synchronized global rise while excess capacity continues to expand. However, the delivered price in the United States and the European Union can remain structurally high because of 50% tariff barriers, and qualified seamless, sour-service, CO₂ transport and premium connection products can retain strong conversion and certification premiums.
10. Conclusion
Steel pipe procurement has shifted from a simple mill-price comparison to a combined exercise in steel-cycle timing, manufacturing-route economics, trade compliance and project integrity. The BLS series shows that the 2021–2022 price shock corrected substantially through 2024, stabilised in 2025 and reversed upward in early 2026. That rebound should not be interpreted as a universal global shortage: the OECD projects still-greater excess capacity through 2028.
The best-value supplier is therefore not necessarily the lowest FOB bidder. It is the mill and supply chain that can deliver the exact mass, grade, dimensions, testing, coating, documentation and origin status required—at the lowest installed and lifecycle risk. Buyers should compare normalized USD/metre and landed USD/tonne, then overlay welding productivity, corrosion life, failure consequence and delivery certainty.
Final judgement: low-cost welded pipe remains exposed to global price competition, while protected-market landed prices and high-specification seamless/line-pipe premiums will remain resilient. Trade classification and quality scope can change project economics more than a modest difference in base steel price.
Related Products

QLZNGJ Intelligent Steel Reinforcement Trolley
Luoyang China Railway Qiangli Machinery Co., Ltd.


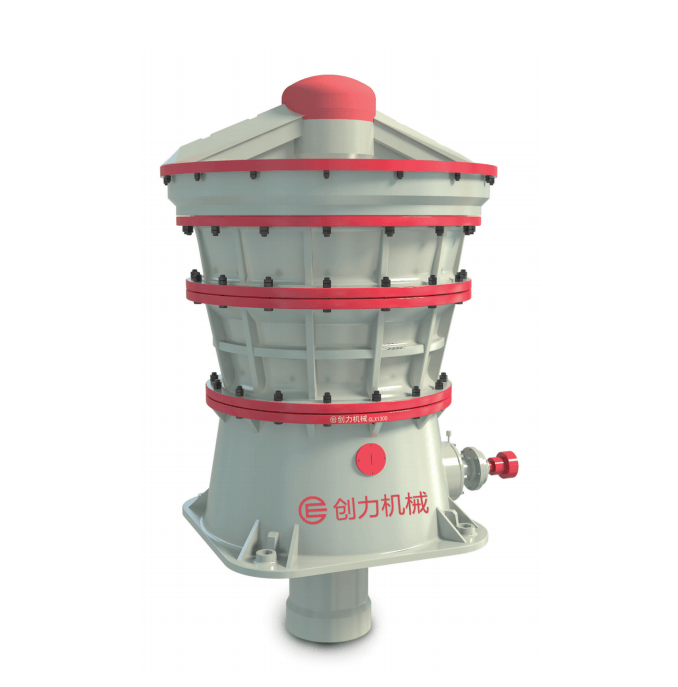
CLX Series Intelligent Hydraulic Gyratory Crusher
Guangdong CHUANGLI intelligent machinery Equipment Co., LTD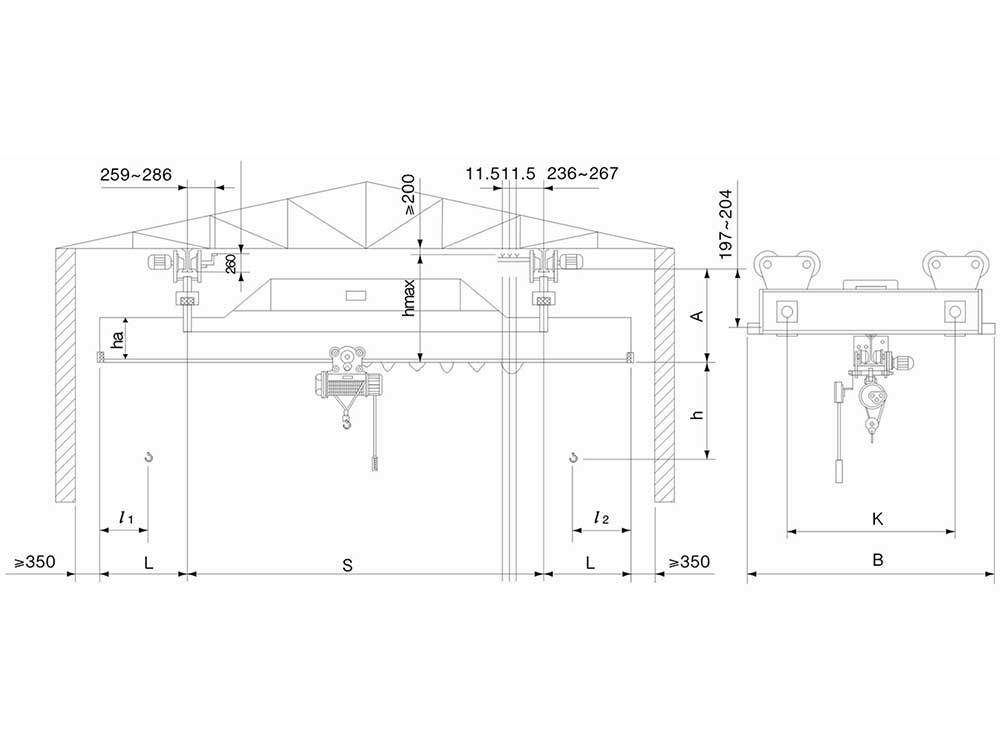
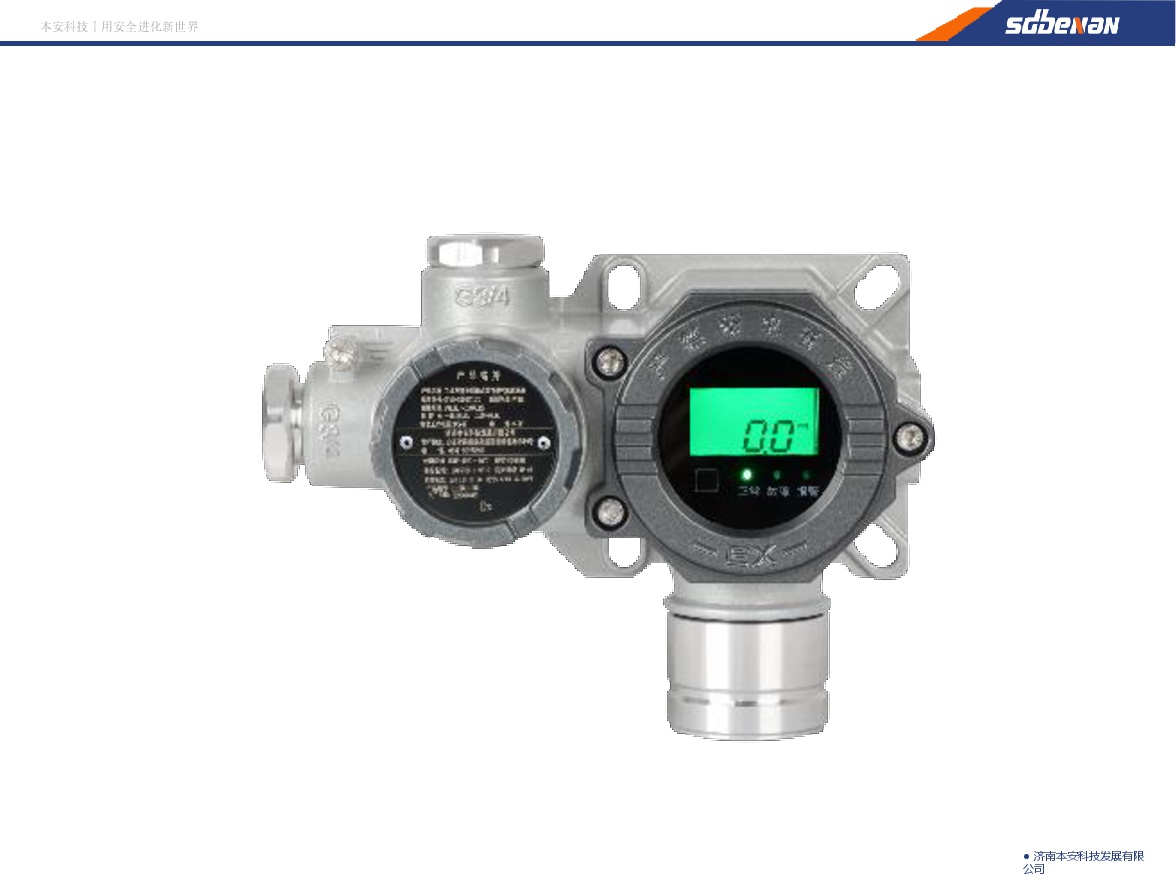
Industrial and Commercial Point-Type Gas Detector
Jinan Benan Technology Development Co., Ltd.
CAP1400 main feedwater flow nozzle flowmeter.
Jiangsu Hongda Instrument Technology Co., LTD.