1. Executive Summary
The global oil and gas oil pipeline market reached USD 115.28 billion in 2025, and is projected to expand to USD 195.09 billion by 2034 at a compound annual growth rate (CAGR) of 6.02%, according to Fortune Business Insights. A parallel estimate from Mordor Intelligence places the 2025 market at USD 103.63 billion, rising to USD 138.17 billion by 2031E at a CAGR of 4.92%. The divergence between these two datasets reflects differing scope definitions -- Fortune Business Insights includes broader midstream infrastructure capital and operational expenditure, while Mordor Intelligence focuses more narrowly on pipeline construction and related equipment. This report cross-references both sources and adopts range-based figures where statistical discrepancies arise.
Several structural forces are reshaping the market: sustained investment in Asian and Middle Eastern pipeline networks, the expansion of North American shale gas export corridors, accelerating adoption of smart monitoring and digital integrity management systems, and an offshore deepwater pipeline buildout driven by Brazil's pre-salt fields and Guyana's Stabroek block development. Against these drivers, ESG-related capital reallocation away from long-life hydrocarbon infrastructure, cybersecurity threats to operational technology (OT) systems, and rising steel input costs present material headwinds.
This report provides a full-chain analysis -- from upstream gathering lines through midstream transmission to downstream distribution -- covering market segmentation, regional dynamics, competitive landscape, technology trajectories, and risk factors. It is designed to serve industrial media, market intelligence desks, and strategic planning functions rather than as a product catalog or trend digest.
Figure 1: Global Oil & Gas Pipeline Market Size, 2022-2034E
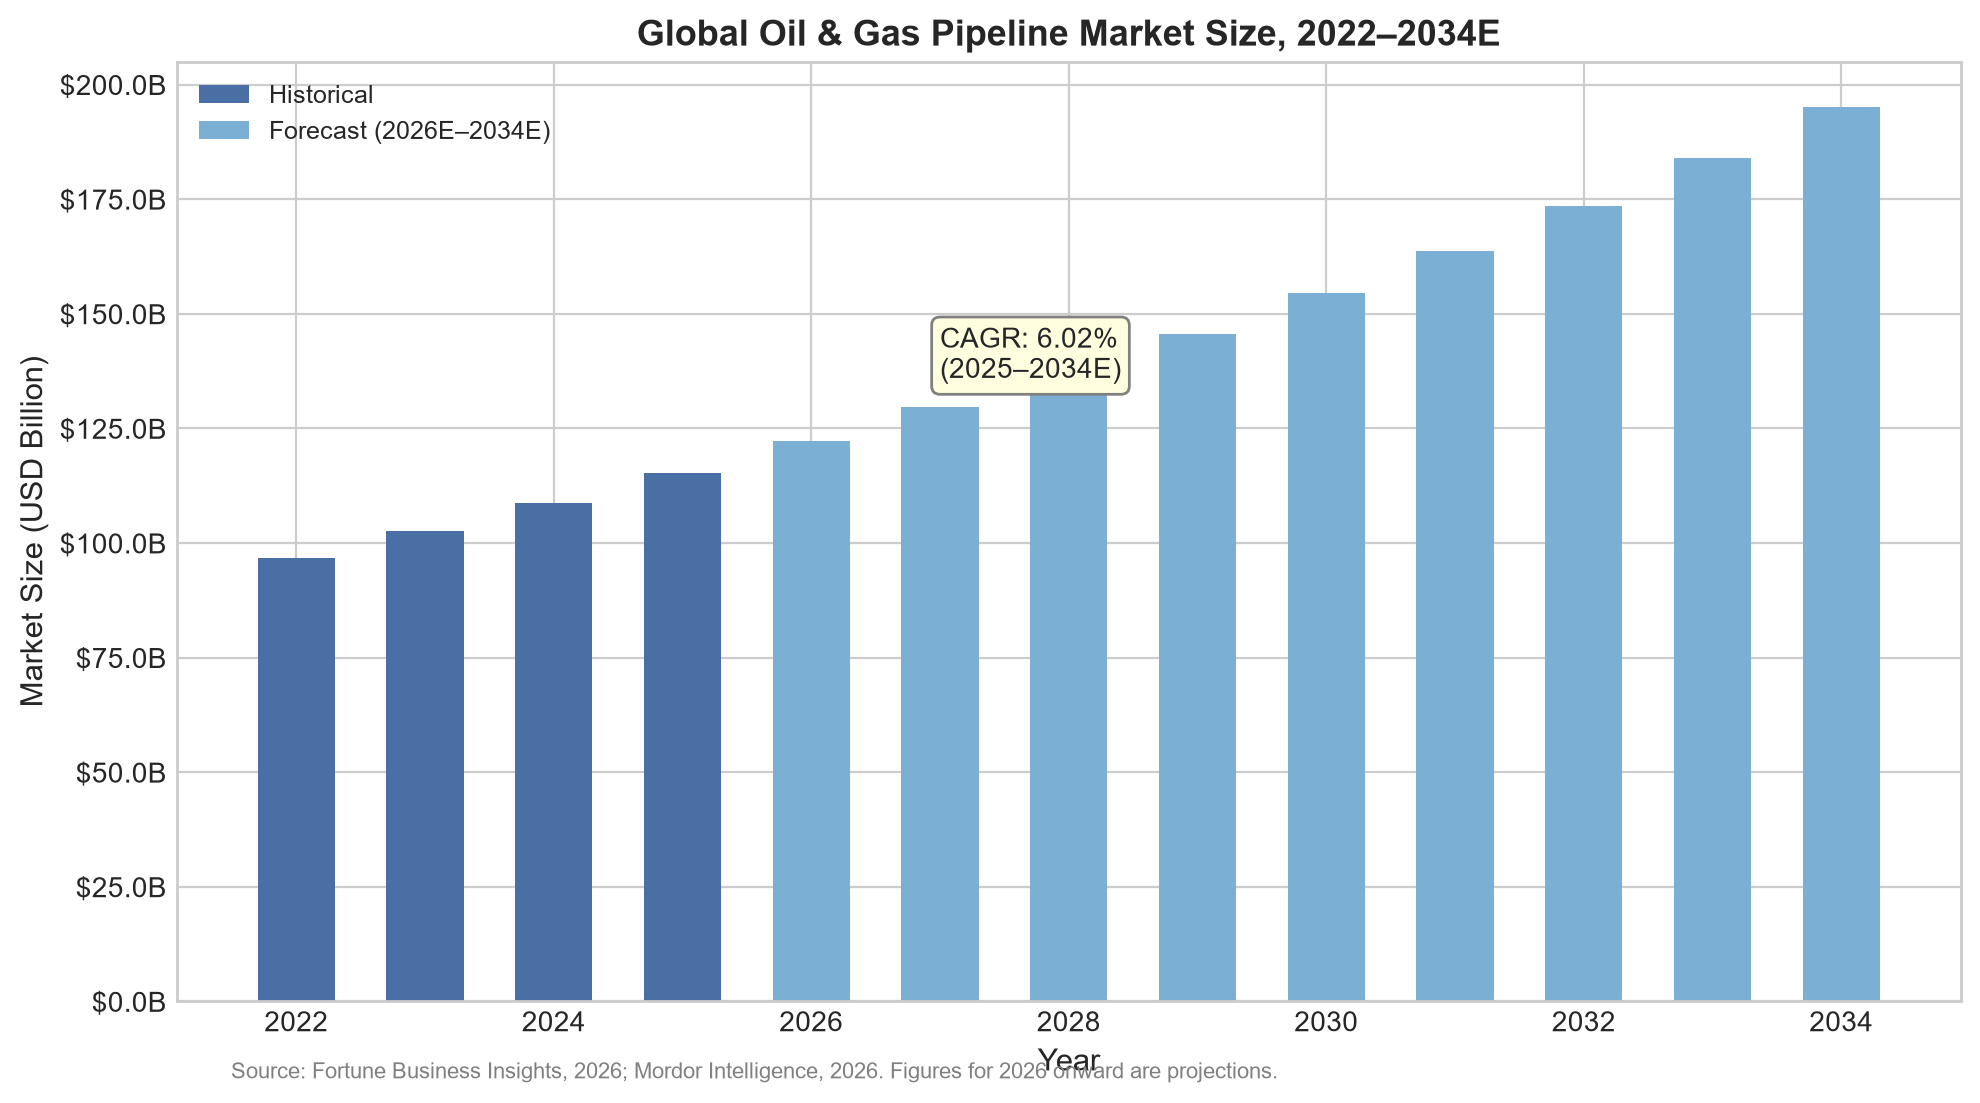
Source: Fortune Business Insights, 2026; Mordor Intelligence, 2026. Figures for 2026 onward are projections (denoted by "E"). USD Billion, nominal.
Figure 1 illustrates the trajectory from approximately USD 97-102 billion in 2022 to an estimated USD 195 billion by 2034. The step-up from 2025 to 2026 is notable -- new capital commitments in India (USD 67 billion gas network expansion), the United States (Permian Basin takeaway capacity additions), and the Middle East (ADNOC and Saudi Aramco multi-phase pipeline programs) collectively push the forecast above the historical trend line. The 6.02% CAGR cited by Fortune Business Insights is moderate compared to some emerging sub-segments -- offshore pipelines alone are projected at 7.05% -- and reflects the mature, capital-intensive character of the overall market.
2. Market Size and Growth Trajectory
2.1 Core Market Indicators
The table below synthesizes the two most widely referenced market size estimates, reconciling scope differences through transparent attribution rather than forced convergence.
|
Source |
2025 Market Size |
Forecast Year |
Forecast Value |
CAGR |
Scope |
|
Fortune Business Insights |
USD 115.28 Bn |
2034E |
USD 195.09 Bn |
6.02% |
Full midstream CAPEX + OPEX |
|
Mordor Intelligence |
USD 103.63 Bn |
2031E |
USD 138.17 Bn |
4.92% |
Pipeline construction & equipment |
|
Emergen Research |
USD 20.5 Bn |
2034E |
USD 34.1 Bn |
5.2% |
Pipeline construction only |
|
Maximize Market Research |
USD 31.62 Bn |
2032E |
USD ~50 Bn |
6.2% |
Narrow pipe product scope |
Table 1: Oil & Gas Pipeline Market Size Estimates by Source. Sources vary in scope (full infrastructure vs. pipe products only), hence the wide range in base-year values.
2.2 Market Segmentation by Activity
Capital expenditure (CAPEX) dominates the market at 73.65% of 2025 revenue, encompassing pipe procurement, compressor station installation, and construction services. Operational expenditure (OPEX) -- covering inspection, maintenance, repair, and eventual decommissioning -- accounts for the remaining 26.35%. Within CAPEX, approximately 60% is allocated to steel pipes and compression equipment, with the balance directed to engineering and construction labor. This split underscores that material and equipment selection decisions exert outsized influence on total project economics.
|
Segment |
2025 Revenue Share |
CAGR to 2031E |
Key Components |
|
CAPEX |
73.65% |
5.03% |
Pipe materials, compressors, construction services |
|
OPEX |
26.35% |
3.8% |
Inspection, MRO, integrity management, decommissioning |
Table 2: Market Segmentation by Activity Type, 2025. Source: Mordor Intelligence, 2026.
3. Segmentation Analysis
3.1 By Deployment Location: Onshore vs. Offshore
Onshore pipelines account for 85.05% of the 2025 market by revenue, reflecting the sheer volume of existing land-based gathering, transmission, and distribution networks. However, offshore pipelines -- though a smaller segment at 14.95% -- are projected to grow at a CAGR of 7.05% through 2031E, outpacing the onshore rate by a significant margin. This growth is anchored in three regional demand centers: Brazil's pre-salt development (Petrobras awarded Saipem a USD 2.8 billion flexible subsea flowline contract for the Mero field at 2,000 m water depth), Guyana's Stabroek block (requiring eight FPSO installations and approximately 450 km of flowlines by 2030), and Southeast Asia's deepwater gas field tiebacks.
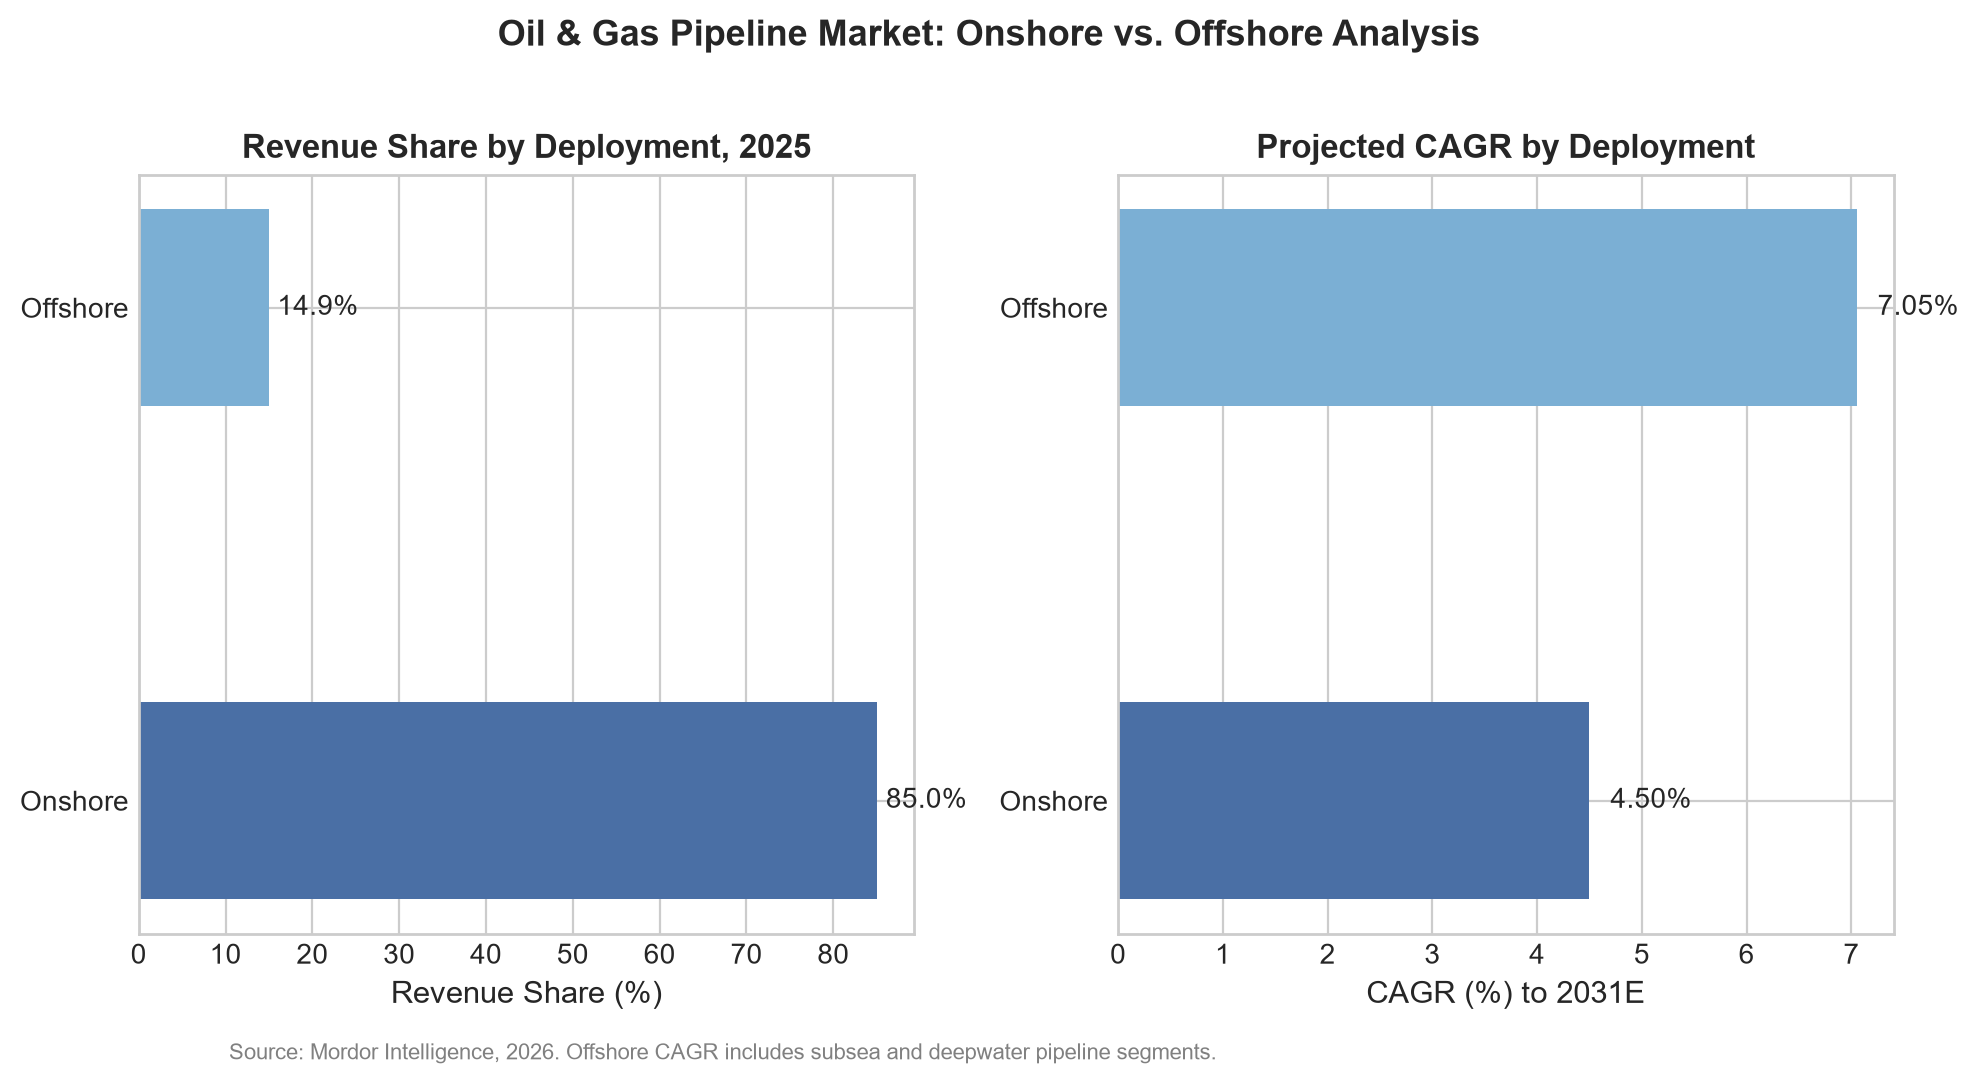
Figure 2: Onshore vs. Offshore Pipeline Revenue Share (2025) and Projected CAGR (to 2031E). Source: Mordor Intelligence, 2026.
3.2 By Pipeline Function
Distribution lines hold the largest share at 58.25% of 2025 revenue, a reflection of the extensive urban and industrial gas distribution networks across Asia, Europe, and North America. Transmission lines -- high-pressure, large-diameter trunk lines carrying hydrocarbons between production hubs and demand centers -- are forecast to expand at the fastest rate (6.38% CAGR to 2031E), driven by new cross-border gas corridors and crude export pipelines. Gathering lines, which connect individual wellheads to processing facilities, are experiencing demand growth tied to horizontal drilling intensity: each new horizontal well typically adds approximately 2.5 miles of gathering pipeline.
|
Function |
2025 Revenue Share |
CAGR to 2031E |
Demand Driver |
|
Distribution Lines |
58.25% |
~4.5% |
Urban gas networks, industrial supply |
|
Transmission Lines |
~27% |
6.38% |
Cross-border corridors, LNG feed lines |
|
Gathering Lines |
~15% |
~5% |
Shale well density, horizontal drilling |
3.3 By End-User Segment
Midstream operators dominate the end-user landscape with 54.85% of 2025 revenue, a structural feature of markets where pipeline transportation is a standalone business regulated separately from production and refining. The midstream share is also growing the fastest (5.28% CAGR to 2031E), reflecting both organic network expansion and M&A-driven consolidation -- ONEOK's USD 18.8 billion acquisition of Magellan Midstream in December 2024 created the largest integrated midstream platform in North America.
4. Regional Market Landscape
4.1 Asia Pacific: The Growth Engine
Asia Pacific commands 34.35% of global oil and gas pipeline revenue in 2025 and is projected to grow at 6.46% CAGR through 2031E -- the fastest among all regions. Three structural factors explain this position. First, India's national gas grid expansion program commits USD 67 billion to build 9,630 miles of new distribution and transmission lines, aiming to raise the share of natural gas in the country's energy mix from 6% to 15% by 2030. Second, China continues to extend its pipeline footprint: the China-Russia Eastern Route natural gas pipeline (5,111 km, with annual capacity of 38 billion cubic meters) became fully operational in December 2024, and the country's refinery runs hit an all-time high of 14.8 million barrels per day in 2023, requiring expanded product pipeline capacity. Third, Southeast Asian nations -- Indonesia, Vietnam, and Malaysia -- are investing in offshore gas export pipelines to monetize deepwater discoveries.
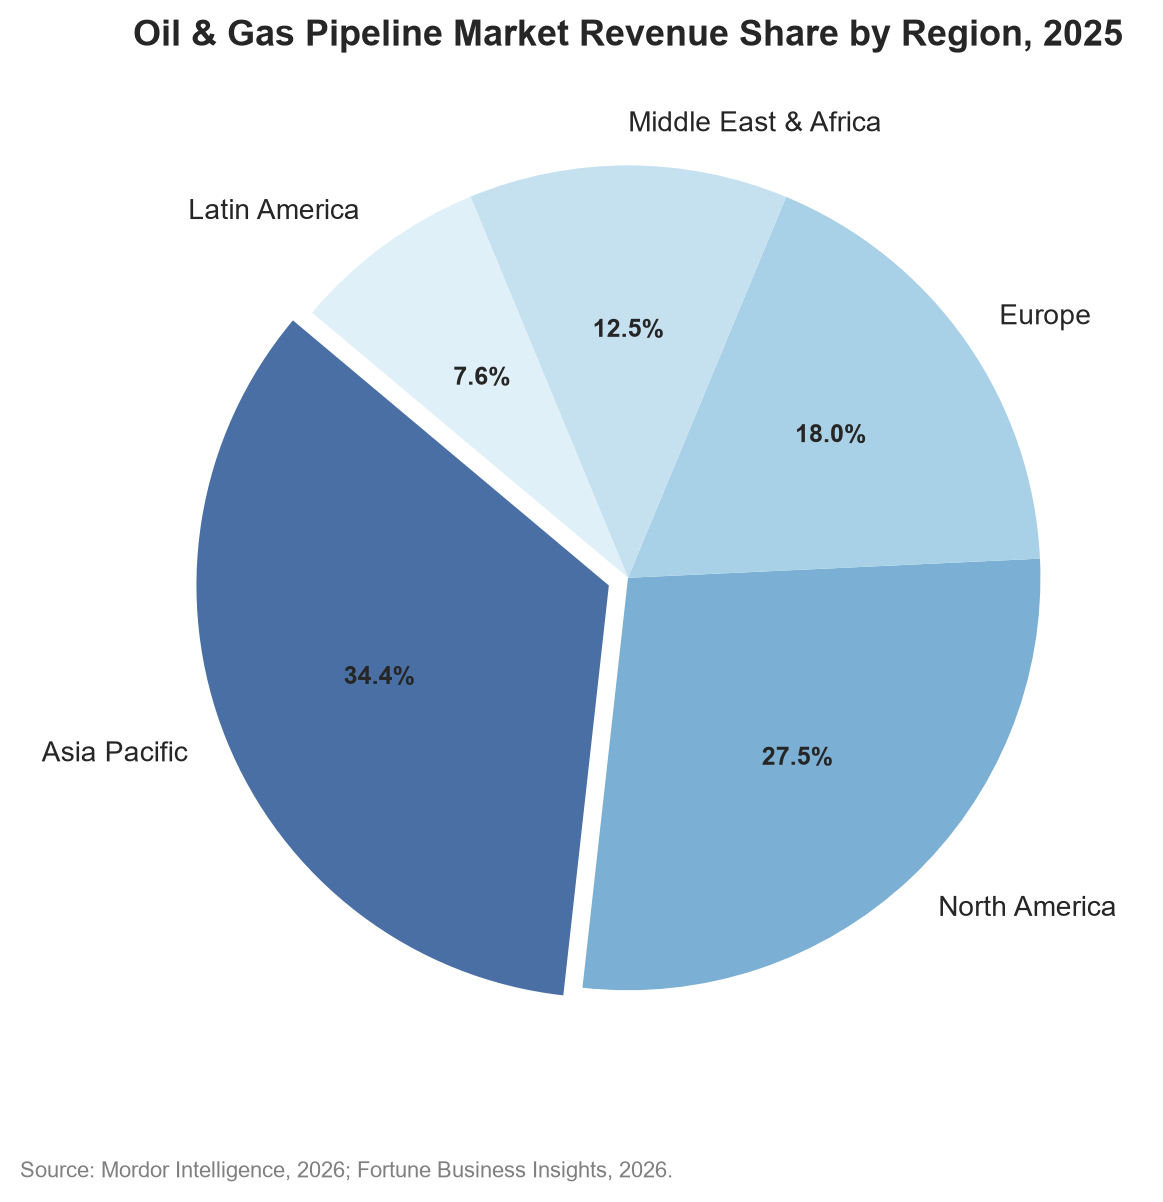
Figure 3: Oil & Gas Pipeline Market Revenue Share by Region, 2025. Source: Mordor Intelligence, 2026; Fortune Business Insights, 2026.
4.2 North America: Shale-Driven Expansion
North America's pipeline market is anchored in Permian Basin takeaway capacity expansion and Gulf Coast LNG export infrastructure. Two major projects completed or approved in 2024-2025 illustrate the scale: Energy Transfer's Warrior Pipeline (USD 6 billion, 200 miles, 42-inch diameter, approved October 2024) and TC Energy's Southeast Gateway Pipeline (USD 4.5 billion, 1.5 Bcf/d capacity, Texas to Florida, completed January 2025). Combined, these projects add 4.1 Bcf/d of Permian gas takeaway, narrowing the Waha basis differential from -USD 2.50/MMBtu to -USD 0.75/MMBtu since early 2024 and reducing regional flaring by 35%.
4.3 Europe: Transition Infrastructure
Europe's pipeline landscape is bifurcating between conventional hydrocarbon infrastructure repurposing and new-build hydrogen-ready networks. Between 2022 and 2026, 433 oil and gas projects were planned to commence operations in Europe, with nearly 55% in the midstream sector. Germany's EUR 18 billion plan to convert 11,200 km of natural gas pipelines to hydrogen service by 2032 is the continent's most ambitious repurposing initiative, while the EU's REPowerEU framework funds cross-border hydrogen corridor development.
4.4 Middle East & Africa and Latin America
The Middle East remains a core supply region where state-owned enterprises -- ADNOC, Saudi Aramco, Kuwait Petroleum, and QatarEnergy -- invest in pipeline capacity to maintain export dominance and reduce GHG intensity. In Africa, the East African Crude Oil Pipeline (EACOP, 1,443 km from Uganda to Tanzania) has attracted both controversy and capital. Latin America's pipeline growth is concentrated in Brazil's pre-salt offshore flowline investments (USD 4.2 billion to 2026) and Argentina's Vaca Muerta shale gas takeaway buildout.
5. Supply Chain and Competitive Landscape
5.1 Key Players and Market Concentration
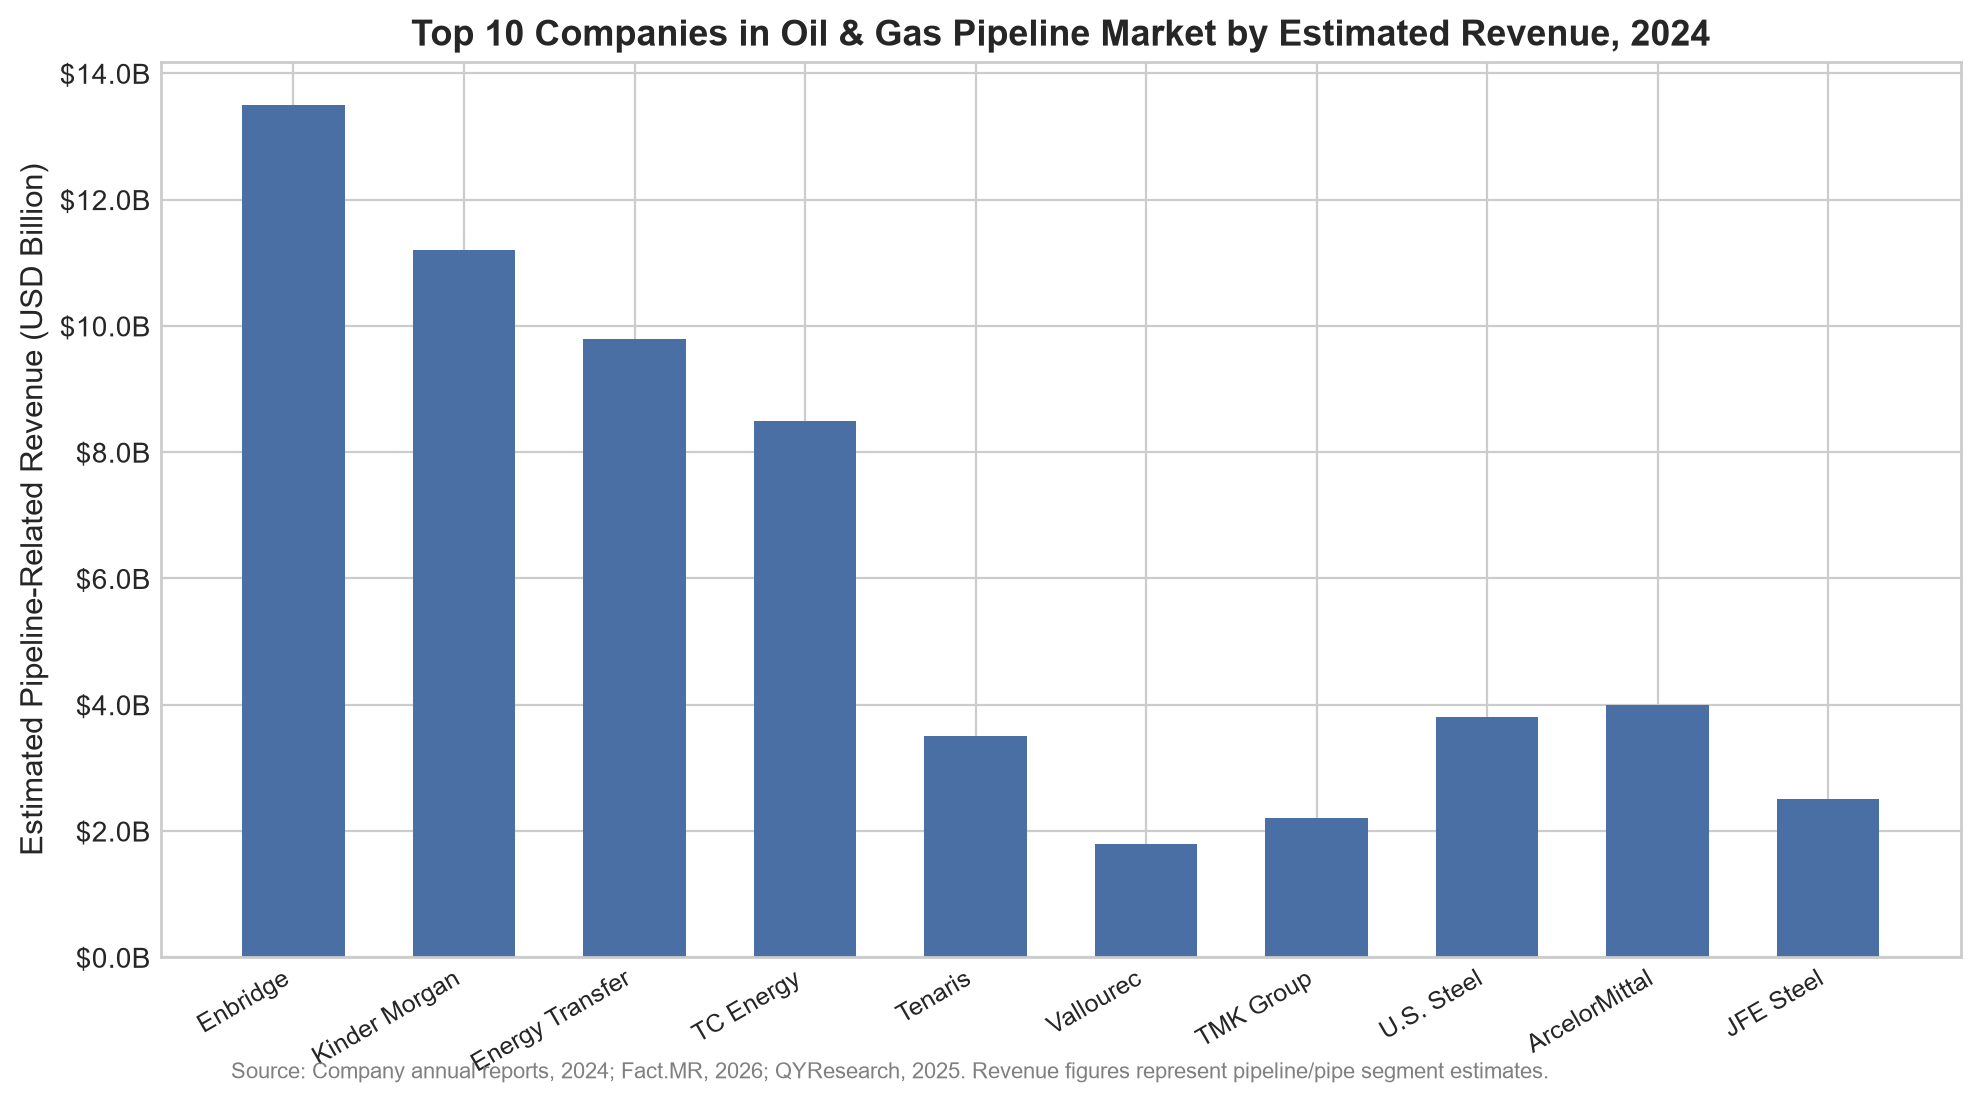
The global oil and gas pipeline market exhibits low formal concentration -- the top five companies control approximately 60% of installed mileage in North America but the global picture is fragmented. The competitive landscape splits into two tiers: midstream operators and pipe/equipment manufacturers.
|
Company |
Headquarters |
Segment |
2024 Est. Revenue (USD Bn) |
Key Differentiator |
|
Enbridge Inc. |
Calgary, Canada |
Midstream operator |
13.5 |
Largest North American pipeline network |
|
Kinder Morgan Inc. |
Houston, USA |
Midstream operator |
11.2 |
AI leak detection over 5,000 miles |
|
Energy Transfer LP |
Dallas, USA |
Midstream operator |
9.8 |
Permian Basin takeaway expansion |
|
TC Energy Corp. |
Calgary, Canada |
Midstream operator |
8.5 |
Cross-border gas/liquids pipelines |
|
Tenaris S.A. |
Luxembourg |
Pipe manufacturer |
3.5 |
22% global premium OCTG share |
|
Vallourec S.A. |
France |
Pipe manufacturer |
1.8 |
VAM connections: 80% ultra-deepwater |
|
TMK Group |
Moscow, Russia |
Pipe manufacturer |
2.2 |
30% Russian pipeline supply |
|
U.S. Steel Corp. |
Pittsburgh, USA |
Pipe manufacturer |
3.8 |
50% NA large-diameter ERW share |
|
ArcelorMittal S.A. |
Luxembourg |
Pipe manufacturer |
4.0 |
LSAW/spiral weld; global supply chain |
|
JFE Steel Corp. |
Tokyo, Japan |
Pipe manufacturer |
2.5 |
1,500m water depth certification |
Table 4: Top 10 Companies, 2024. Sources: Company annual reports; Fact.MR; QYResearch; Chemical Research Insight.
5.2 Pipe Manufacturing Supply Chain
The pipe manufacturing supply chain for oilfield pipelines is defined by three material categories: seamless pipes (dominant in high-pressure, sour-service, and deepwater applications), welded pipes (including ERW, LSAW, and spiral weld variants), and composite/non-metallic pipes (emerging for corrosive flowline applications). The oil-and-gas pipeline steel market was valued at USD 6.07 billion in 2025, projected to reach USD 8.83 billion by 2034E at a 4.2% CAGR (DataIntelo, 2026).
Premium threaded connections -- such as Tenaris's Dopeless technology and Vallourec's VAM 21 series -- command significant price premiums. Pipe fittings (elbows, tees, and flanges) and valves collectively account for an estimated 8-12% of total pipeline CAPEX.
6. Technology Trends and Innovation
6.1 Smart Pipeline Monitoring and Digitalization
The transition from periodic manual inspection to continuous, data-driven integrity management is the most consequential technology shift. The smart pipeline monitoring system market was valued at USD 894 million in 2024, projected to USD 1,232 million by 2031E (CAGR 4.9%, QYResearch). The broader smart pipeline monitoring connectivity market reached USD 5.2 billion in 2024 with a CAGR of 10.7% through 2033E (DataIntelo). Kinder Morgan deployed AI leak detection across 5,000 miles, reducing inspection costs by USD 25 million annually. Enbridge's machine learning investment of USD 45 million/year across 28,000 km achieved 99.8% uptime and reduced unplanned downtime by 40%.
6.2 Pipeline Coatings and Corrosion Protection
The global pipe coatings market was estimated at USD 8.74 billion in 2026, projected to USD 13.65 billion by 2033E (CAGR 6.7%, Coherent Market Insights). FBE dominates with ~40% share; polyurethane is fastest-growing. Multi-layer coating adoption increased 20% annually; offshore usage grew 30% in 2025.
6.3 Advanced Pipe Materials and Hydrogen Readiness
Tenaris opened its USD 1.2 billion Bay City facility in September 2024 -- the first hydrogen-ready seamless pipe plant in the United States. Hydrogen-compatible X70/X80 steel grades carry a 25% price premium. The U.S. DOE allocates USD 8 billion in hydrogen infrastructure grants (40% for pipeline conversion); Germany commits EUR 18 billion for 11,200 km conversion.
6.4 Offshore and Subsea Pipeline Technology
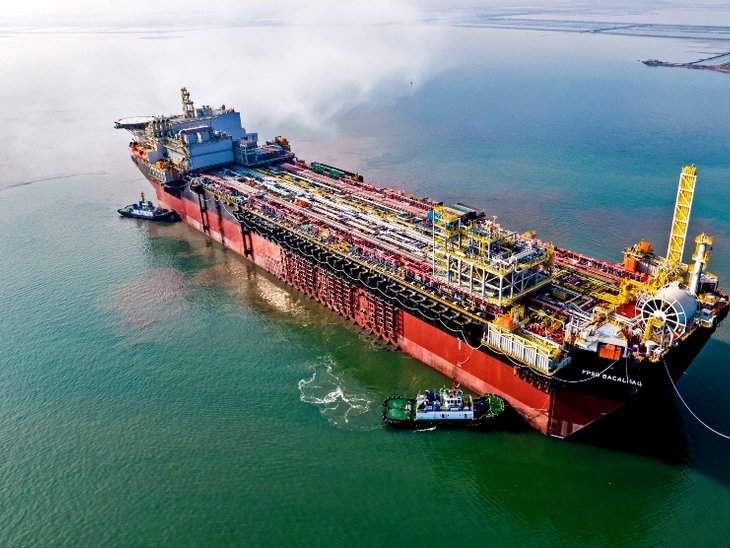
Oilfield equipment for subsea pipeline installation continues to advance. Saipem's USD 2.8 billion Petrobras contract for 180 km of flexible subsea flowlines at 2,000 m water depth exemplifies modern offshore project scale. Brazil's standardized subsea layout reduced per-mile expenditure by 20%; modular reel-lay with automated welding improved weekly installation rates by 12%.
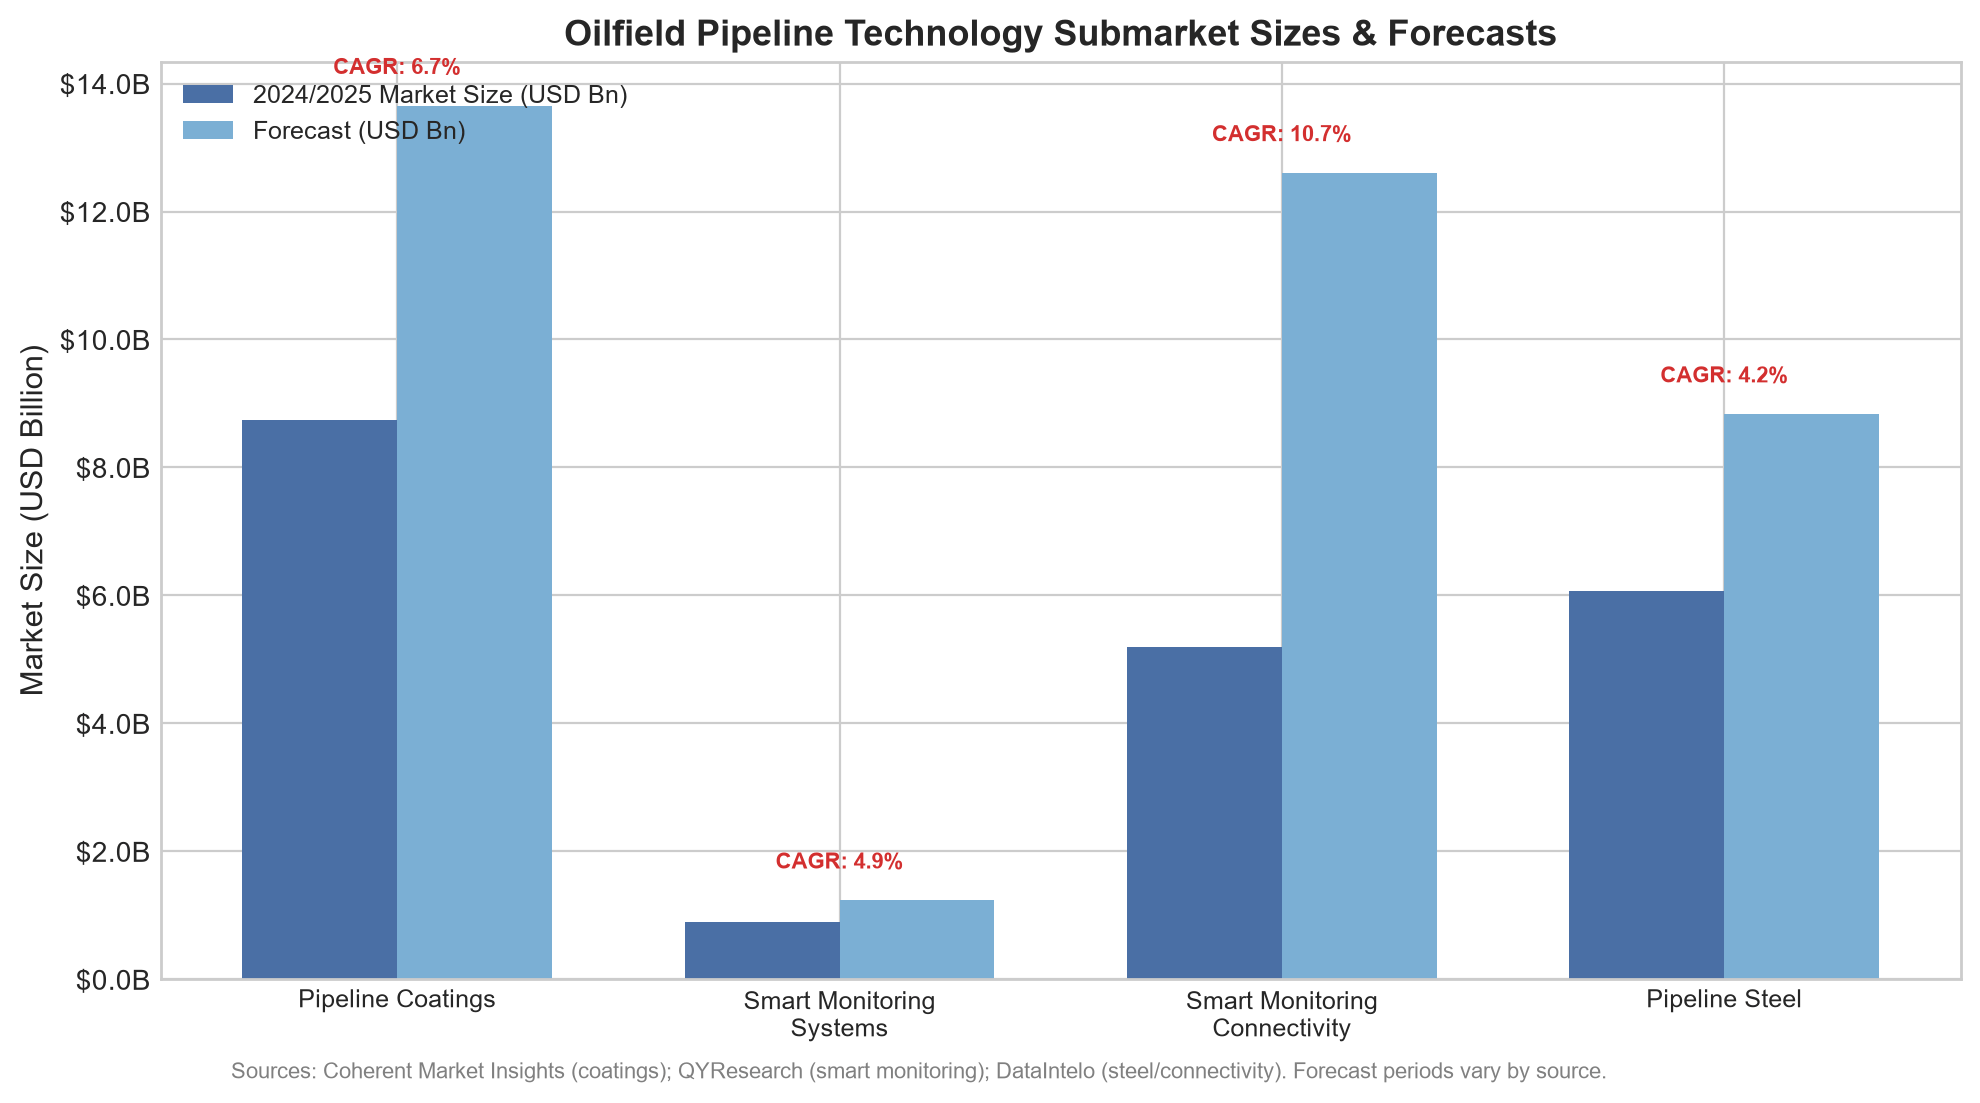
Figure 5: Oilfield Pipeline Technology Submarket Sizes and Forecasts.
Smart monitoring connectivity (10.7% CAGR) and pipeline coatings (6.7% CAGR) expand faster than pipeline steel (4.2% CAGR), reflecting the industry's pivot toward operational intelligence and lifecycle protection over raw material volume growth.
7. Challenges and Risk Factors
7.1 ESG Capital Reallocation
Borrowing costs for pipeline developers have risen 200-300 basis points in Europe and North America. Several European pension funds have excluded pipeline operators. However, hydrogen-ready pipeline conversion attracts the same capital pools, creating a bifurcated investment landscape.
7.2 Cybersecurity Threats
Network insurance premiums rose 150% since 2022; coverage limits declined 40%. Kinder Morgan allocated USD 200 million (~3% of annual CAPEX) to OT security upgrades. The Colonial Pipeline ransomware incident (2021) remains the reference case.
7.3 Raw Material Cost Inflation
Large-diameter steel pipe prices have risen steadily since 2022, creating a CAGR drag of -0.4%. Specialty alloys for hydrogen/sour service carry 25% premiums.
7.4 Regulatory and Permitting Uncertainty
FERC expedited pathways for small-diameter laterals add +0.3% CAGR uplift, but large cross-border projects face multi-year review, litigation, and political reversals.
8. Global Pipeline Infrastructure Overview
The Global Energy Monitor's GOIT (March 2025) catalogs 1,634 oil pipeline projects totaling 487,000 km, plus 292 NGL pipeline projects totaling 11,100 km. Approximately 15,000 km under construction, 27,000 km proposed (16% YoY increase). Asia accounts for over 60% of development activity.
|
Metric |
Value |
Source |
|
Total oil pipeline projects |
1,634 |
Global Energy Monitor, 2025 |
|
Total oil pipeline length |
487,000 km |
Global Energy Monitor, 2025 |
|
Total NGL pipeline projects |
292 |
Global Energy Monitor, 2025 |
|
Total NGL pipeline length |
11,100 km |
Global Energy Monitor, 2025 |
|
Oil pipelines under construction |
~15,000 km |
Global Energy Monitor, 2025 |
|
Oil pipelines proposed |
~27,000 km |
Global Energy Monitor, 2025 |
|
Gas pipelines under construction (2023) |
69,700 km (USD 193.9 Bn) |
Global Gas Infrastructure Tracker |
|
Gas pipelines under development (2023) |
228,700 km (USD 723 Bn) |
Global Gas Infrastructure Tracker |
9. Market Outlook and Forecast
9.1 Near-Term Drivers (2025-2028)
Permian Basin takeaway expansion (+4.1 Bcf/d), Asian gas corridor completions, and North American midstream consolidation (ONEOK-Magellan USD 18.8 Bn) will drive near-term growth.
9.2 Medium-Term Dynamics (2028-2032)
Hydrogen-ready conversion programs (U.S. DOE USD 8 Bn; Germany EUR 18 Bn) and deepwater buildout (Guyana Stabroek, Brazil pre-salt) define the medium-term. Offshore CAGR of 7.05% reflects subsea demand.
9.3 Long-Term Structural Risk
The IEA projects oil demand peaking by 2030, yet pipelines operate for 30-50 years. This creates stranded asset risk for new crude trunk lines. Market participants should favor projects with repurposing potential (hydrogen, CO2 transport) over purely crude-oriented builds.
10. Methodology and Data Sources
Sources: IEA (Oil 2025, World Energy Investment 2025); Global Energy Monitor (GOIT, GGIT); Fortune Business Insights (2026); Mordor Intelligence (2026); DataIntelo (2026); Coherent Market Insights (2026); QYResearch (2025); Fact.MR (2026); Company annual reports (Enbridge, Kinder Morgan, Tenaris, Vallourec, 2024). Where sources differ, range-based estimates with transparent attribution are used. All forecasts labeled (E).
Disclaimer: This report is for informational purposes only and does not constitute investment advice. Market projections are based on publicly available data and subject to revision.
Related Products


MESS8201-2507/5015-BN Prefabricated Liquid-cooled Energy Storage Battery Container
Xuchang Xuji Electric Science Energy Storage Technology Co., Ltd.
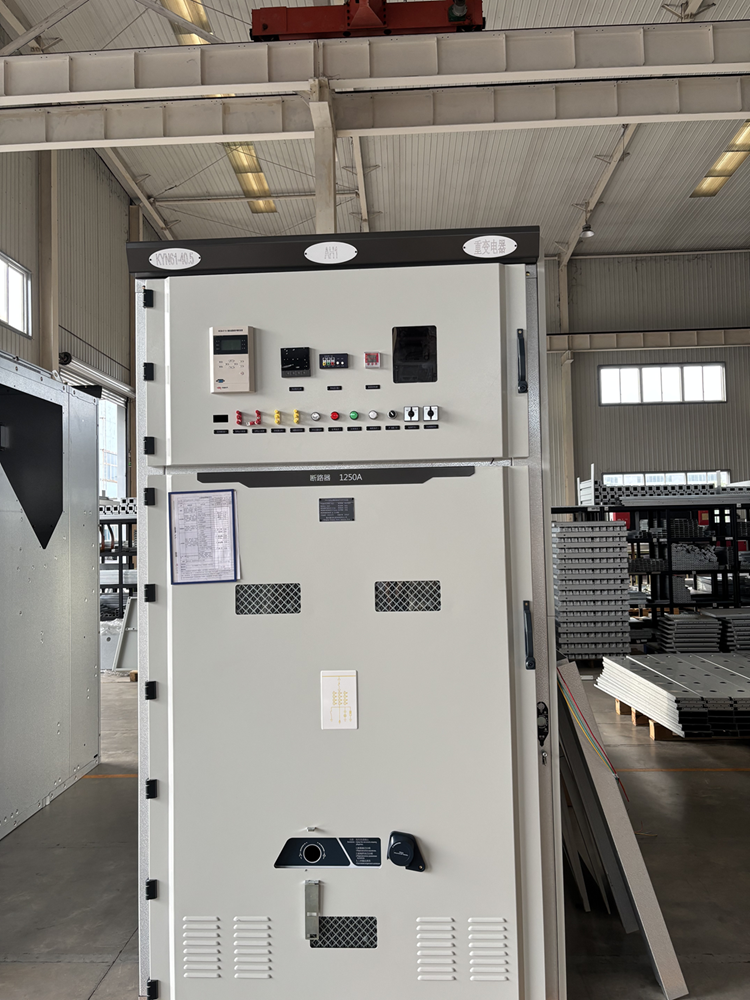
KYN61-40.5 Indoor AC Metal-clad Removable Switchgear
Chongqing Transformer Co., Ltd.
220kV and Below Voltage Level Energy-saving Oil-immersed Power Transformers
FuZhou TianYu Electric Co., Ltd.
Forest and Grassland Heat Source Infrared Monitor
China Huayun Meteorological Technology Group Co., Ltd.
0.66kV Power Supply Instrument Transformer
Guangdong Sihui Instrument Transformer Works Co., Ltd.
Rated Voltage 6-35kV Cross-linked Polyethylene Insulated Power Cable
TONGDING INTERCONNECTION INFORMATION CO., LTD.