Executive Summary
The global power distribution cabinet market — encompassing low-voltage distribution panels, medium-voltage switchgear assemblies, and high-voltage switch cabinets — has entered a decisive phase of structural transformation. Valued at an estimated USD 37.5–38.8 billion in 2024–2025 as a segment within the broader USD 99.7–107.3 billion switchgear industry, this market is projected to reach approximately USD 50.5 billion by 2030, driven by grid modernization programs, renewable energy integration, and the exponential growth of data center infrastructure.
Three forces are reshaping competitive dynamics simultaneously. First, Power Distribution Equipment demand is being pulled by a worldwide wave of electricity infrastructure investment — the IEA estimates that global grid investment needs to nearly double to over USD 600 billion annually by 2030, and distribution cabinets sit at the center of this spending surge. Second, the regulatory assault on SF6 gas — with a global warming potential 23,500 times that of CO₂ — is forcing manufacturers to redesign insulation systems from scratch, creating both opportunity and disruption. Third, digitalization is moving from optional add-on to core requirement: IoT-enabled monitoring, predictive maintenance, and AI-driven fault detection are becoming standard specifications in utility and industrial tenders.
Asia Pacific dominates with approximately 44.6% of global demand, anchored by China's sustained grid investment (CNY 608.3 billion in 2024, +15.3% YoY) and India's electrification push. Europe follows at 23.3%, driven by SF6 phase-out mandates and smart grid deployment, while North America at 20.2% is experiencing the fastest growth in digital and eco-friendly cabinet solutions. The competitive landscape remains consolidated at the top — ABB, Siemens, and Schneider Electric collectively hold roughly 49% of the global market — but Chinese manufacturers such as CHINT Group and Pinggao Group are expanding their share in both domestic and international markets.
1. Market Size & Forecast
The power distribution cabinet market does not exist as a standalone category in most industry research databases. It is a subsegment of the broader switchgear industry, which includes circuit breakers, disconnectors, contactors, and relay protection systems alongside the cabinet assemblies that house them. Cross-referencing data from multiple sources reveals a consistent picture: the distribution cabinet segment accounts for approximately 35–40% of the total switchgear market by revenue.
Table 1 below compares market size estimates from five independent research institutions, illustrating both the consensus trend and the variation in statistical scope.
|
Source |
Switchgear Market (2024) |
Projected (2030) |
CAGR |
Scope/Notes |
|
MarketsandMarkets |
USD 99.7 Bn |
USD 136.6 Bn |
5.7% |
All voltage, all insulation types |
|
PSMarket Research |
USD 99.7 Bn |
USD 162.9 Bn |
6.5% |
Global, 2025–2032 forecast |
|
Grand View Research |
USD 107.3 Bn |
USD 160.1 Bn |
7.2% |
Low-voltage emphasis, North America focus |
|
PMarketing Research |
USD 136.3 Bn (2024) |
USD 207.3 Bn (2032) |
5.48% |
High & low voltage switch cabinets |
|
Growth Market Reports |
USD 42.0 Bn (LV only, 2024) |
USD 84.3 Bn (2032) |
~8% |
Low voltage switchgear only |
Source: MarketsandMarkets, PSMarket Research, Grand View Research, PMarketing Research, Growth Market Reports. Note: different scopes (voltage ranges, regional coverage, inclusion/exclusion of components) account for the variation. The distribution cabinet segment is estimated at USD 37.5–38.8 Bn in 2024, representing ~35–40% of the broader switchgear market.
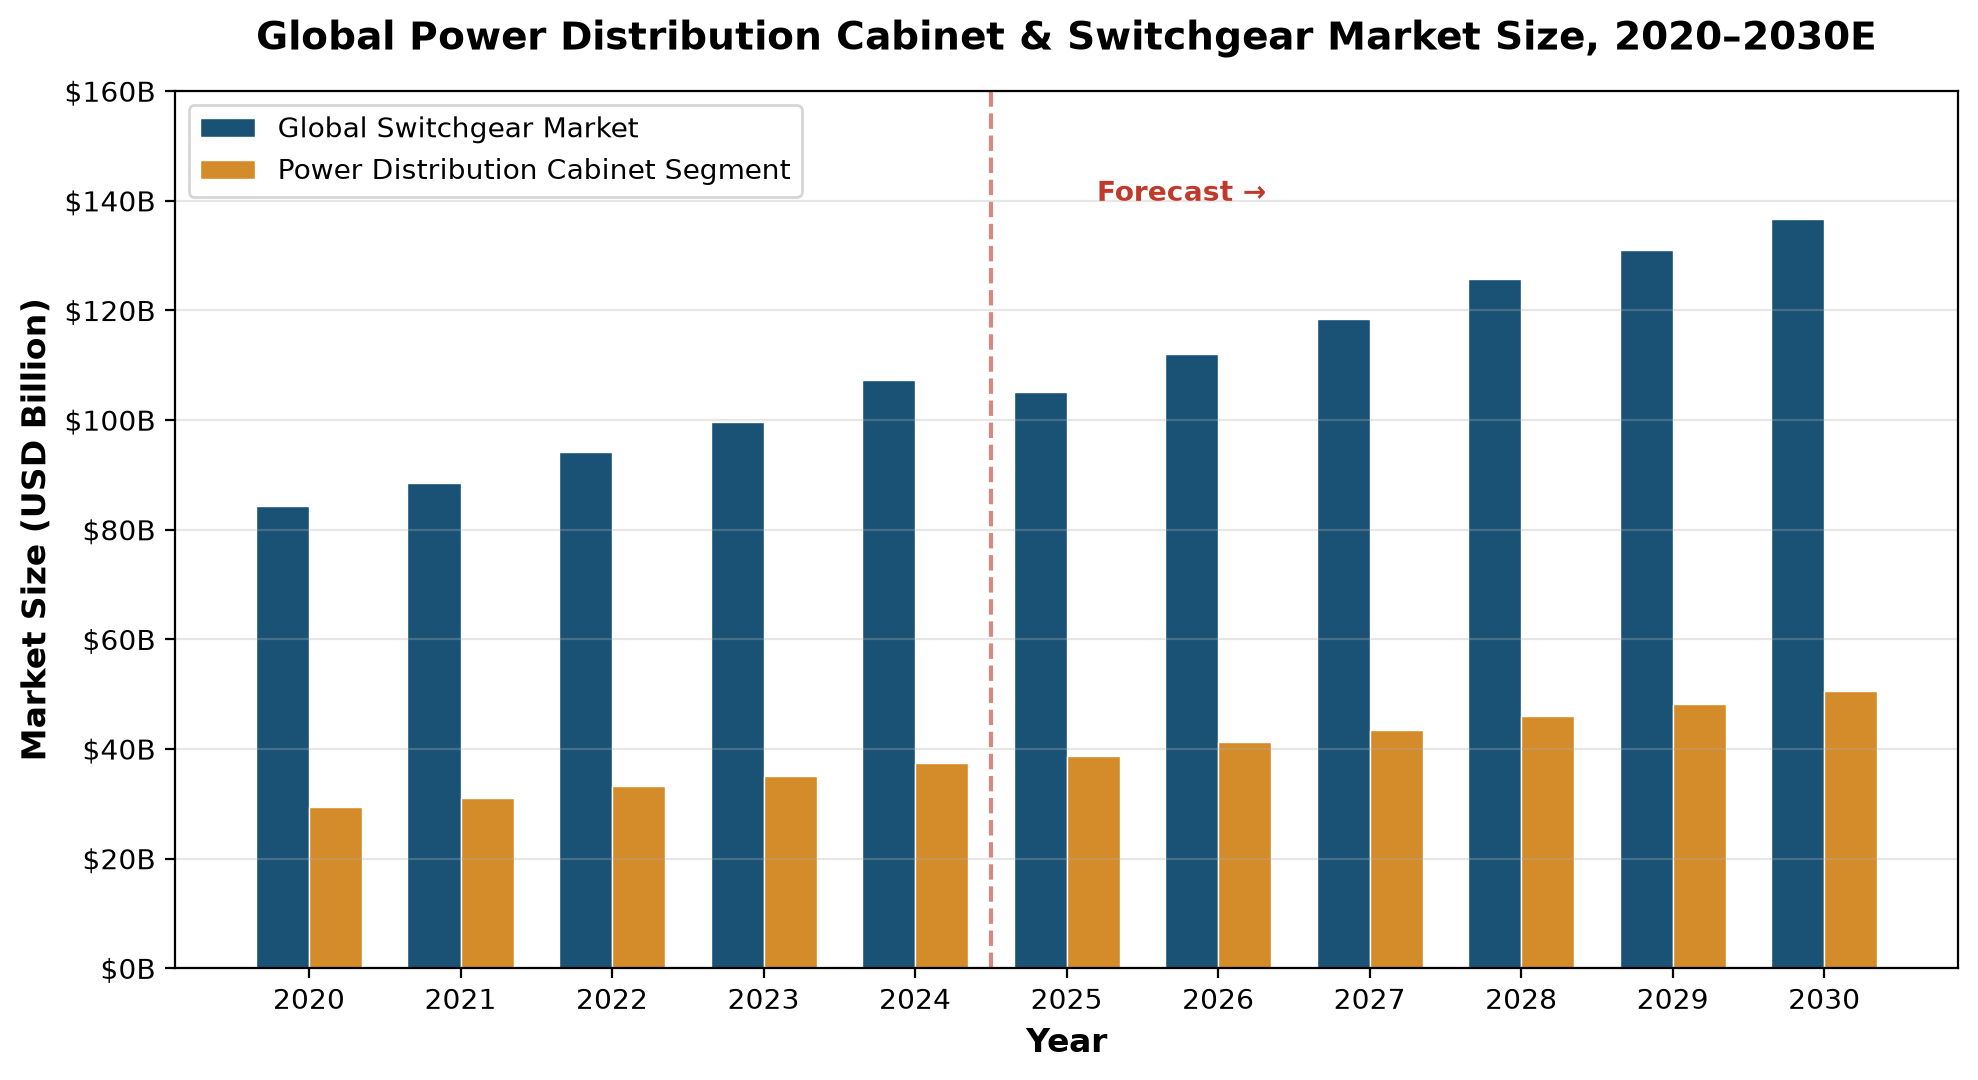
Figure 1: Global Switchgear and Power Distribution Cabinet Market Size, 2020–2030E. Sources: MarketsandMarkets, PSMarket Research, PMarketing Research. Distribution cabinet segment estimated at 35–40% of total switchgear.
The data reveals two important patterns. First, the market's growth trajectory is steady rather than explosive — CAGR estimates cluster around 5.5–7.2%, reflecting the reality that distribution infrastructure investment is a long-cycle, project-driven business, not a consumer-tech growth curve. Second, the low-voltage segment (below 1 kV) is both the largest and the fastest-growing within the cabinet space, driven by commercial building construction, industrial electrification, and the proliferation of data centers requiring sophisticated power distribution architecture.
2. Regional Market Analysis
Regional demand for power distribution cabinets mirrors the geography of electricity infrastructure investment — where grids are being built, upgraded, or digitized, cabinet demand follows. The dominance hierarchy is clear: Asia Pacific leads, Europe and North America follow, and emerging markets in the Middle East, Africa, and Latin America represent incremental growth opportunities.
|
Region |
Est. Market Size (2025) |
Global Share |
CAGR (2025–2032) |
Key Drivers |
|
Asia Pacific |
USD 17.3 Bn |
44.6% |
7.5% |
Grid expansion (China, India), industrial electrification, renewable integration |
|
Europe |
USD 9.0 Bn |
23.3% |
5.8% |
SF6 phase-out, smart grid, aging asset replacement |
|
North America |
USD 7.9 Bn |
20.2% |
10.1% |
Grid resilience, data center boom, renewable integration |
|
Middle East & Africa |
USD 2.9 Bn |
7.5% |
5.1% |
Urbanization, oil & gas diversification, desalination plants |
|
Latin America |
USD 1.7 Bn |
4.4% |
6.2% |
Mining electrification, grid extension, Brazil infrastructure |
|
Global Total |
USD 38.8 Bn |
100% |
~6.5% |
Grid modernization + digitalization + SF6 replacement |
Source: PMarketing Research, PSMarket Research, Growth Market Reports, IEA. Market size figures represent the distribution cabinet segment (35–40% of broader switchgear market). CAGR figures are weighted estimates from cross-referenced sources.
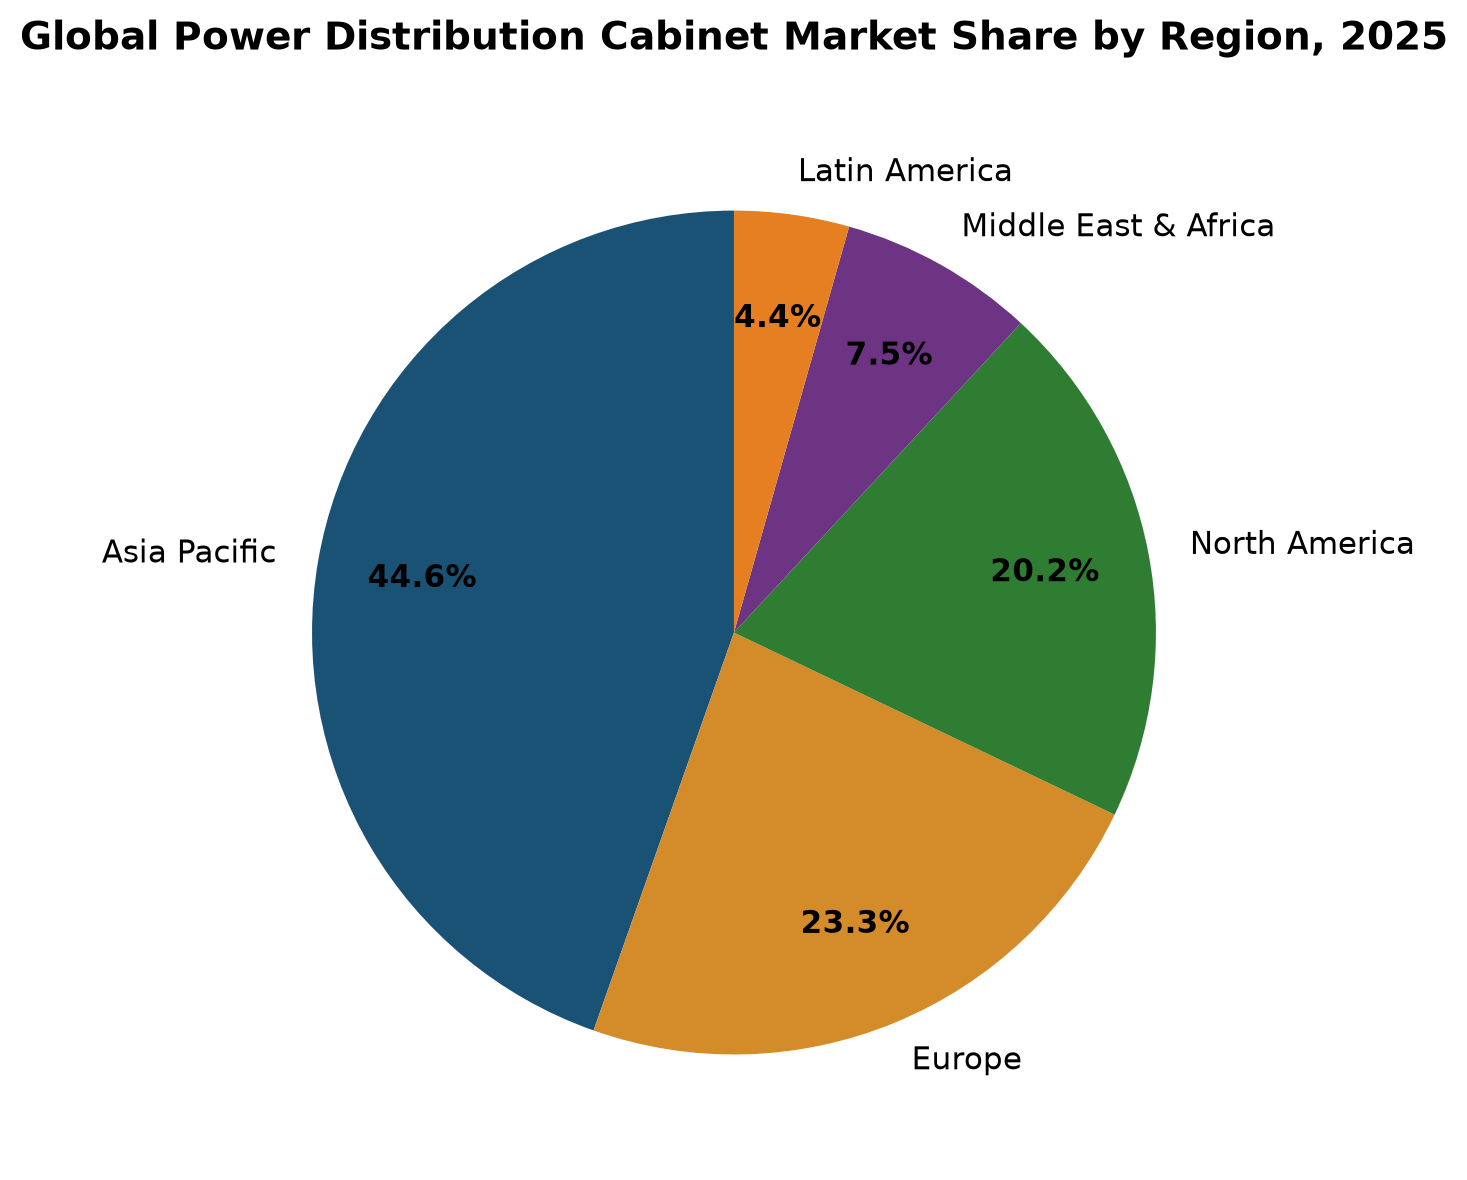
Figure 2: Power Distribution Cabinet Market Share by Region, 2025. Source: PMarketing Research, cross-referenced with PSMarket and Growth Market Reports.
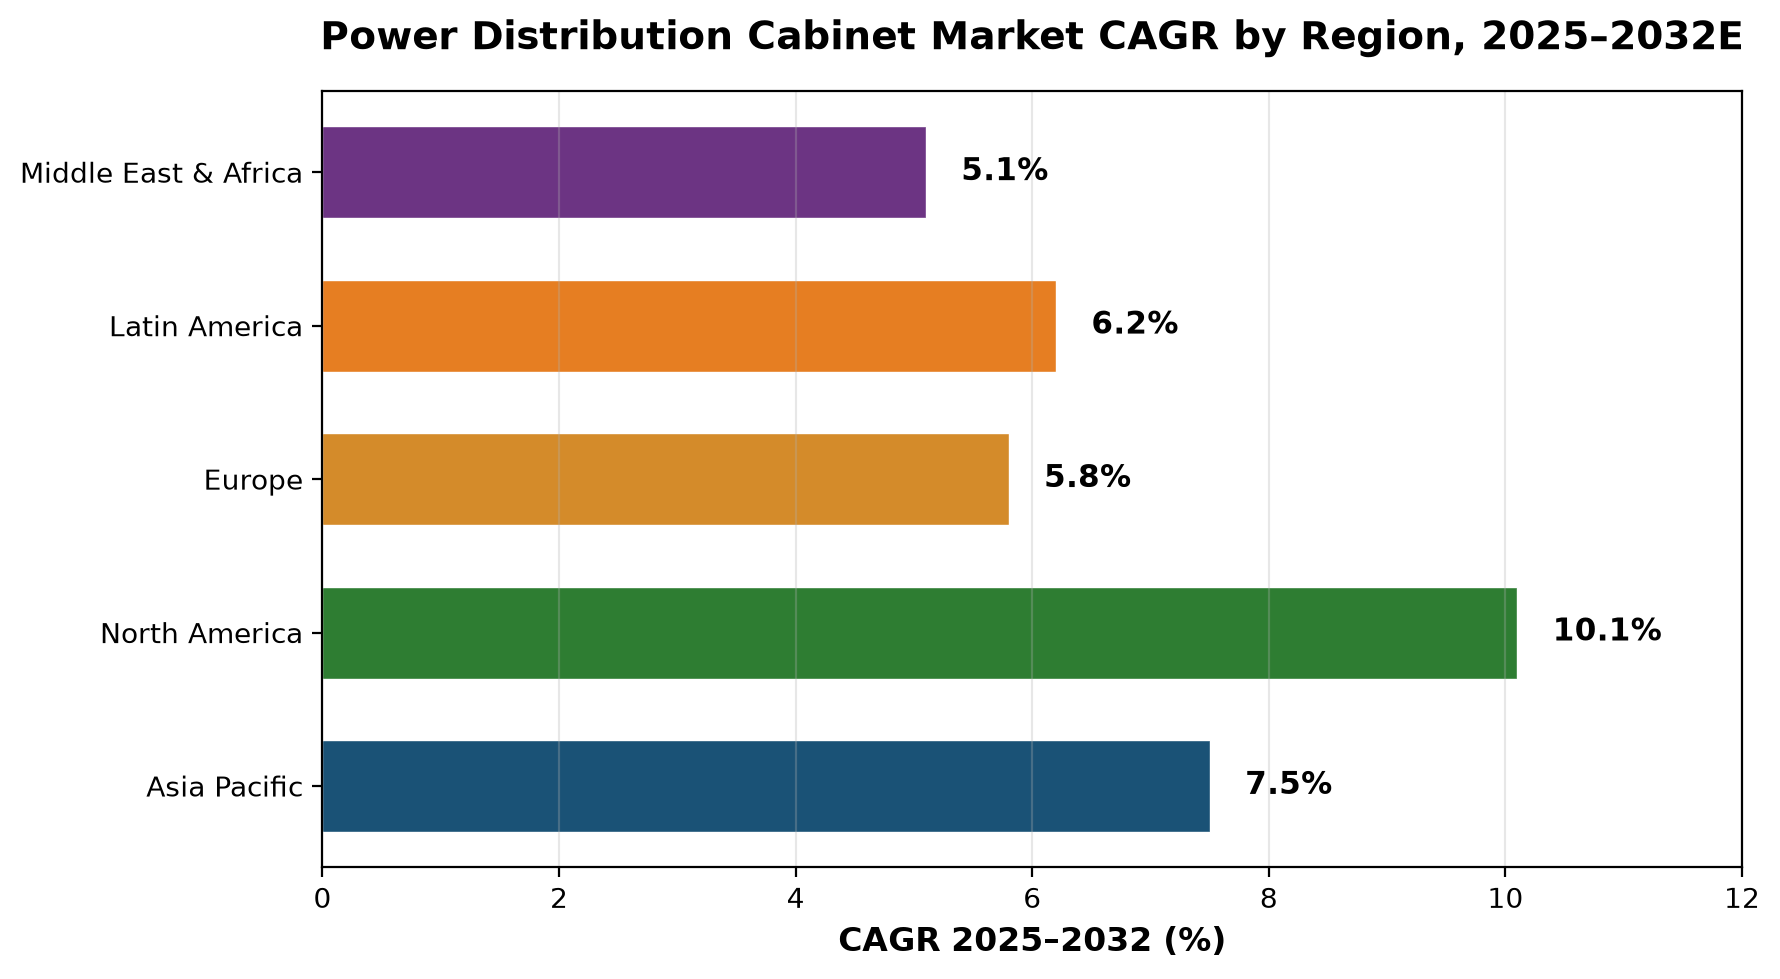
Figure 3: Projected CAGR by Region, 2025–2032E. North America's 10.1% rate reflects accelerating data center and grid resilience investment. Source: SNS Insider, Growth Market Reports.
Asia Pacific's dominance rests on three pillars: China's sustained grid capital expenditure (CNY 608.3 billion in 2024, per National Energy Administration data), India's ongoing electrification of rural and peri-urban populations, and the rapid industrial expansion across Southeast Asia. Within the region, Distribution Boxes and low-voltage cabinet demand is particularly strong in commercial and residential construction, while medium-voltage ring main units (RMUs) and switch cabinets dominate utility procurement.
Europe presents a different structural dynamic. The EU F-Gas Regulation and national SF6 phase-out timelines — targeting a ban on new SF6-containing switchgear by 2035 in several member states — are creating a forced replacement cycle that benefits manufacturers with eco-friendly alternatives ready for deployment. Schneider Electric's AirSeT (dry air insulation), Siemens' 8DJH (C5-FK mixture), and ABB's SafeAir (g³ gas) are already in commercial deployment with thousands of installed units.
North America's growth acceleration is notable. The region's CAGR of 10.1% — the highest globally — reflects the convergence of aging grid replacement (average US power infrastructure is over 40 years old), data center construction at unprecedented scale (Microsoft, Amazon, Google, Meta collectively investing hundreds of billions), and the Bipartisan Infrastructure Law's USD 65 billion allocation for grid modernization.
3. Competitive Landscape
The power distribution cabinet market is concentrated at the top and fragmented in the middle. The three largest global players — Siemens (~18%), ABB (~17%), and Schneider Electric (~14%) — collectively control approximately 49% of worldwide revenue. Below them, a second tier of multinational and regional specialists compete for project-specific contracts, custom-engineered solutions, and niche applications.
|
Company |
HQ Country |
Est. Market Share |
Key Products |
Strategic Focus |
|
Siemens AG |
Germany |
~18% |
8DJH RMU, NXAIR, SIVACON |
SF6-free, digital twins, IoT integration |
|
ABB Ltd. |
Switzerland |
~17% |
SafeAir, UniGear ZS1, Emax 2 |
g³ insulation, AI-driven monitoring, service business |
|
Schneider Electric |
France |
~14% |
PrismaSeT, AirSeT, EcoStruxure |
Dry air insulation, smart building platforms, sustainability |
|
Eaton Corporation |
Ireland/US |
~5% |
Power Xpert, xEnergy |
Data center focus, energy efficiency, predictive analytics |
|
Mitsubishi Electric |
Japan |
~4% |
MVS, LVS series |
High-voltage GIS, Japanese utility market dominance |
|
Hitachi Energy |
Japan/Swiss |
~3.5% |
OES, SafeGuard |
HVDC switchgear, eco-design, grid resilience |
|
CHINT Group |
China |
~3% |
NXA, NM1, low-voltage cabinets |
China domestic dominance, cost leadership, Belt & Road exports |
|
Powell Industries |
US |
~2.5% |
Custom E-house, MV switchgear |
Oil & gas, data center custom solutions |
|
Hyosung Heavy Industries |
South Korea |
~2% |
MV/LV switchgear |
Korean utility market, ASEAN expansion |
|
Toshiba Corporation |
Japan |
~1.5% |
TOSwitch, GIS |
High-voltage GIS, Japanese market, smart grid R&D |
|
Others (regional/local) |
Various |
~24.5% |
Local standards-compliant cabinets |
Regional project supply, price competition |
Source: IndustryResearch.biz, QYResearch, company annual reports, industry expert interviews. Market share figures are estimates for the combined switchgear + distribution cabinet market; individual company rankings vary by voltage segment and region.
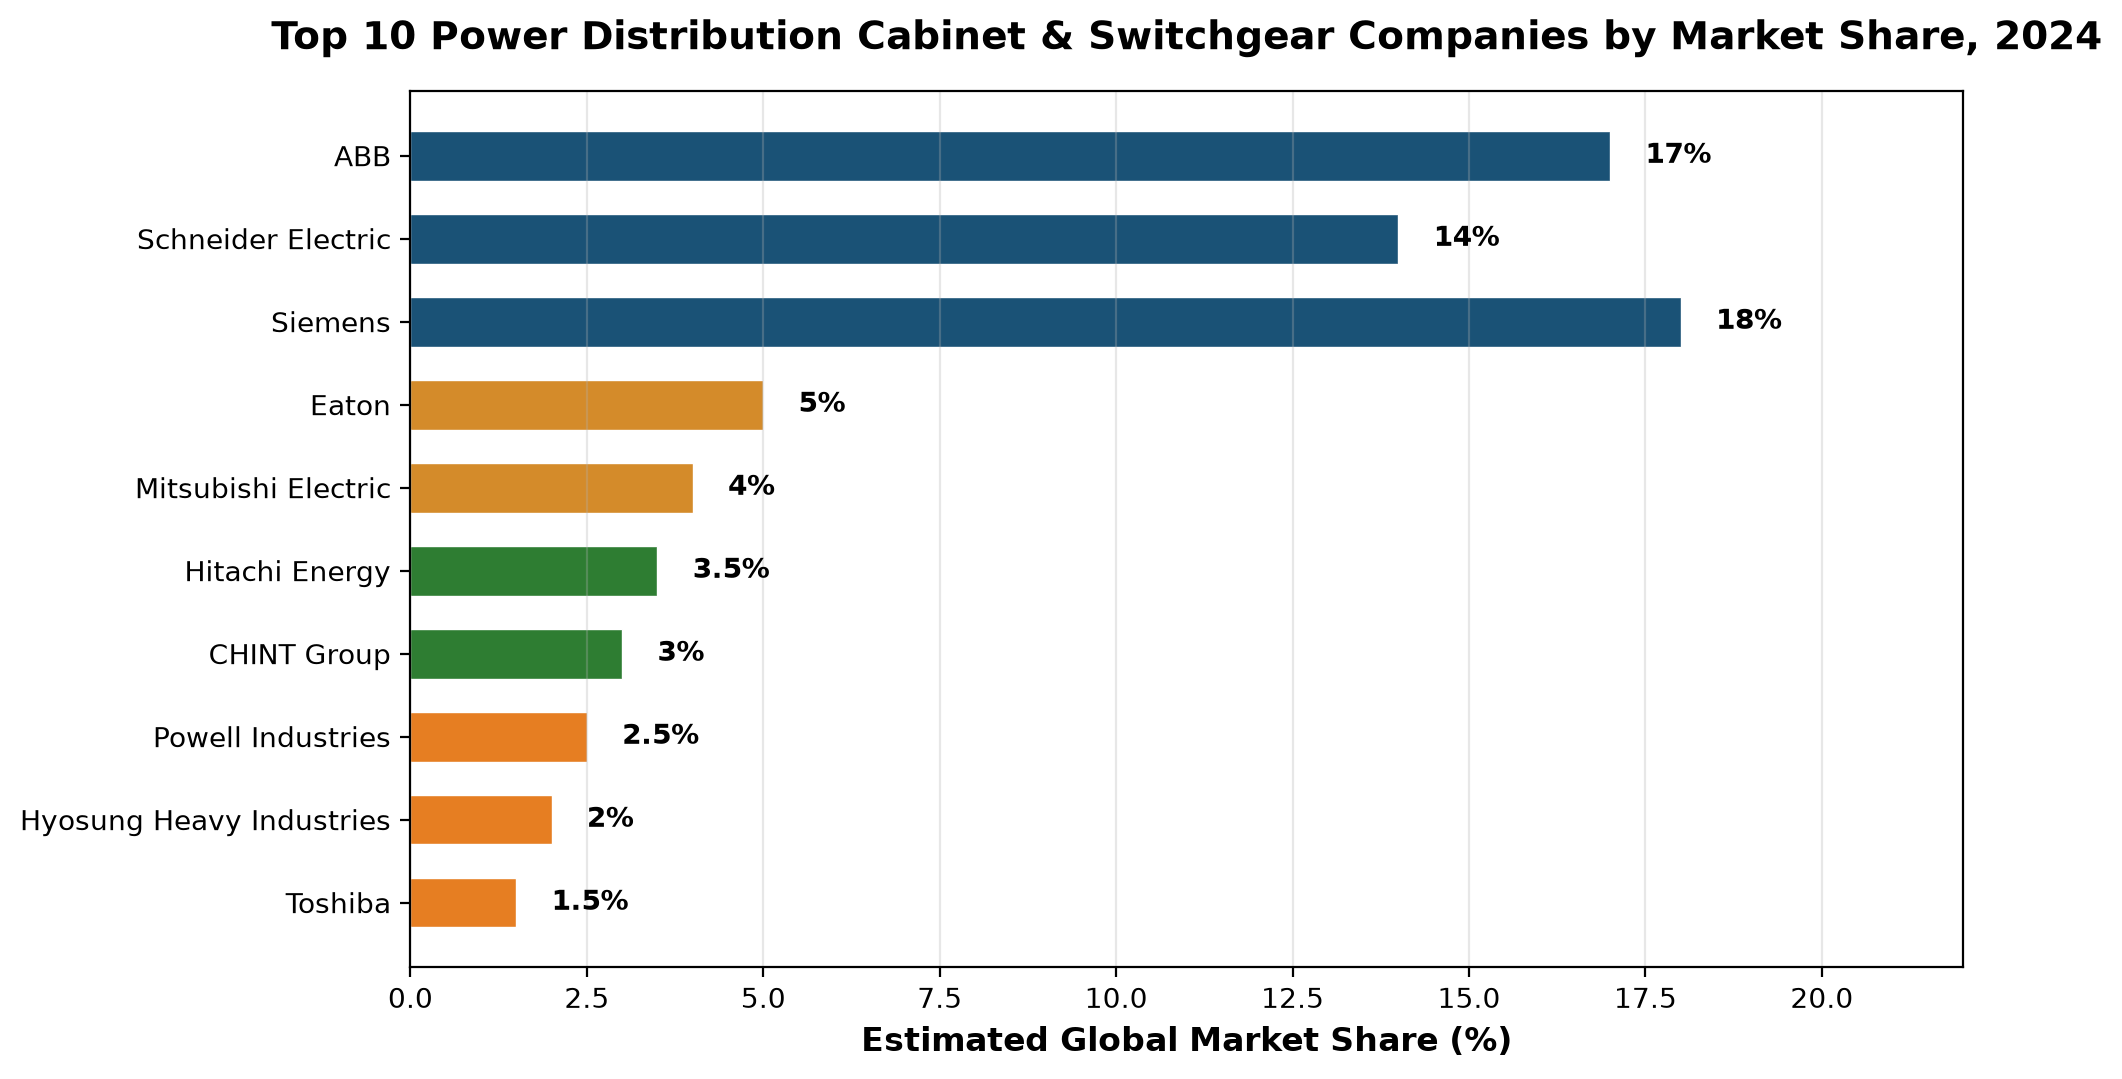
Figure 4: Top 10 Companies by Estimated Global Market Share, 2024. Source: IndustryResearch.biz, QYResearch, PMarketing Research.
The competitive dynamics in the switchgear and distribution cabinet space are defined by a technology bifurcation. Companies that have invested early in SF6-free alternatives and digital monitoring platforms — Siemens, Schneider, ABB — are capturing premium project specifications in Europe and North America. Meanwhile, Chinese manufacturers like CHINT and Pinggao Group are leveraging cost advantages and domestic scale to dominate volume procurement in Asia Pacific, while gradually expanding into Belt & Road infrastructure projects in Southeast Asia, the Middle East, and Africa.
A notable trend is the service-and-softwareification of the business model. ABB, Schneider, and Siemens are increasingly bundling hardware sales with cloud-based monitoring subscriptions, predictive maintenance contracts, and digital twin services. This shifts the revenue model from one-time equipment sales to recurring service income, with higher margins and deeper customer lock-in.
4. Demand Drivers & Application Segments
Power distribution cabinet demand is not driven by a single end-use sector. It is pulled simultaneously by grid investment, industrial electrification, commercial construction, data center expansion, and renewable energy integration — each with distinct technical specifications, procurement patterns, and growth trajectories.
|
Application Segment |
Est. Share (2024) |
Est. Share (2030E) |
Trend Commentary |
|
Transmission & Distribution Utilities |
42% |
38% |
Still dominant but declining share as data centers and renewables grow faster |
|
Industrial (Manufacturing, Oil & Gas, Mining) |
24% |
22% |
Steady demand; electrification of process industries drives upgrade cycles |
|
Commercial Buildings & Infrastructure |
14% |
13% |
Smart building mandates push toward intelligent distribution panels |
|
Data Centers & Hyperscale Facilities |
7% |
12% |
Fastest-growing segment; requires high-reliability, ATS-integrated cabinets |
|
Residential & Light Commercial |
8% |
8% |
Volume-driven, price-sensitive; modular designs gaining traction |
|
Renewable Energy (Solar, Wind, Storage) |
5% |
7% |
Growing as renewable penetration increases; custom switchgear for inverters |
Source: MarketsandMarkets, PSMarket Research, SNS Insider, IEA. Shares are estimated for the distribution cabinet segment within the broader switchgear market.
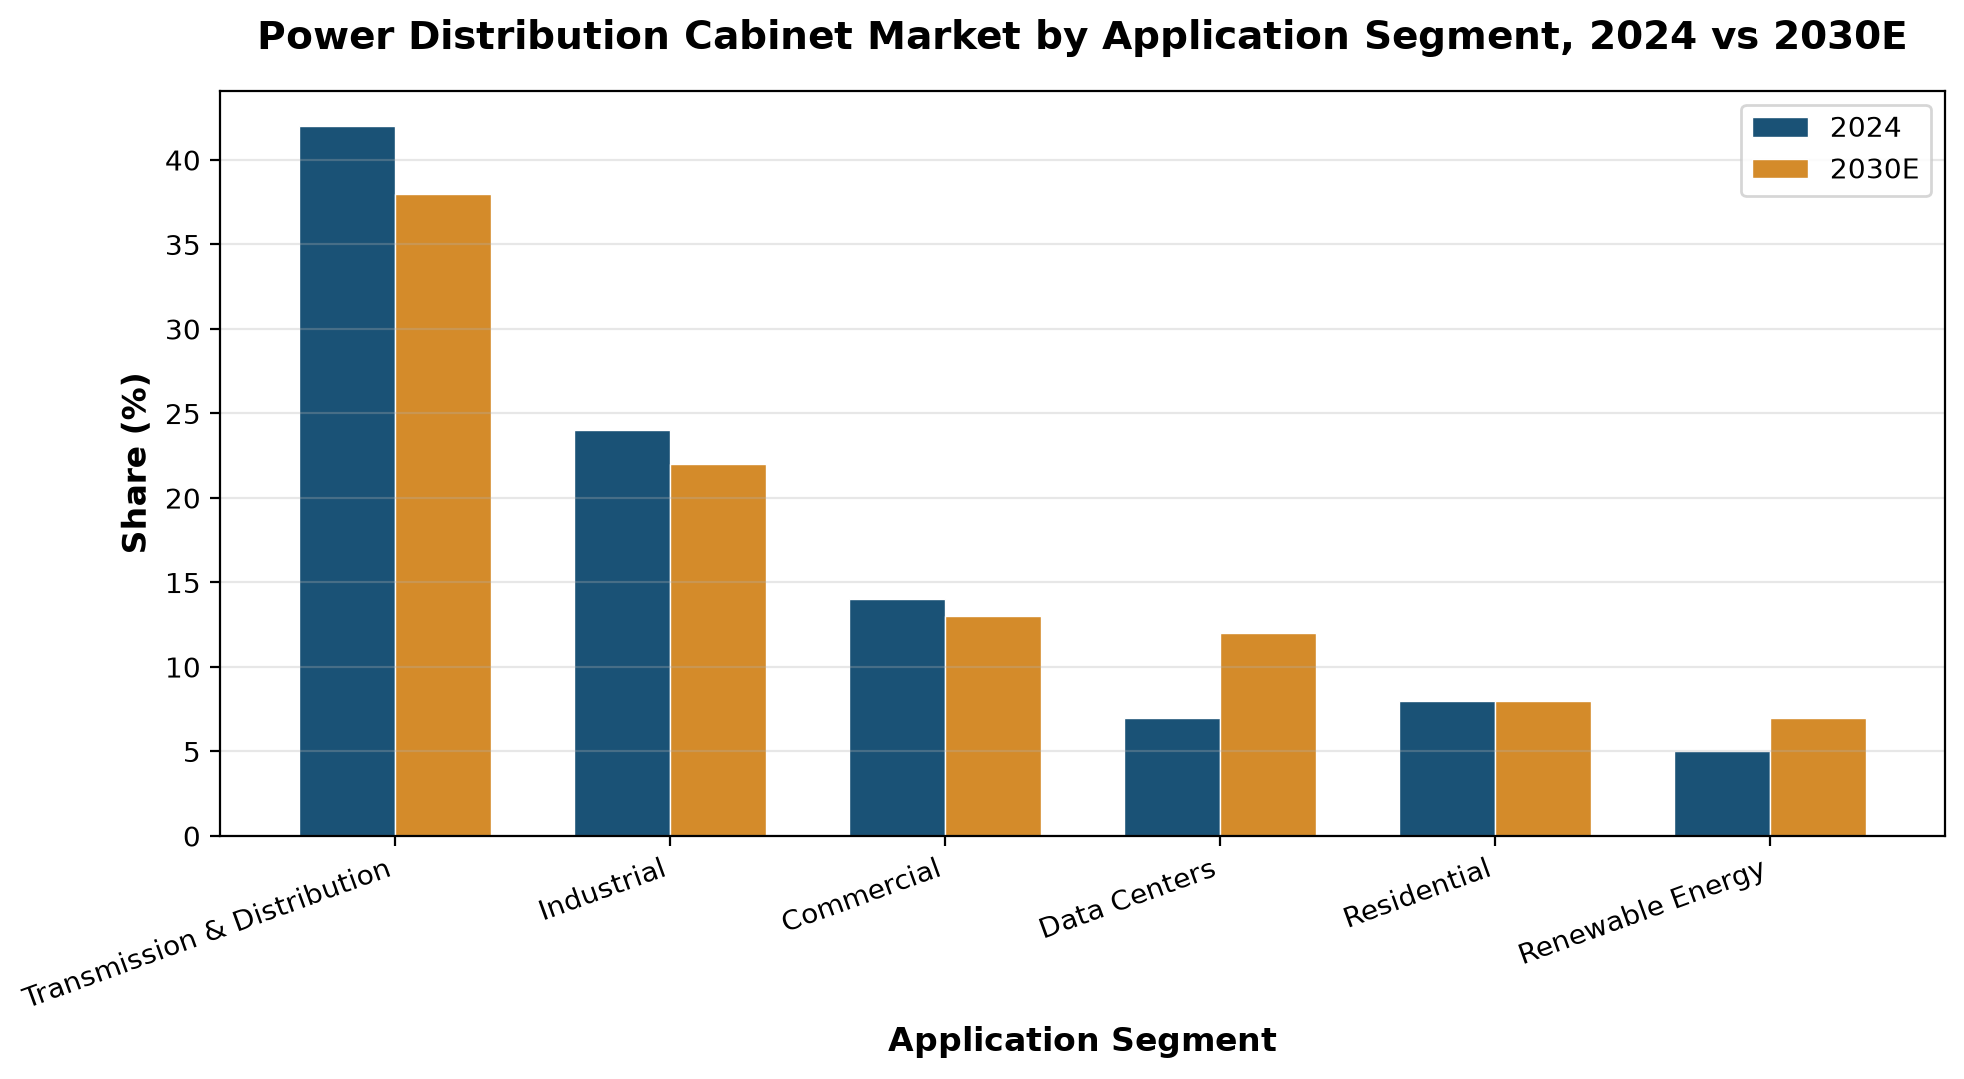
Figure 5: Application Segment Share, 2024 vs 2030E. The data center segment's share is projected to nearly double from 7% to 12%, driven by hyperscale facility construction. Source: MarketsandMarkets, PSMarket Research.
Grid modernization remains the single largest demand channel, but its relative share is declining as other segments accelerate. Utilities worldwide are investing in distribution automation, High and Low Voltage Switchgear replacement, and smart grid deployment — all of which require new cabinet assemblies with integrated monitoring and communication capabilities. The IEA's estimate that global grid investment must approach USD 600 billion annually by 2030 to meet electrification and renewable integration targets underscores the scale of this demand pipeline.
Data centers represent the most dynamic growth vector. IEA data projects global data center electricity consumption rising from approximately 485 TWh in 2025 to 950 TWh by 2030, and each facility requires sophisticated power distribution architecture — including ATS (automatic transfer switch) panels, UPS-integrated distribution boards, busway systems, and intelligent monitoring cabinets. The hyperscale operators (AWS, Azure, Google Cloud, Meta) are now specifying custom-designed distribution systems with real-time power quality monitoring and predictive failure analytics, creating a premium subsegment that grows faster than the market average.
Renewable energy integration is a structurally important but numerically smaller driver. Solar farms, wind installations, and battery storage systems require specialized switchgear for inverter interfacing, grid connection, and protection — often in outdoor or harsh-environment configurations. As renewable penetration exceeds 30% in several European markets, the demand for distribution cabinets that handle bidirectional power flows and fluctuating loads is accelerating.
5. Supply Chain & Value Chain Analysis
The power distribution cabinet supply chain is materially intensive and capital heavy. Raw materials — copper, steel, insulation compounds, and electrical components — account for 60–70% of total manufacturing cost, and their price volatility directly compresses manufacturer margins.
|
Value Chain Component |
Cost Share |
Supplier Dynamics |
Risk/Opportunity |
|
Copper & Busbars |
35% |
Concentrated: Codelco, Glencore, Jiangxi Copper; prices volatile (USD 8,200–9,800/ton in 2023) |
Aluminum substitution rising (19% of busbars by 2025); hedging strategies critical |
|
Electrical Components (Breakers, Relays, Contactors) |
25% |
Oligopolistic: ABB, Schneider, Eaton dominate high-end; Chinese brands compete in mid-range |
Smart components growing 3pp/year; chip supply constraints easing but high-end ICs still tight |
|
Steel & Enclosures |
15% |
Regional: Turkish, Korean, Mexican steel gaining share in EU/US; China cuts affecting supply |
Galvanized sheet lead times doubled from 6 to 14 weeks in EU (2024); nearshoring trend |
|
Insulation Materials |
10% |
Specialized: DuPont, 3M for epoxy resin; SF6 alternatives emerging (C5-FK, g³, dry air) |
Eco-material mandates creating premium pricing; solid insulation technology maturing |
|
Smart Sensors & IoT Modules |
8% |
Emerging: embedded in cabinet design; ABB/Schneider/Siemens bundling with hardware |
Fastest-growing cost component; enables service revenue model shift |
|
Assembly & Integration |
7% |
Labor-intensive; regional assembly hubs near demand centers |
Modular/pre-fabricated designs reducing assembly time by 30% |
Source: PMarketing Research, Shanghai Metals Market (SMM), LME, industry expert interviews. Cost shares are approximate for a standard medium-voltage distribution cabinet.
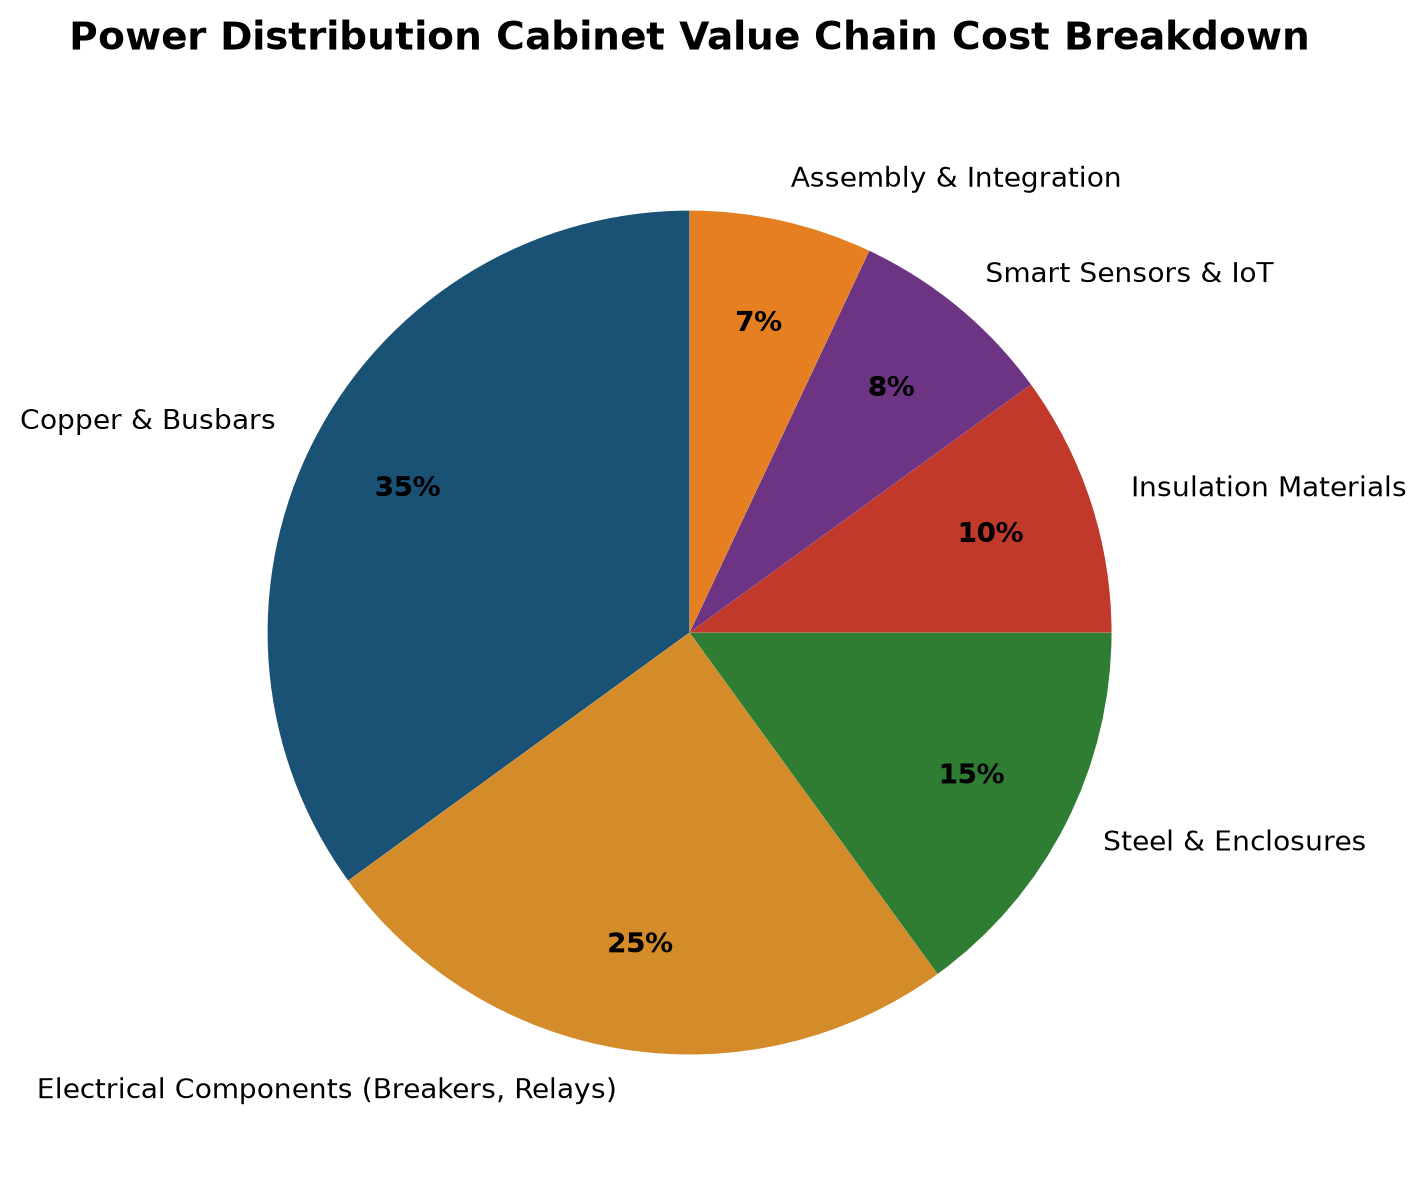
Figure 6: Power Distribution Cabinet Value Chain Cost Breakdown. Copper and busbars dominate at 35%, making cabinet manufacturing highly sensitive to copper price movements. Source: PMarketing Research, industry cost analysis.
Copper's dominance in the cost structure makes the entire value chain hostage to commodity cycles. LME copper prices fluctuated between USD 8,200 and USD 9,800 per metric ton in 2023, and in 2025 briefly surpassed USD 11,200 per ton — a 30% year-on-year increase. For circuit breakers and busbar systems, where copper constitutes 30–40% of raw material expense, this volatility translates directly into margin pressure. Tier-1 manufacturers like Eaton and Legrand now maintain 90-day copper reserves versus 45-day pre-2022 levels, tying up 18% more working capital.
The supply chain is also undergoing a structural geographic reallocation. Russia's export restrictions removed 2.8 million tons of cold-rolled steel from global markets in 2023 — equivalent to approximately 15% of the power cabinet sector's annual consumption. Turkish and South Korean steel exporters have captured the resulting supply gap, with Mexico's cabinet exports to the US growing 23% in 2023 by leveraging USMCA tariff exemptions. ABB's USD 200 million investment in a Texas-based cabinet plant using 85% domestic steel exemplifies the nearshoring trend.
6. Technology Trends & Innovation Roadmap
Three technology trajectories are converging to redefine what a "distribution cabinet" is: eco-friendly insulation replacing SF6, digital intelligence embedded in hardware, and modular/pre-fabricated architectures that compress installation timelines.
|
Technology Trend |
Current Status (2025) |
Projected Maturity (2030) |
Key Standard/Regulation |
|
SF6-Free Insulation |
Dry air (Schneider AirSeT), g³ gas (ABB SafeAir), C5-FK (Siemens 8DJH); ~28% of new installations |
Expected >60% of new MV installations in EU; global adoption lagging |
EU F-Gas Regulation; IEC 62271; EN IEC 63208:2025 |
|
Solid Insulation (Epoxy Resin) |
Commercial in China (XD Group, Nanhua Lanling); niche in Europe; 25% volume reduction |
Expanding in compact urban RMU applications; cost parity by 2028 in some segments |
IEC 61439; GB/T standards in China |
|
IoT-Embedded Smart Cabinets |
Sensor count per cabinet rising from 8→32; real-time temp, current, PD monitoring; Schneider EcoStruxure, ABB Ability |
Predictive maintenance accuracy >95%; autonomous fault detection; cloud analytics standard |
IEC 61850; IEEE C37; cybersecurity per EN IEC 63208 |
|
Modular/Pre-Fabricated (E-House) |
Growing in oil & gas, data centers; 60% faster installation; Siemens, Powell, ABB lead |
Expanding to utility substations, renewable farms; plug-and-play standardization |
IEC 61439; project-specific specs |
|
Compact Air-Insulated (Sealed) |
Emerging; matching GIS performance at atmospheric pressure; field trials in China |
Potential cost advantage over GIS in medium-voltage; gaining market share 2028+ |
IEC 62271-200; regional utility specs |
|
AI-Driven Diagnostics |
Early deployment: Siemens 8DJH with AI achieves 95% fault prediction accuracy |
Autonomous switching decisions; digital twin lifecycle management; cybersecurity hardened |
EN IEC 63208:2025 (OT security); IEC 62351 |
Source: IEC, CENELEC, CIGRE, company technical publications, industry conference proceedings. Projected maturity timelines are estimates based on regulatory timelines and technology demonstration progress.
The SF6-free transition is the most consequential near-term shift. SF6 gas has been the default insulation medium in medium-voltage switchgear for decades, prized for its excellent dielectric properties and compact equipment footprint. But its global warming potential of 23,500× CO₂ has made it a regulatory target. The EU F-Gas Regulation mandates progressive restrictions leading to a near-complete ban on new SF6-containing equipment by 2035. Three alternative technologies are now in commercial deployment: Schneider Electric's AirSeT uses dry air as insulation (GWP = 0, already installed in >5,000 units across Sweden and France), Siemens' 8DJH uses a C5-FK/CO₂ mixture (GWP <1, paired with digital twin monitoring), and ABB's SafeAir uses g³ gas (GWP <1, deployed in Xiongan New Area, China中国, and Singapore).
Digitalization is moving from peripheral monitoring to core functionality. A standard Switch Cabinet in 2025 can be specified with 32+ embedded sensors monitoring temperature, current, voltage, partial discharge, and gas pressure — compared with 8 sensors in a typical 2020 installation. The data feeds into cloud platforms (ABB Ability, Schneider EcoStruxure, Siemens MindSphere) for real-time analytics and predictive maintenance. Siemens reports that its AI-enhanced 8DJH achieves 95% fault prediction accuracy, and ABB claims a 40% reduction in unplanned downtime through its Ability platform. This intelligence layer is transforming the business model: manufacturers are increasingly selling monitoring subscriptions and maintenance contracts alongside hardware, shifting from one-time equipment revenue to recurring service income.
Modular and pre-fabricated architectures — particularly E-House solutions that integrate high-voltage switchgear, transformers, and low-voltage distribution in a single transportable enclosure — are gaining traction in oil & gas, mining, and data center applications. Installation timelines are compressed by 60% or more, and standardized interfaces allow incremental capacity addition without full system redesign. This trend aligns with the broader construction industry's shift toward prefabrication and reduces the site-labor component of cabinet deployment.
7. Strategic Outlook & Risk Assessment
The power distribution cabinet market's trajectory through 2030 is defined by the intersection of three megatrends: the infrastructure investment cycle (grid modernization, electrification, data centers), the regulatory technology cycle (SF6 phase-out, energy efficiency mandates), and the digital transformation cycle (IoT, AI, cloud monitoring). Companies that align their product portfolios, manufacturing footprints, and service models with all three simultaneously will capture disproportionate value.
|
Risk/Opportunity |
Probability |
Impact |
Strategic Response |
|
Copper price spike (>USD 12,000/ton) |
Medium-High |
High — margin compression for cost-sensitive manufacturers |
Aluminum busbar substitution; LME hedging; vertical integration into copper processing |
|
SF6 regulatory acceleration (ban by 2030) |
High (EU), Medium (global) |
Transformational — forces complete product redesign |
Accelerate SF6-free R&D; secure eco-insulation IP; target EU replacement market early |
|
Data center construction slowdown |
Low-Medium |
Medium — removes fastest-growing demand segment |
Diversify into utility grid and industrial electrification; maintain data center premium niche |
|
Cybersecurity breach in smart switchgear |
Medium |
High — reputational damage, regulatory liability |
Implement EN IEC 63208 compliance; OT security hardening; regular penetration testing |
|
Chinese manufacturer export expansion |
High |
Medium — price pressure in ASEAN, Belt & Road markets |
Differentiate on technology (SF6-free, IoT); lock in service contracts; leverage standards compliance as barrier |
|
Supply chain disruption (steel, chips) |
Medium |
Medium — extends lead times, raises costs |
Nearshore manufacturing (ABB Texas model); maintain 90-day strategic reserves; multi-source qualification |
Source: Author's assessment based on IEA grid investment projections, EU regulatory timelines, LME commodity data, and industry expert interviews. Probability and impact ratings are qualitative estimates.
For manufacturers, the strategic imperative is unambiguous: invest now in SF6-free product lines and digital monitoring platforms, while managing copper cost exposure through material substitution and financial hedging. The companies that have already committed to these trajectories — Siemens' USD 107 million Frankfurt expansion for SF6-free 8DAB, ABB's g³ commercialization, Schneider's AirSeT deployment — are positioned to capture the premium replacement market in Europe and North America as regulatory deadlines approach.
For project developers and utilities, the procurement calculus is shifting. Specifications increasingly require IEC 61439-compliant assemblies, IoT monitoring capability, and SF6-free insulation where local regulations mandate it. Total cost of ownership — factoring in energy efficiency (the EU Ecodesign Regulation mandates minimum 98% efficiency for LV switchgear), maintenance intervals (predictive maintenance can reduce unplanned downtime by 40%), and end-of-life environmental compliance — is replacing lowest-initial-price as the primary procurement criterion.
The market's structural trajectory is clear: steady volume growth of 5.5–7.2% CAGR through 2030, but with accelerating value migration toward technology-differentiated, service-enabled, and regulation-compliant products. The distribution cabinet is no longer just a metal box housing circuit breakers — it is becoming an intelligent node in a digitized, decarbonized power network.
Data Sources & Methodology
MarketsandMarkets — Global Switchgear Market Size & Forecast, 2025–2030 (Report ID: 1162268)
PSMarket Research — Switchgear Market Size, 2019–2032 (Report Code: 12369)
Grand View Research — Global Switchgear Market, 2018–2030
PMarketing Research — High and Low Voltage Switch Cabinet Market, 2024–2032
Growth Market Reports — Low Voltage Switchgear Market Research Report 2033
SNS Insider — Low Voltage Switchgear Market Size to Hit USD 84.29 Billion by 2032
IEA — World Energy Investment 2025; Electricity Demand Projections; Grid Investment Needs
IEC — IEC 61439 (Low-Voltage Switchgear), IEC 62271 (High-Voltage Switchgear), EN IEC 63208:2025 (Cybersecurity)
National Energy Administration (China) — Grid Engineering Investment Statistics, 2024
Shanghai Metals Market (SMM) — Copper Price Data, 2025 Q1
LME — Copper Futures Historical Data
Company Annual Reports — ABB, Siemens, Schneider Electric, Eaton, CHINT Group
CIGRE — Technical Brochures on SF6 Alternatives and Digital Switchgear
IndustryResearch.biz — Low Voltage Switchgear Market Competitive Analysis, 2024
QYResearch — Medium Voltage Switchgear Global Sales, 2024–2031
Note: All market size figures have been cross-referenced across at least 2–3 sources. Where sources differ significantly, the range is reported and the statistical scope is explained. Distribution cabinet figures are estimated as a 35–40% subsegment of the broader switchgear market, based on component revenue analysis and manufacturer product segmentation data. Forecast figures are labeled with "E" (estimated) and reflect projected scenarios, not confirmed outcomes.
Related Products

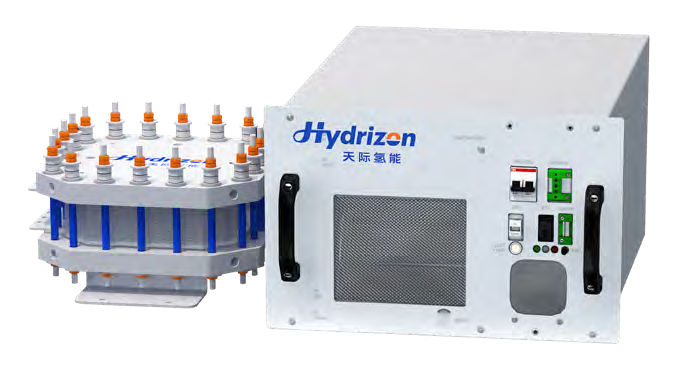
HI-Pro Green Hydrogen High-efficiency Production System-HI-PRO-AEM
Hydrizon Technology (Beijing) Co., Ltd.
Floating Boat Water Quality Automatic Monitoring System
Hebei Sailhero Environmental Protection High-tech Co., Ltd.
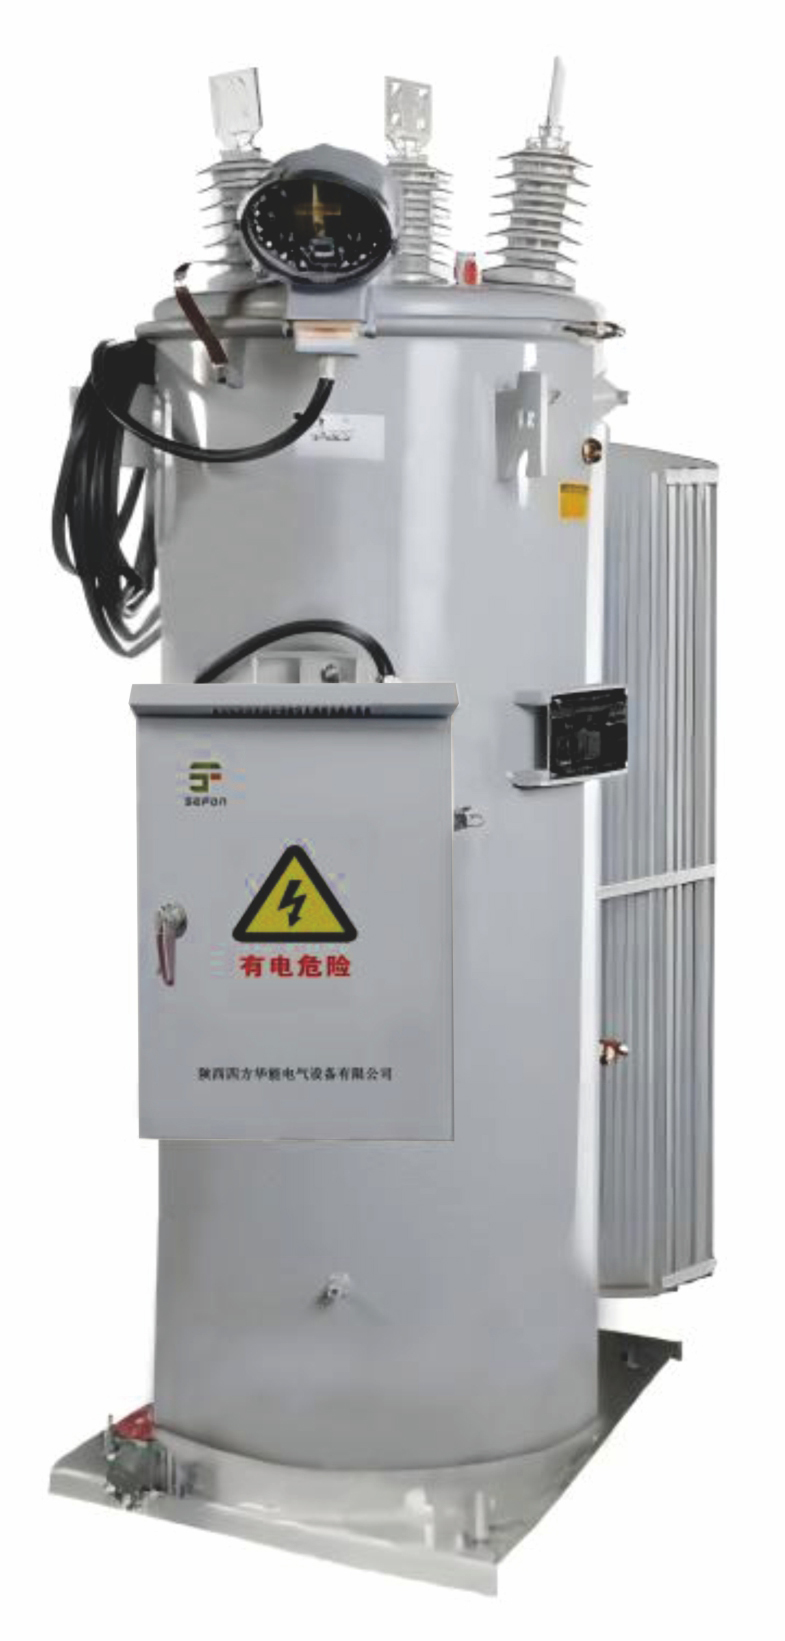
Single-Phase Automatic Voltage Regulator(AVR)
Shaanxi Sefon Electrical Equipment Co.,Ltd.