Executive Summary
The global transformer market has entered a structurally tight phase. Electricity demand growth, renewable-energy connections, data centers, electric-vehicle charging, industrial electrification and replacement of aging grid assets are all expanding transformer requirements at the same time. Unlike commodity electrical equipment, many power transformers remain highly engineered products with project-specific voltage, impedance, insulation, cooling, transport and testing requirements. Manufacturing capacity therefore cannot be expanded quickly by adding general factory floor space alone.
The clearest global signal is the combination of higher prices and longer delivery times. The International Energy Agency reported in 2025 that real power-transformer prices had increased by around 75% since 2021, while procurement lead times for large units could reach four years. In the United States, demand for distribution transformers had risen by 41% since 2019 and delivery periods that once averaged three to six months had extended to one to two years or longer by 2024. These conditions have turned transformer procurement into a schedule, financing and project-risk issue rather than a simple equipment-price comparison.
Regional demand is broad but uneven. Europe requires major investment to renew old networks and connect renewables; the European Commission estimates that EUR 584 billion of electricity-grid investment is needed by 2030. China continues to operate the world’s largest transformer manufacturing ecosystem and the IEA reported USD 88 billion of transmission and distribution investment in 2025. North America faces particularly acute replacement and capacity constraints. India, Southeast Asia, the Middle East, Africa and Latin America are also expanding demand through urbanization, industrial development and generation projects, although procurement is often more price-sensitive and dependent on imported equipment.
The market outlook for 2026-2029 is therefore positive for suppliers but difficult for buyers. Capacity additions may reduce the most extreme shortages, yet the market is unlikely to return quickly to pre-2020 pricing. Competitive advantage will increasingly depend on access to grain-oriented electrical steel, copper conductor, bushings, tap changers and testing capacity; the ability to guarantee losses and delivery; and the strength of local service and warranty execution.
Key Findings
- Global transformer demand is being driven simultaneously by new grid construction, replacement of aging assets, renewable interconnection, data centers and electrification.
- IEA industry evidence indicates that real power-transformer prices were approximately 75% higher in 2025 than in 2021.
- Large power-transformer lead times can reach four years, while distribution-transformer lead times in stressed markets have expanded from months to one or two years.
- GOES core steel and continuously transposed copper conductor together can represent about half of large-transformer production cost.
- North America and Europe face the strongest near-term supply gaps, while China remains the largest and most complete manufacturing base.
- International price comparisons are often misleading unless specifications, losses, testing, freight, duties, installation and service scope are normalized.
- Total cost of ownership is replacing unit price as the most important procurement metric for critical transformers.
- The 2026-2029 market is likely to remain firm, with gradual lead-time improvement but persistent pressure from materials, labor and qualification bottlenecks.
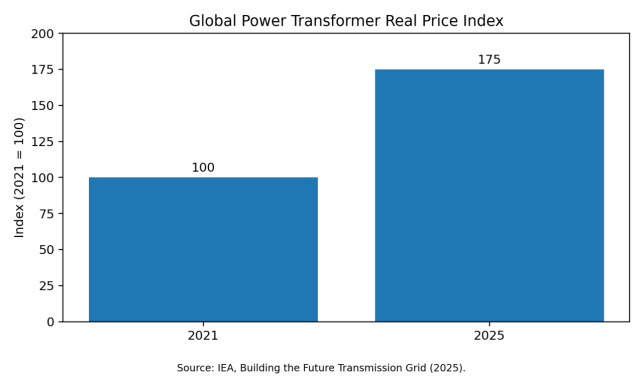
Figure 1. Global power-transformer real price index, 2021-2025.
1. Product Scope and Market Definition
The transformer market is not a single homogeneous market. Distribution transformers serve local networks and commercial or residential loads. Power transformers connect high-voltage transmission systems and major substations. Generator step-up transformers link power plants to the grid. Dry-type transformers serve buildings, rail, industrial plants and environments where fire safety or indoor installation is important. Converter transformers support HVDC systems, industrial drives, electrolysis and other power-electronics applications.
Market-size estimates from commercial research firms frequently differ because some count only equipment revenue, while others include service, replacement parts, installation or specialty transformers. For that reason, this report does not present a single unsupported global revenue number. Instead, it evaluates market direction through observable indicators: grid investment, transformer demand, order backlogs, prices, lead times, materials, trade dependence and announced manufacturing expansion.
The largest value pool is generally associated with power and special transformers, but the largest unit volumes are in distribution equipment. The economic drivers also differ. Distribution-transformer purchasing emphasizes standardization, annual volume, efficiency and inventory. Power-transformer purchasing emphasizes engineering, reliability, short-circuit performance, factory testing, transport and delivery certainty.
2. Global Demand Drivers
Grid expansion is the primary demand engine. The global electricity system must connect larger volumes of wind, solar, storage and new industrial load. Transmission projects require large power transformers and autotransformers, while distribution reinforcement requires millions of smaller units. Advanced economies and China account for most current grid spending, but emerging economies need faster investment growth to support reliable electrification and industrialization.
Replacement demand is equally important. Many installed transformers were built decades ago under lower loading assumptions. Thermal aging, moisture, bushing deterioration, tap-changer wear and repeated short-circuit stress raise failure risk. Utilities cannot replace every old unit immediately, but fleet age is forcing larger maintenance programs, strategic-spare purchases and replacement schedules.
Data centers have become a major incremental demand source. Hyperscale campuses require large utility interconnections, medium-voltage distribution and multiple layers of redundancy. The rapid growth of AI-related computing increases both total load and the value of reliable power. Transformer demand is therefore concentrated not only in national grids but also in specific data-center clusters where connection queues are already long.
Electrification adds another layer. EV charging, heat pumps, electric furnaces, hydrogen production and industrial process conversion increase peak loads and change load profiles. These changes may require higher transformer ratings, additional units or dynamic rating and monitoring solutions.
3. Regional Market Analysis
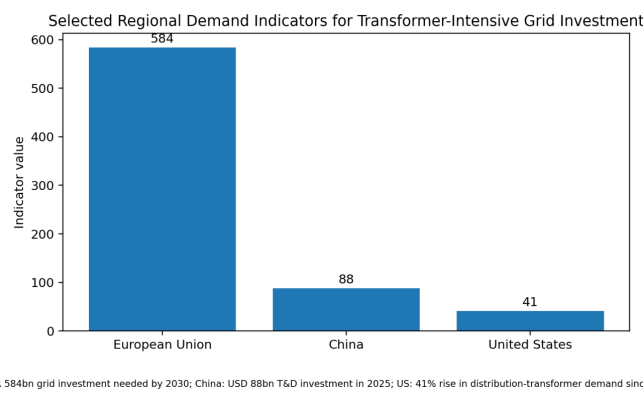
Figure 2. Selected regional indicators; values use different units and are shown as demand signals, not as a directly comparable market-size series.
3.1 North America
North America is one of the tightest transformer markets. U.S. utilities face simultaneous replacement, resilience and load-growth requirements. DOE/NREL evidence indicates that distribution-transformer demand increased by 41% from 2019 to 2024, while lead times expanded dramatically. NREL has estimated that U.S. distribution-transformer capacity may need to increase by 160%-260% by 2050 compared with 2021 levels under different demand pathways.
The region has domestic manufacturing, but it remains dependent on imported components and finished units for some categories. Utility qualification, Buy America requirements on federally supported projects, IEEE/ANSI standards, efficiency rules and local service expectations create barriers for new suppliers. Buyers increasingly use multi-year framework agreements and reserve production capacity earlier in project development.
3.2 Europe
Europe combines aging grids with aggressive renewable and electrification targets. The European Commission states that 40% of EU distribution grids are more than 40 years old and that EUR 584 billion of grid investment is needed by 2030. This creates demand across distribution, transmission, offshore wind, interconnection and industrial electrification.
European procurement is shaped by IEC standards, ecodesign efficiency requirements, low-noise specifications, environmental rules, fire safety and increasingly strict supply-chain security considerations. The IEA reported in 2025 that China accounted for around 60% of EU transformer imports, illustrating both Europe’s import dependence and the importance of Chinese supply. At the same time, European buyers are seeking more local capacity and diversified sources.
3.3 China and Wider Asia-Pacific
China has the world’s broadest transformer manufacturing base, from pole-mounted distribution units to ultra-high-voltage transformers and HVDC converter transformers. It benefits from large domestic demand, integrated steel and copper supply chains, extensive testing capability and a deep vendor base for bushings, tap changers, radiators, insulation and monitoring systems. The IEA reported USD 88 billion of Chinese transmission and distribution investment in 2025.
India is another major growth market, supported by generation additions, transmission corridors, distribution reform, renewable auctions and industrial expansion. Domestic manufacturing is significant, but quality, delivery and working-capital constraints can still create project bottlenecks. Southeast Asia is more fragmented: Indonesia, Vietnam, Thailand, Malaysia and the Philippines each have different utility standards, import duties and local-content policies. Demand is driven by urban growth, manufacturing relocation, data centers and renewable projects.
3.4 Middle East and Africa
The Middle East is investing in utility-scale solar, grid interconnections, industrial zones, data centers, desalination and hydrogen projects. Gulf markets often purchase high-specification equipment and place strong emphasis on heat performance, dust protection, corrosion resistance, approved-vendor status and long-term service. Large projects can create concentrated demand and long procurement pipelines.
Africa has substantial electrification and transmission needs, but procurement is constrained by financing, currency risk, utility creditworthiness and logistics. Multilateral development banks and export-credit agencies therefore play a larger role. The market is attractive for cost-competitive suppliers that can provide robust designs, training, spare parts and flexible financing rather than equipment alone.
3.5 Latin America
Latin American demand is driven by renewable integration, mining, urban distribution, transmission interconnections and replacement of aging systems. Brazil and Mexico are the largest industrial markets, while Chile, Peru, Colombia and Argentina generate project demand through mining and renewable-energy development. Local standards, import taxes, exchange-rate volatility and long-distance inland transport can materially change delivered cost.
4. Price Trend and Commercial Conditions
Transformer pricing has changed from a relatively stable engineered-equipment market to a capacity-constrained market. The IEA’s 75% real-price increase since 2021 reflects global market conditions for power transformers, but it should not be applied mechanically to every quotation. A transformer price depends on MVA rating, voltage, impedance, insulation level, guaranteed losses, temperature rise, cooling system, noise, tap changer, bushings, monitoring, testing, delivery date and transport scope.
Distribution-transformer price increases in North America have at times been much larger than global power-transformer indices because the shortage was especially acute and because small-unit procurement moved from short-cycle annual buying to allocation and queue management. NREL research has noted examples of price increases of five to six times in stressed U.S. segments, although such figures should not be treated as a global average.
Contract structure is also changing. Suppliers increasingly limit quotation validity, include copper or steel escalation clauses, require larger advance payments and protect themselves against logistics and currency movements. Buyers are responding with framework agreements, indexed pricing, milestone payments and stronger schedule-liquidated damages.
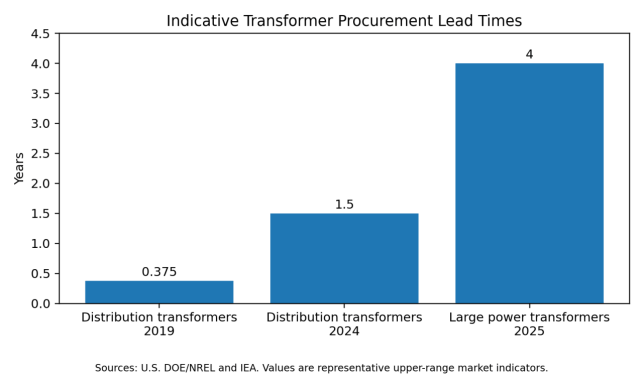
Figure 3. Indicative procurement lead times in stressed transformer markets.
5. Cost Structure and Raw-Material Exposure
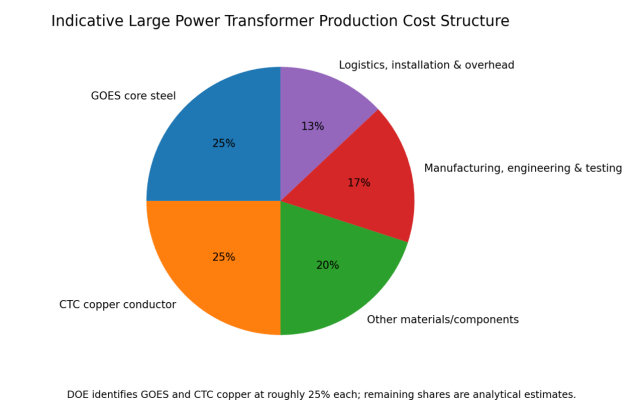
Figure 4. Indicative large power-transformer production cost structure.
Grain-oriented electrical steel is the central material for conventional transformer cores. Higher-permeability, lower-loss grades improve efficiency but are produced by a limited number of qualified mills. Core design, flux density, step-lap construction and material grade determine no-load losses and noise. A shortage of high-grade GOES cannot be solved simply by substituting ordinary steel.
Copper conductor is the second major exposure. Large transformers commonly use continuously transposed conductor to reduce eddy-current losses and improve winding performance. Copper-price movements affect quotation levels, but conductor fabrication capacity and lead time can be as important as the metal price itself. Aluminum is used in some distribution and dry-type designs, but substitution changes dimensions, weight, thermal behavior and customer acceptance.
Other critical components include bushings, on-load tap changers, pressboard, transformer oil or ester fluids, radiators, pumps, fans, relays and monitoring systems. A single delayed bushing or tap changer can hold up completion of an otherwise finished transformer. Supply-chain management therefore requires visibility below the tier-one manufacturer.
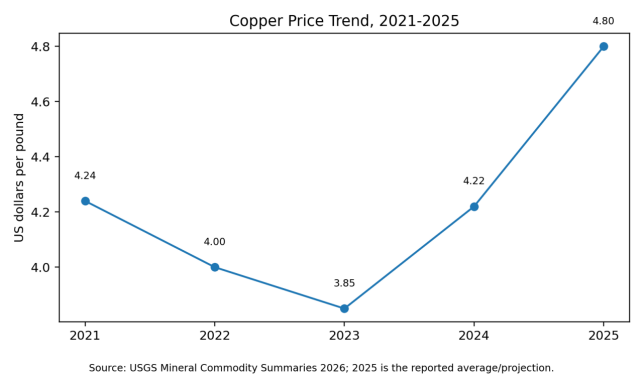
Figure 5. Copper price trend, 2021-2025.
6. Technology and Product Development
|
Technology direction |
Market effect |
Cost implication |
Buyer consideration |
|
Higher-efficiency cores |
Lower no-load losses and lifetime energy cost |
Premium GOES or more core material |
Use loss capitalization, not purchase price alone |
|
Digital monitoring |
Earlier detection of thermal, gas and bushing problems |
Higher sensor and software cost |
Define data ownership, cyber security and alarm responsibility |
|
Natural/ester fluids |
Improved fire and environmental performance |
Higher fluid and design cost |
Confirm temperature, material compatibility and local approvals |
|
Dynamic transformer rating |
Potentially increases usable capacity |
Monitoring and thermal-model investment |
Useful where load peaks are intermittent |
|
Flexible/modular designs |
Can reduce replacement time and spare inventory |
Standardization may limit optimization |
Evaluate system compatibility and transport constraints |
|
Dry-type and cast-resin designs |
Indoor, rail, building and industrial applications |
Higher material cost in some ratings |
Compare fire risk, ventilation and maintenance |
Digitalization is becoming a differentiator, but it does not replace basic design quality. Online dissolved-gas analysis, bushing monitoring, fiber-optic winding temperature and tap-changer analytics can reduce failure risk when integrated into a clear maintenance process. Buyers should avoid paying for monitoring packages that generate data without defined alarm thresholds, response procedures or long-term software support.
7. Total Cost of Ownership and Project Economics
TCO = Equipment + Freight + Installation + Capitalized Losses + Maintenance + Outage Risk + Delay Cost - Residual Value
No-load losses occur whenever a transformer is energized, regardless of loading. Load losses rise approximately with the square of current. The economically optimal design therefore depends on the expected load profile, energy value, operating hours and discount rate. A lower-loss transformer can justify a higher initial price over a 25-40 year service life.
Delay cost is increasingly important. A missing transformer can postpone a renewable project, data center, mine, factory or substation. The lost revenue and financing cost from delay may exceed the equipment-price difference between bidders. Delivery credibility should therefore be monetized in the commercial evaluation.
Failure and outage risk should also be priced. Critical units may require strategic spares, redundant capacity, online monitoring or emergency replacement agreements. For large power transformers, replacement transport and installation can be complex, and repair may require specialist facilities. A cheap unit with weak service support can create a large contingent liability.
8. International Trade and Cross-Border Procurement
Cross-border transformer purchasing is affected by more than tariffs. Technical standards differ between IEC and IEEE/ANSI markets, and utilities often have proprietary specifications. Frequency, voltage, insulation coordination, seismic requirements, noise, losses, bushings, protection interfaces and terminal arrangements must be confirmed before price comparison.
Large-transformer logistics are project-specific. Delivered cost may include route surveys, port handling, heavy-haul trailers, rail transport, escorts, bridge analysis, cranes, oil filling, vacuum treatment, assembly and commissioning. Incoterms alone do not define the complete risk allocation. Buyers should require a responsibility matrix from factory release to energization.
Currency and payment conditions matter because manufacturing cycles can extend over several years. Contracts may combine advance payments, progress milestones, letters of credit, performance bonds and warranty guarantees. Buyers should assess the financial strength of the supplier and the enforceability of guarantees in the supplier’s jurisdiction.
Chinese suppliers remain highly competitive in many export markets because of manufacturing scale and integrated supply chains. Their strongest opportunities are in fast-growing emerging markets and projects where IEC-compliant equipment, competitive cost and financing support are important. The main challenges are utility qualification, local service, bankability, transport execution, language, warranty enforcement and geopolitical trade measures.
9. Competitive Landscape
The global market includes multinational groups with broad portfolios, large regional manufacturers, specialized high-voltage firms and a long tail of distribution-transformer producers. Major global names include Hitachi Energy, Siemens Energy, GE Vernova, Mitsubishi Electric, Toshiba Energy Systems, Schneider Electric and Eaton, alongside major Chinese, Indian, Korean, Turkish, European and Latin American manufacturers. Market position varies strongly by voltage class and geography; no single ranking accurately represents all transformer segments.
|
Competitive model |
Strength |
Limitation |
Best-fit market |
|
Global full-line manufacturer |
Bankability, engineering, service network |
Higher overhead and long backlog |
Critical utility and international projects |
|
Large Chinese manufacturer |
Scale, cost, broad component ecosystem |
Qualification and local service vary |
Emerging markets, renewables, grid expansion |
|
Regional utility-qualified supplier |
Local standards, fast service, established references |
Limited export reach or capacity |
Domestic utility replacement programs |
|
Specialist transformer company |
Customization and niche engineering |
Smaller balance sheet and service footprint |
Industrial, converter or special-duty applications |
|
Low-cost volume producer |
Competitive standard-unit price |
Less suited to complex specifications |
Distribution and commercial applications |
Competition is shifting from ex-works price to delivery certainty, validated losses, production-slot access, sub-supplier control, monitoring, service and emergency response. Manufacturers that invest in test bays, winding capacity, skilled labor and strategic material agreements are likely to capture a disproportionate share of high-value orders.
10. Procurement Recommendations
- Normalize all bids to the same electrical specification, guaranteed losses, accessories, testing and delivery scope.
- Use a transparent loss-capitalization method based on expected loading and local electricity value.
- Assess factory backlog, production milestones, test-bay availability and recent on-time delivery performance.
- Confirm the source and qualification of GOES, conductor, bushings, tap changers, insulation and monitoring systems.
- Separate ex-works price, freight, heavy transport, installation, oil processing, commissioning and taxes.
- Define escalation formulas for copper, steel, freight and currency rather than accepting open-ended price adjustment.
- Freeze critical technical requirements early; late impedance, bushing or dimensional changes can reset engineering and delivery.
- Conduct factory audits and independent inspection for first-time suppliers or critical units.
- Require a realistic warranty-response plan, spare-parts strategy and local service arrangement.
- Include delay cost and outage risk in the commercial score, not only equipment price.
- For fleet purchases, consider framework agreements and standardized designs to reserve capacity and reduce engineering repetition.
- For imported equipment, verify utility approval, customs classification, sanctions exposure, insurance and guarantee enforceability.
11. Market Outlook, 2026-2029
Demand is expected to remain strong through 2029. Grid investment, replacement, data centers and renewable interconnection are multi-year trends, not one-off events. The strongest markets will be those combining high electricity-load growth with large grid programs: the United States, Europe, China, India, the Gulf states and selected Southeast Asian and Latin American economies.
Supply should improve as manufacturers expand factories, add test capacity and localize production. However, qualification cycles, skilled-labor shortages and specialized materials will limit the speed of relief. Distribution-transformer lead times may normalize faster than large power-transformer lead times because standardized capacity can be added more quickly.
Prices are likely to rise more slowly than in 2021-2025, but a broad return to pre-pandemic levels is unlikely. Copper remains expensive, GOES is specialized, labor costs are higher and manufacturers have stronger backlogs. The most probable outcome is firm pricing with greater differentiation between suppliers that can deliver and those that cannot.
Technology will increasingly support capacity optimization. Dynamic rating, better monitoring, flexible transformer concepts and standardized spare strategies can reduce the need for immediate replacement in some cases. Nevertheless, these solutions will supplement rather than eliminate the need for new manufacturing capacity.
Conclusion
The global transformer market is becoming one of the most strategically important equipment markets in the electricity system. Demand is broad-based, production is specialized, and supply-chain constraints have raised both price and project risk. The market should not be judged solely by a commercial market-size estimate; the more meaningful indicators are grid investment, order backlogs, lead times, replacement needs and the cost of delayed electrification.
For buyers, the correct decision framework is delivered total cost of ownership. Guaranteed losses, reliability, delivery certainty, transport, service and outage exposure can outweigh a moderate difference in factory price. For suppliers, the next phase of competition will reward material security, engineering quality, test capacity, international compliance and local service.
The outlook through 2029 remains favorable for capable manufacturers, but challenging for project developers and utilities. Early procurement, specification discipline and rigorous supplier evaluation will be essential to protect project schedules and long-term asset value.