Executive Summary
The global MBR market is moving from a specialist wastewater technology toward a mainstream option where discharge limits, land constraints and water reuse requirements justify a higher level of process intensification. Public market estimates are not identical, but they converge on a 2024-2025 market of roughly USD 3.8-4.5 billion and a medium-term growth rate in the high-single digits. Grand View Research forecasts USD 5.77 billion by 2030, while MarketsandMarkets projects USD 6.75 billion for the same year. The difference reflects varying definitions of systems, services, replacement revenue and geographic coverage rather than a fundamentally different direction of travel.
For membrane module suppliers, the relevant opportunity is broader than new-build plant capacity. It includes replacement modules, rack expansions, retrofit projects, decentralized packaged systems, industrial water-reuse projects and the conversion of conventional activated-sludge plants where land is constrained. Hollow-fiber modules represented about 50.9% of 2024 market revenue in one widely used segmentation, flat-sheet modules about 41.1%, and multi-tubular or other designs the balance. Submerged systems accounted for 77% of revenue, confirming that module economics are increasingly tied to low-pressure filtration, aeration efficiency and maintainability rather than high cross-flow pumping.
Demand is supported by a persistent global treatment gap. WHO reports that only 56% of domestic wastewater flows were safely treated in 2024. UN-Water's 2024 update found that, among the limited set of countries reporting industrial wastewater data, just 27% was safely treated. The figures are not directly comparable, but together they show that infrastructure expansion and compliance upgrades remain large, long-duration markets .
The competitive battleground is shifting from basic solids separation to lifecycle performance. Buyers increasingly evaluate specific aeration demand, permeability stability, chemical cleaning frequency, membrane life, rack density, pretreatment tolerance, digital controls and the availability of replacement modules. Full-scale studies indicate that well-operated municipal MBR plants commonly use around 0.8-1.1 kWh/m3, while optimized cases have reported materially lower ranges. Energy use is therefore not a fixed technology penalty; it is a design and operating variable that can decide project bankability.
Asia Pacific is the largest regional market, with 40.81% of 2024 revenue in Grand View Research's model. China remains the largest national market in the region, while India is among the faster-growing markets. Saudi Arabia and other water-stressed markets offer attractive reuse-led demand, while Europe is shaped by tighter urban wastewater rules and advanced treatment requirements under the revised EU Urban Wastewater Treatment Directive, which entered into force on 1 January 2025 .
The base-case outlook is for a 7.5-8.5% annual expansion of the total MBR market through 2030. Module suppliers are likely to outperform the system market where they combine competitive membrane area cost with low-energy aeration, strong pretreatment guidance, open service capability and documented performance in difficult industrial feedwaters. The main downside risks are high upfront cost, site-specific fouling, vendor lock-in, inconsistent influent characterization and competition from upgraded conventional treatment trains that can meet discharge standards at lower lifecycle cost in less constrained sites.
1. Scope, Definitions and Methodology
1.1 What is being measured
An MBR combines biological wastewater treatment with membrane-based solid-liquid separation. The Membrane Modules are the filtration core, but a commercial MBR installation also includes biological tanks, air-scour systems, permeate pumps, pretreatment, chemical-cleaning systems, controls, racks, piping and integration services. Most market-research providers count some or all of these elements together. As a result, system-market revenue should not be interpreted as membrane-module sales alone.
This report uses three layers of evidence: (1) current market-research estimates to establish the revenue envelope; (2) official regulations and global wastewater indicators to test the demand thesis; and (3) peer-reviewed studies and manufacturer data to assess energy, performance and competition. Where definitions differ, the report uses ranges and explains the difference rather than forcing a single precise number.
1.2 Key analytical cautions
- Market-size studies differ in whether they include modules, complete systems, engineering, services and replacement revenue.
- Country and regional numbers from a single provider are useful for relative comparison, but should not be mixed with another provider’s global total without adjustment.
- Energy consumption is highly site-specific and depends on scale, utilization, temperature, nitrogen-removal requirements, membrane flux, aeration control and pretreatment.
- Industrial wastewater is not one market: food and beverage, pharmaceuticals, chemicals, textiles, electronics, mining and landfill leachate have very different fouling and pretreatment requirements.
- Forecasts are estimates, not observed outcomes. Values marked 2030E or 2034E are scenario-based projections.
2. Global Market Size and Forecast
2.1 A high-single-digit growth market, but with definition uncertainty
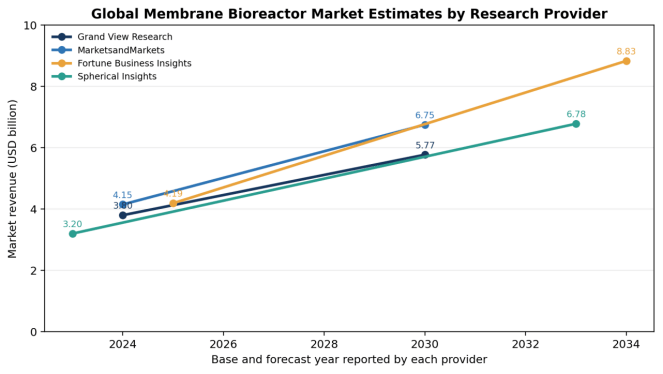
The strongest conclusion from current public estimates is not a single market-size number but a relatively tight growth band. Four providers place the market between USD 3.2 billion in 2023 and USD 4.19 billion in 2025, with reported or implied growth rates of roughly 7.4-8.6%. For a common 2030 horizon, the two directly comparable forecasts are USD 5.77 billion and USD 6.75 billion.
Figure 1. Global MBR Market Estimates by Research Provider
|
Provider |
Base year / value |
Forecast year / value |
Reported or implied CAGR |
Interpretation |
|
Grand View Research |
2024 / USD 3.80bn |
2030E / USD 5.77bn |
7.4% reported |
Conservative common-horizon case |
|
MarketsandMarkets |
2024 / USD 4.15bn |
2030E / USD 6.75bn |
8.5% reported |
Higher system and service envelope |
|
Fortune Business Insights |
2025 / USD 4.19bn |
2034E / USD 8.83bn |
8.6% implied |
Longer forecast horizon |
|
Spherical Insights |
2023 / USD 3.20bn |
2033E / USD 6.78bn |
7.8% reported |
Lower starting base, similar growth direction |
Table 1. Market estimates reflect different definitions and publication dates. Implied CAGR is calculated from stated endpoints where the provider page did not display a rate.
A practical planning assumption is therefore a 2025 market of approximately USD 4.0-4.5 billion and a 2030 market of USD 5.8-6.8 billion. The midpoint of the two 2030 common-horizon estimates is about USD 6.26 billion. This range is more defensible for strategic planning than selecting the highest available forecast.
2.2 What the forecast means for module demand
The module opportunity should be viewed as three overlapping revenue pools: new-build modules, replacement modules and capacity-expansion modules. New-build demand follows municipal and industrial capital expenditure. Replacement demand depends on installed base, membrane life, operating severity and vendor-specific module compatibility. Expansion demand arises when existing plants add racks, improve reuse quality or debottleneck biological capacity. Public datasets do not provide a reliable global split among these pools, but supplier product portfolios and retrofit case studies show that replacement and expansion are strategically important.
3. Demand Drivers: Regulation, Reuse and Infrastructure Gaps
3.1 The treatment gap remains structural
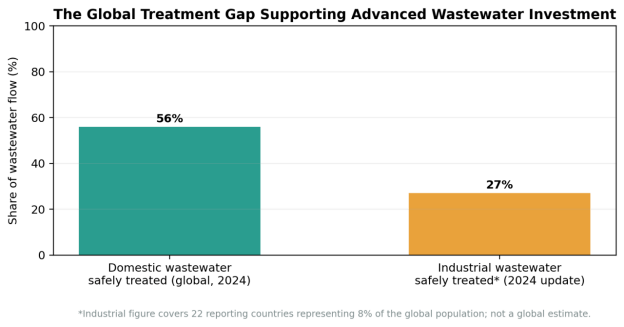
The addressable need for advanced Wastewater Treatment Equipment is supported by a large infrastructure deficit. WHO reports that the share of domestic wastewater flows safely treated remained 56% globally in 2024. UN-Water’s industrial wastewater dataset is much less complete, but among the 22 countries reporting, only 27% of industrial wastewater was safely treated.
Figure 2. Global Wastewater Treatment Gap
This gap does not automatically translate into MBR adoption. Lower-cost lagoons, activated sludge, sequencing batch reactors, moving-bed biofilm reactors and tertiary filtration remain competitive. MBR gains share where one or more of the following conditions are present: severe land constraints, stringent suspended-solids or pathogen limits, water-reuse requirements, difficult sludge-settling conditions, modular expansion needs, or high-value industrial water recovery.
3.2 Regulation is increasing treatment intensity
Europe provides a clear regulatory example. Directive (EU) 2024/3019 entered into force on 1 January 2025 and strengthens urban wastewater treatment requirements, including broader collection and treatment coverage, nutrient removal, energy and climate provisions, and more advanced treatment of micropollutants for larger facilities. MBR is not mandated, but tighter effluent and footprint requirements improve the economics of compact advanced treatment trains.
In the United States, water-reuse programs continue to support municipal and onsite non-potable reuse. EPA research and the National Water Reuse Action Plan explicitly recognize onsite systems that treat wastewater using MBRs as one pathway for reducing freshwater demand and improving resilience. Similar reuse-driven logic is visible in water-stressed Gulf markets and dense Asian cities, although procurement rules, tariff structures and localization requirements vary by country.
3.3 Reuse, not discharge alone, changes the value proposition
The economic case for MBR becomes stronger when high-quality effluent avoids potable-water purchases, reduces sewer discharge charges, feeds reverse osmosis, supports irrigation or process-water reuse, or enables a constrained site to expand production. In these projects, the membrane is not simply a compliance component; it is part of a water-supply asset. This favors suppliers that can integrate biological process design with Filtration Systems, disinfection, polishing and reuse controls.
4. Technology Structure and Module Economics
4.1 Market structure strongly favors submerged modules
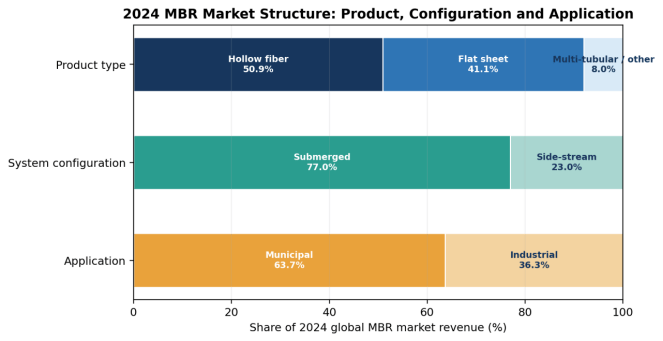
Grand View Research estimates that hollow-fiber products held 50.9% of global MBR revenue in 2024, while flat-sheet products represented about 41.1%. Submerged configurations accounted for 77% of revenue, and municipal applications 63.67%. These shares matter because they define the main engineering battleground: packing density and flux versus robustness, debris tolerance, cleanability and aeration demand.
Figure 3. 2024 MBR Market Structure
|
Module route |
Typical strengths |
Typical constraints |
Best-fit situations |
|
Hollow fiber |
High packing density; large membrane area per tank volume; scalable racks; strong installed base |
Fiber integrity and ragging risk; air-scour design is critical; cleaning access can be more complex |
Large municipal plants, reuse facilities, compact high-capacity systems |
|
Flat sheet |
Open channel geometry; visual inspection; strong debris tolerance; straightforward module handling |
Lower packing density; larger tank footprint per membrane area in some designs |
Industrial wastewater, smaller plants, variable feed, sites prioritizing robust operation |
|
Hollow sheet / hybrid |
Attempts to combine open channels with compact module geometry; gravity-driven options available |
Smaller supplier base; less standardization across vendors |
Specialized industrial and municipal applications |
|
Multi-tubular / side-stream |
High shear, strong solids handling, accessible external loops |
Higher pumping energy and more complex hydraulics |
High-strength industrial wastewater and difficult feeds where submerged systems are unsuitable |
Table 2. Technology comparison synthesized from manufacturer product literature and MBR review studies [9][14]-[20]. Actual performance depends on module design and operating conditions.
4.2 Membrane chemistry and pore size are not the only differentiators
PVDF is widely used in contemporary hollow-fiber and flat-sheet products because of chemical resistance and mechanical durability, but chlorinated polyethylene, polyethylene and proprietary composites remain in the market. The broader Water Treatment Membrane Technology proposition includes support structure, potting, fiber reinforcement, channel geometry, air-scour distribution, rack design, integrity testing and cleaning protocol. A nominal pore size alone does not predict lifecycle performance.
Commercial products illustrate the range. Veolia states a nominal pore size of 0.035 µm for ZeeWeed 500 hollow-fiber UF modules. KUBOTA’s flat-plate SP series uses a membrane with an average pore size of 0.2 µm. Kovalus PURON uses a braided PVDF hollow fiber with a nominal pore size of 0.03 µm. Alfa Laval’s hollow-sheet configuration is designed for filtration to 0.2 µm and gravity-driven operation. These values are not directly comparable because permeability, support structure and operating flux differ .
4.3 Fouling control remains the central operating challenge
Membrane fouling is the main reason that laboratory permeability does not translate directly into plant economics. Fouling increases transmembrane pressure, reduces flux, drives aeration and cleaning, and can shorten module life. The most effective projects treat fouling as a system issue: screening and grease removal, biological stability, flux control, relaxation or backpulse strategy, air-scour distribution, chemical-cleaning compatibility and operator discipline must be designed together.
5. Application Analysis
5.1 Municipal wastewater: the volume market
Municipal applications accounted for about 63.67% of 2024 market revenue in Grand View Research’s model. The strongest municipal use cases are dense cities, water-reuse schemes, coastal discharge locations with strict limits, retrofits that cannot add secondary clarifiers, and decentralized systems serving campuses, resorts, hospitals and new developments. MBR can also stabilize effluent quality when sludge settleability is poor, but it should not be selected solely for technology prestige.
5.2 Industrial wastewater: faster growth and higher application risk
Industrial MBR revenue was estimated at about USD 1.37 billion in 2024 and is projected to grow faster than the total market in some forecasts. This segment offers higher value per project, but it also carries greater feedwater risk. Food and beverage streams may require fats, oils and grease removal; textile streams may contain dyes and salts; chemical and pharmaceutical wastewater can include inhibitory compounds; refinery and petrochemical streams often need upstream oil removal; and landfill leachate can impose extreme fouling and osmotic stress.
|
Industry |
Primary MBR value proposition |
Critical pretreatment / design issue |
Commercial implication |
|
Food & beverage |
High BOD/COD removal and water reuse |
DAF or grease removal; shock-load equalization |
Strong packaged and reuse opportunity |
|
Pharmaceuticals |
Stable solids separation and reuse-ready effluent |
Toxicity, solvents, antibiotics and variable batches |
Pilot testing and analytical support are essential |
|
Textiles |
Compact biological treatment before polishing / reuse |
Color, salinity, surfactants and recalcitrant COD |
Often requires hybrid oxidation or RO downstream |
|
Electronics |
High-quality reclaimed water as feed to advanced treatment |
Low organic loading but strict reliability and water-quality targets |
Integration with UF/RO and digital monitoring |
|
Refining / petrochemicals |
Footprint reduction and robust solids barrier |
Oil, hydrocarbons and pretreatment reliability |
High engineering value; failure risk is material |
|
Landfill leachate |
High biomass retention and separation under difficult conditions |
Ammonia, salinity, refractory organics and severe fouling |
Specialist market with high OPEX sensitivity |
Table 3. Application assessment based on MBR review literature and supplier case studies .
Industrial buyers frequently purchase the membrane module as part of a wider treatment train. This creates cross-selling opportunities for pumps, blowers, chemical dosing, pretreatment, polishing and Sludge Treatment Equipment, but it also increases the importance of single-point performance guarantees and clearly defined battery limits.
6. Regional Market Outlook
6.1 Asia Pacific: scale, urban density and industrial reuse
Asia Pacific held 40.81% of global MBR revenue in 2024 according to Grand View Research. China is the largest national market in the region, supported by large municipal treatment capacity, industrial parks and increasingly stringent effluent standards. India is smaller but faster growing, with demand linked to urbanization, industrial discharge compliance and reuse. Southeast Asia combines major infrastructure deficits with strong industrial manufacturing growth, but project financing and operator capability vary substantially.
6.2 Europe: regulation-led upgrades and replacement demand
Europe’s market was estimated at USD 671.7 million in 2024. Growth is slower than in Asia, but the region is strategically important because of advanced effluent requirements, high labor costs, water reuse, micropollutant treatment and a large installed base. The revised EU directive supports investment in more intensive treatment, while energy-neutrality goals increase pressure on suppliers to reduce air-scour and pumping demand.
6.3 Middle East: water scarcity supports reuse economics
Saudi Arabia’s MBR market was estimated at USD 91.0 million in 2024 and USD 144.5 million by 2030 in Grand View Research’s model. The region is attractive because reclaimed water has high strategic value, land-efficient treatment is useful in urban developments, and large infrastructure programs can support scale. However, high temperatures, salinity, procurement localization and long-term service capability are decisive commercial factors.
6.4 Americas: selective municipal upgrades and industrial niches
North American demand is concentrated in reuse, nutrient-sensitive watersheds, decentralized systems and capacity-constrained municipal plants. Latin America offers a larger infrastructure gap but more variable financing and tariff support. Brazil is the largest MBR market in the region in Grand View Research’s country model, while other markets are project-driven rather than continuously scaled.
Figure 4. Selected National MBR Markets: 2024 vs. 2030E
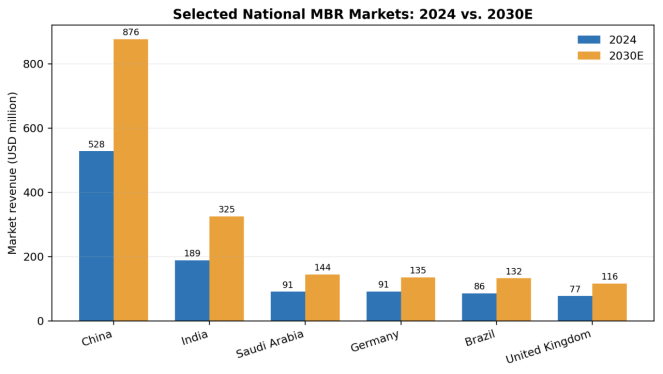
Source: Grand View Research country outlook pages. All values use one provider’s methodology to preserve comparability. 2030E values are forecasts.
|
Region |
Demand catalyst |
Module opportunity |
Key constraint |
2026-2030 view |
|
Asia Pacific |
Urban treatment expansion, industrial parks, reuse |
New-build volume, local manufacturing, replacement base |
Price competition and uneven service quality |
Largest volume market; above-average growth |
|
Europe |
Revised treatment rules, reuse, micropollutants, retrofit |
Premium low-energy modules and replacement |
Mature infrastructure and strict lifecycle scrutiny |
Moderate growth, high technology intensity |
|
Middle East |
Water scarcity, new cities, reuse economics |
Large projects, packaged systems, high-quality effluent |
Localization, heat, salinity and service requirements |
Attractive project pipeline, execution-sensitive |
|
North America |
Reuse, nutrient limits, decentralized treatment |
Retrofit modules, advanced controls, municipal upgrades |
Long procurement cycles and strong incumbent positions |
Steady selective growth |
|
Latin America |
Infrastructure deficit and industrial compliance |
Packaged plants and industrial niches |
Financing, tariffs and operator capacity |
Uneven but meaningful country opportunities |
|
Africa |
Low treatment coverage and new urban infrastructure |
Decentralized / packaged systems |
Capital availability and maintenance capability |
Long-term potential, near-term project selectivity |
Table 4. Regional assessment combines market-research estimates, regulation and industry structure.
7. Energy, Cost and Total Cost of Ownership
7.1 Energy is the most visible operating-cost challenge
A full-scale municipal study reported average MBR electricity consumption of approximately 0.8-1.1 kWh/m3 across the plants examined. An optimized full-scale case later reported 0.35-0.65 kWh/m3, while a 2025 evaluation of three full-scale systems reported 0.37-0.82 kWh/m3. These ranges should not be treated as universal benchmarks because treatment targets, load, scale and process boundaries differ. They do show that operating discipline and aeration design can cut energy materially.
|
Evidence base |
Reported specific energy |
Context |
How to use the benchmark |
|
Krzeminski et al., full-scale municipal MBRs |
0.8-1.1 kWh/m3 average |
European municipal plants; long-term operating data |
Reference range for conventional full-scale operation |
|
Optimized full-scale case |
0.35-0.65 kWh/m3 |
Plant-level optimization and air-scour control |
Evidence that low-energy operation is achievable |
|
2025 three-plant full-scale evaluation |
0.37-0.82 kWh/m3 |
Three MBR plants with differing pretreatment and operation |
Illustrates the importance of upstream process quality |
|
Early side-stream vs submerged review |
Side-stream 2-10; submerged 0.2-0.4 kWh/m3 |
Broad historical literature ranges |
Directionally supports the lower-energy submerged configuration |
Table 5. Energy figures are reported ranges from different studies and are not normalized to identical process boundaries.
7.2 Total cost is driven by more than membrane purchase price
- Civil and tank cost: MBR can save land and eliminate secondary clarifiers, but membrane tanks, fine screening and cleaning systems add capital.
- Energy: biological aeration and membrane air scour are usually the dominant operating loads; low utilization can materially worsen kWh/m3.
- Membrane replacement: useful life depends on chemical exposure, abrasion, fiber integrity, fouling and cleaning practice.
- Chemicals: maintenance cleaning and recovery cleaning require compatible chemicals and wastewater handling.
- Labor and skills: automation can reduce routine intervention, but troubleshooting requires trained operators and supplier support.
- Pretreatment: inadequate screening, grease removal or equalization can destroy the expected savings from a lower-priced module.
- Reuse value: avoided freshwater cost, discharge charges and downstream filtration requirements can offset higher MBR cost.
For buyers, a lifecycle bid should request guaranteed net flux, design and peak conditions, specific aeration demand, cleaning frequency, chemical consumption, membrane warranty, replacement pricing, expected availability and effluent quality. For suppliers, the commercial advantage increasingly comes from documented total-cost performance rather than the lowest price per square metre of membrane.
8. Competitive Landscape
8.1 A concentrated technology core with a broad integration ecosystem
The global market includes long-established membrane specialists, diversified water-technology groups and regional system integrators. Leading module platforms include Veolia ZeeWeed, KUBOTA submerged flat-plate units, Toray flat-sheet MBR, Mitsubishi Chemical STERAPORE, Kovalus PURON, DuPont MemPulse, Alfa Laval membrane filtration modules and Asahi Kasei Microza. Competitive strength depends on installed references, module durability, energy performance, local service, replacement availability and the ability to guarantee system-level results.
|
Supplier / platform |
Configuration and official specification |
Positioning signal |
Commercial implication |
|
Veolia ZeeWeed 500 |
Reinforced hollow-fiber UF; 0.035 µm nominal pore size; permeability >900 LMH/bar stated |
Large installed base and low-energy LEAPmbr positioning |
Strong municipal and reuse credibility |
|
KUBOTA SP Series |
Flat and rigid plate; average pore size 0.2 µm; open channel geometry |
Debris tolerance, in-situ cleaning and robust handling |
Attractive for variable feed and operator simplicity |
|
Toray MBR |
PVDF flat-sheet module for sewage and industrial wastewater reuse |
Durability, permeability and integration with broader membrane portfolio |
Strong fit for reuse trains and Asian projects |
|
Mitsubishi STERAPORE |
Hollow-fiber PVDF/PE product families in MF and UF |
Broad material and packaged-system options |
Flexible industrial and municipal application coverage |
|
Kovalus PURON |
Braided PVDF hollow fiber; 0.03 µm nominal pore size |
Fiber strength, outside-in operation and low-energy positioning |
Competes on robustness and retrofit economics |
|
DuPont MemPulse |
Hollow-fiber modules with pulsed plug-flow aeration |
Energy reduction, modular racks and retrofit capability |
Strong in upgrades and nutrient-removal applications |
|
Alfa Laval MFM |
Hollow-sheet design; 0.2 µm filtration; gravity-driven operation |
Combines open channels with compact design |
Differentiated low-pressure option |
|
Asahi Kasei Microza |
PVDF hollow-fiber MF/UF modules and system support |
Chemical resistance and broad industrial filtration experience |
Strong engineering-led sales model |
Table 6. Specifications are drawn from official manufacturer pages and datasheets. They should be validated against the current series-specific datasheet before procurement.
8.2 Where new entrants can compete
- Lower lifecycle aeration demand supported by full-scale data, not only pilot claims.
- Modules designed for retrofit into existing tanks or compatible racks.
- Application-specific pretreatment and cleaning protocols for industrial wastewater.
- Localized assembly, spare parts and technical service in high-growth markets.
- Digital monitoring that links transmembrane pressure, permeability, air demand and cleaning decisions.
- Competitive replacement pricing with transparent warranty and performance testing.
- Open integration with third-party controls, pumps and process equipment rather than closed vendor lock-in.
9. Procurement and Product Selection Criteria
A technically credible MBR module procurement process begins with wastewater characterization and process guarantees, not a catalogue comparison. The following criteria should be specified before commercial evaluation.
|
Evaluation area |
Minimum information required |
Red flag |
|
Influent definition |
Flow profile, COD/BOD, TSS, FOG, salinity, temperature, pH, toxicants, variability |
Single grab sample used as design basis |
|
Target effluent |
Discharge or reuse limits, pathogen and nutrient requirements, downstream RO needs |
Only generic “high-quality effluent” language |
|
Pretreatment |
Screen size, grease/oil removal, equalization, grit and fiber control |
Supplier assumes ideal feed without battery-limit definition |
|
Flux and capacity |
Net sustainable flux at design and peak conditions; redundancy and downtime |
Gross flux quoted without cleaning and relaxation allowance |
|
Aeration and energy |
Specific membrane aeration demand, blower turndown, process energy boundary |
Energy claim without load factor and operating conditions |
|
Cleaning |
Maintenance/recovery cleaning frequency, chemical concentration, waste handling |
Unclear chemical compatibility or no recovery protocol |
|
Module life and warranty |
Integrity test, warranty terms, expected life, replacement lead time and pricing |
Warranty excludes most real operating conditions |
|
Controls and data |
TMP, permeability, DO, flow, air and cleaning analytics; remote support |
Black-box controls with no data access |
|
References |
Comparable full-scale influent, climate, treatment target and operating history |
References are pilot-only or materially different feedwater |
Table 7. Procurement checklist synthesized from industry practice and full-scale operating evidence.
For larger projects, buyers should require a pilot or demonstration phase when feedwater is unusual, fouling risk is high or the supplier lacks directly comparable references. The controls package should also be evaluated as a core process asset. A robust Water Treatment Automation Control System can reduce over-aeration, detect permeability decline early and support condition-based cleaning.
10. Risks and Constraints
|
Risk |
Probability |
Impact |
Mitigation |
|
Influent shock or inadequate pretreatment |
High in industrial applications |
High |
Detailed characterization, equalization, pretreatment guarantees and pilot testing |
|
Energy consumption above bid case |
Medium |
High |
Guaranteed process boundary, blower turndown, utilization sensitivity and metering |
|
Accelerated fouling / frequent cleaning |
Medium-High |
High |
Conservative net flux, verified cleaning protocol and operator training |
|
Vendor lock-in and expensive replacement modules |
Medium |
Medium-High |
Long-term pricing framework, rack compatibility and alternative supply assessment |
|
Membrane damage or integrity failure |
Low-Medium |
High |
Integrity testing, fiber/plate protection, warranty and spare-module strategy |
|
Project financing or tariff weakness |
Medium in emerging markets |
High |
Reuse offtake, phased modular expansion and blended finance |
|
Competition from lower-cost treatment trains |
High where land is available and standards are moderate |
Medium-High |
Lifecycle comparison against CAS/SBR/MBBR plus tertiary filtration |
|
Regulatory delay or inconsistent enforcement |
Medium |
Medium |
Focus on reuse economics and industrial production value, not regulation alone |
Table 8. Risk assessment is analytical and qualitative; it is not a project-specific engineering study.
The most important commercial risk is technology misapplication. MBR is compelling when it solves a valuable constraint. It is less compelling where land is inexpensive, effluent standards are moderate, operator capacity is limited and conventional treatment can achieve compliance with lower lifecycle cost. Suppliers that screen projects honestly are more likely to protect reference quality and long-term margins.
11. Outlook to 2032
11.1 Base case
The base case assumes the total MBR market expands at approximately 7.5-8.5% annually through 2030, broadly consistent with the main published estimates. Municipal reuse, dense urban upgrades and industrial water recovery remain the largest demand engines. Hollow fiber retains the largest revenue share, while flat-sheet modules continue to grow in applications that value open channels, debris tolerance and simpler maintenance.
11.2 Upside case
The upside case would be driven by faster implementation of EU advanced-treatment rules, stronger water-reuse mandates, higher freshwater and discharge costs, and continued reductions in membrane aeration energy. A larger replacement cycle could also accelerate if early installed modules reach end of life and owners upgrade to higher-density or lower-energy designs.
11.3 Downside case
The downside case would arise from municipal capital constraints, weak tariff recovery, slow enforcement, high electricity prices, persistent module-price competition and successful lower-cost alternatives such as MBBR or SBR combined with tertiary filtration. Industrial projects can also be delayed by uncertainty over production demand, reuse economics or feedwater variability.
11.4 Strategic implications
- Module suppliers should publish verified full-scale energy and cleaning data under clearly defined conditions.
- Growth in emerging markets requires local service and application engineering, not only distributor sales.
- Replacement and retrofit capability should be treated as a distinct product strategy.
- Industrial growth will favor suppliers with pretreatment, biology and downstream reuse integration skills.
- Buyers should compare lifetime cost per cubic metre and guaranteed availability rather than module price alone.
- Digital optimization is likely to become a standard differentiator as energy and operator costs rise.
Related Products

Roots Blower Aquaculture Bottom Aerator Microporous Aeration Tube Compatible Three-Lobe High Pressure Energy-Saving Oxygenation
Shandong Dashan Environmental Protection Equipment Co., Ltd.
Yingping Mining Section Open-pit Tailings Backfill Treatment of Goaf Ecological Restoration EPC Project
China Bluestar Lehigh Engineering Corporation
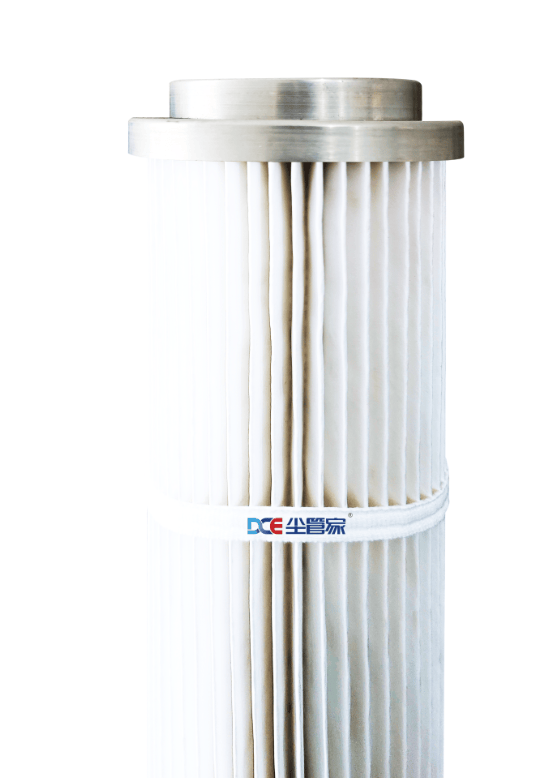
DCE High-Efficiency Energy-Saving Filter Cartridge
Zhejiang Hongsheng New Material Technology Group Co., Ltd.
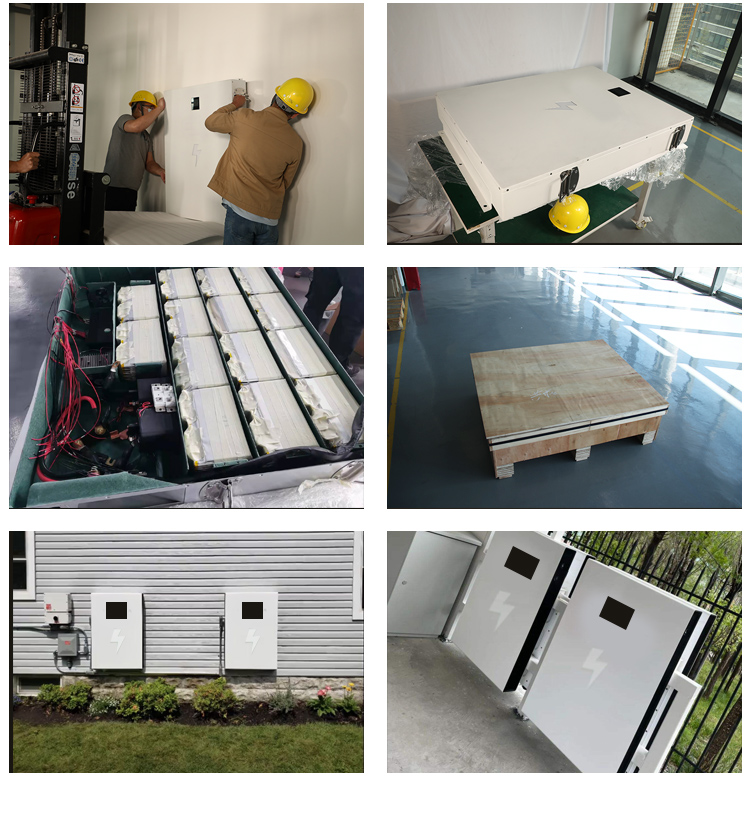
Safe, efficient, intelligent energy storage, creating smart homes and making life more convenient# Home Energy Storage # Supercapacitors # Energy Storage # Wall Mounted # Safe Electricity Use
Gonghe Power Co.,LTD

714CD Series C-Band Weather Radar
Chengdu Zhongdian Jinjiang Information Industry Co., Ltd.