Executive Summary
Global electric vehicle charging infrastructure entered a new scale phase in 2025. Electric car sales exceeded 20 million and represented roughly one quarter of global new-car sales, while public charging deployment accelerated in most major markets. The market is no longer defined simply by the number of charge points. Power level, utilisation, reliability, software interoperability, grid connection and site economics increasingly determine whether an installation creates value.
China remains the centre of gravity. Its public charging stock rose from nearly 3.4 million points at the end of 2024 to more than 4.7 million at the end of 2025, representing over 65% of the global public stock. Europe added about 260,000 public points in 2025 and is shifting toward corridor-based high-power deployment under the Alternative Fuels Infrastructure Regulation. The United States reached roughly 235,000 public light-duty vehicle charging points, but its network remains small relative to its electric-vehicle fleet because home charging plays a larger role.
The commercial opportunity is therefore broader than selling a charging pile. A viable project requires power electronics, switchgear, transformers, civil works, grid upgrades, energy management, payment systems, communications, maintenance and customer acquisition. Hardware prices have generally declined as semiconductor integration and manufacturing scale improved, but installed project cost can remain high where grid connection, trenching, land, demand charges or transformer upgrades dominate.
The strongest near-term segments are high-utilisation public fast charging, fleet and depot charging, destination charging linked to retail or hospitality, and heavy-duty charging pilots. At the same time, low-utilisation sites remain financially fragile. Procurement should prioritise uptime, protocol compatibility, service capability, power-module efficiency, payment compliance and the full installed cost rather than the lowest charger price.
Key Findings
- Global electric car sales exceeded 20 million in 2025, creating a durable demand base for private, workplace, fleet and public charging infrastructure.
- China held more than 65% of global public charging points at the end of 2025 and added about 1.3 million public points during the year.
- Fast and ultra-fast charging is expanding faster than slow public charging; the economic bottleneck is increasingly grid capacity and site utilisation rather than charger hardware alone.
- Europe combines relatively dense public networks with mandatory AFIR deployment and interoperability rules, making compliance, payment transparency and roaming critical supplier requirements.
- The United States had about 235,000 public light-duty charging points in 2025, including nearly 70,000 fast and ultra-fast points, but public capacity per EV remained low.
- Installed cost varies widely because civil works, transformers, switchgear, utility interconnection and demand charges can exceed the cost of the charger cabinet.
- Commercial winners will combine reliable hardware with software, energy management, service networks, financing and attractive site economics.
- For international procurement, connector standards, cybersecurity, metering, certification and local after-sales capability are as important as rated power.
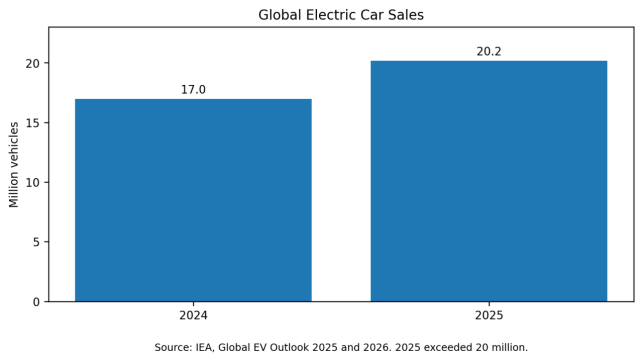
Figure 1. Global electric car sales, 2024-2025.
1. Market Definition and Scope
The EV charging market includes far more than the visible charging dispenser. The complete value chain covers AC wallboxes, public AC posts, DC fast chargers, ultra-fast systems, power modules, cables and connectors, switchgear, transformers, energy storage, solar integration, charging management software, payment services, roaming platforms, installation, commissioning and maintenance.
The product boundary matters when discussing market size or price. A hardware-only quotation for a 120 kW DC charger is not comparable with a turnkey site that includes utility connection, transformer, civil works, multiple dispensers, canopy, software, commissioning and a multi-year service contract. Public market estimates often mix equipment revenue, network services and project investment, so this report prioritises physical deployment, power capacity and procurement economics rather than presenting a single commercial market-size figure from a proprietary source.
Charging demand also differs by use case. Home AC charging is low-power and price-sensitive. Workplace and destination charging value convenience and long dwell time. Highway charging requires high power, redundancy and strong utilisation. Fleet depots need scheduling, load management and predictable energy costs. Heavy-duty vehicles require megawatt-scale connections, larger sites and close coordination with distribution and transmission networks.
2. Global Demand Drivers
The first demand driver is the rapid expansion of the electric vehicle fleet. According to the IEA, global electric car sales exceeded 20 million in 2025, up about 20% from 2024, and electric cars reached a 25% share of new-car sales. The installed fleet now creates recurring infrastructure demand even if annual vehicle sales fluctuate in individual countries.
The second driver is a shift from early-adopter charging patterns to mass-market requirements. Early EV buyers often had private parking and home charging. Later adopters are more likely to live in apartments, depend on curbside or workplace charging, or operate high-mileage commercial vehicles. This changes the required network from a sparse convenience layer to essential transport infrastructure.
The third driver is vehicle charging speed. Larger batteries and 800-volt platforms support higher charging power, encouraging deployment of 150-350 kW light-duty chargers. However, only a portion of the current vehicle fleet can sustain ultra-fast rates, so site economics depend on vehicle mix, dwell time and power sharing rather than nameplate power alone.
The fourth driver is logistics electrification. Electric buses already use large depot-charging networks, while trucks are moving from pilot projects toward early commercial deployment. The IEA estimates that heavy-duty charging capacity will increase nearly sixfold between 2025 and 2035 under current policies, with depot charging remaining dominant.
3. Regional Market Analysis
3.1 China: Scale, Manufacturing and High-Power Expansion
China is the world’s largest charging market and manufacturing base. The IEA reports that public charging points rose from nearly 3.4 million in 2024 to over 4.7 million in 2025. The country represented more than 65% of global public points and more than 75% of worldwide public-network growth during the year.
China also has a very large private and semi-public network. Official data put total charging facilities at 20.092 million by the end of 2025. Public points represent roughly one quarter of the national stock, while the remainder mainly serves homes, residential communities, workplaces and fleets. The average power of a public facility reached 46.5 kW, up 33% year on year, reflecting the transition to faster equipment.
The market benefits from a complete domestic supply chain for power modules, contactors, metering, cables, enclosures and software. Competition has lowered hardware prices, but operator profitability remains uneven. High urban density can support utilisation, while rural or policy-driven sites may depend on subsidies or cross-subsidisation. The next phase will focus on higher reliability, county-level coverage, highway upgrades, orderly charging and integration with distributed energy.
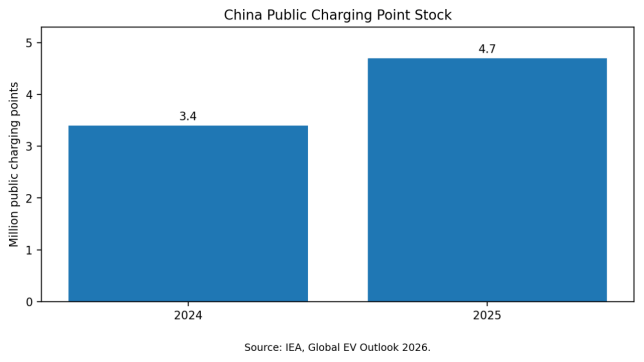
Figure 2. China public charging point growth.
3.2 Europe: Regulation, Interoperability and Corridor Charging
Europe’s public charging stock increased by about 20% in 2025. The Netherlands had around 210,000 public points, Germany 196,000, France 185,000 and the United Kingdom about 116,000. Network density is relatively high, but the market remains fragmented by country, operator, tariff and payment system.
The Alternative Fuels Infrastructure Regulation, applicable since April 2024, creates mandatory national power-output targets and distance-based corridor requirements. For light-duty vehicles, the regulation requires at least 1.3 kW of public charging capacity per registered battery electric vehicle and 0.8 kW per plug-in hybrid. It also strengthens ad-hoc payment, price transparency, interoperability and smart-charging requirements.
European procurement therefore places strong weight on CE compliance, metering, card payment, roaming, accessibility, cybersecurity and OCPP compatibility. High electricity prices and grid queues can constrain operator returns, while retail, motorway and municipal tenders offer large multi-country opportunities. The market is likely to favour suppliers that can provide compliant equipment, software integration and local maintenance rather than low-cost hardware alone.
3.3 United States: Home-Charging Strength and Public-Network Gaps
The United States had around 235,000 public light-duty vehicle charging points at the end of 2025. Fast and ultra-fast points increased about 30% to nearly 70,000, while slow public points exceeded 160,000. Despite this growth, the country held only about 3% of global public points while accounting for around 10% of global electric light-duty vehicles.
The gap partly reflects housing patterns: a large share of U.S. EV owners can charge at home. Public infrastructure is therefore concentrated on highway travel, urban drivers without private parking, workplaces and commercial fleets. Reliability, connector transition, utility interconnection and permitting remain important issues.
The adoption of the North American Charging Standard, now standardised as SAE J3400, is reshaping equipment procurement. New projects often require both J3400 and CCS compatibility during the transition period. Buyers also need UL-listed equipment, National Electrical Code compliance, certified payment systems and service coverage across large geographic areas.
3.4 Emerging Markets
Southeast Asia, India, Latin America and the Middle East are moving from isolated pilots to network formation. EV sales more than doubled in Southeast Asia in 2025, while Brazil, the United Arab Emirates, Saudi Arabia and several smaller markets recorded rapid growth. Charging deployment, however, often lags vehicle imports.
Commercial models differ. In Southeast Asia, shopping centres, fuel retailers and automakers are important network builders. In India, two- and three-wheelers, buses, swapping and fleet depots are more important than passenger-car highway charging alone. In the Middle East, premium high-power sites and government-backed corridors coexist with low current utilisation. In Latin America and Africa, power reliability, imported equipment, foreign exchange and maintenance capacity are major procurement variables.
These markets can offer higher growth but also greater execution risk. Successful suppliers typically need local distributors, remote monitoring, spare-part inventory and equipment adapted to heat, humidity, dust, voltage variation and weak communications networks.
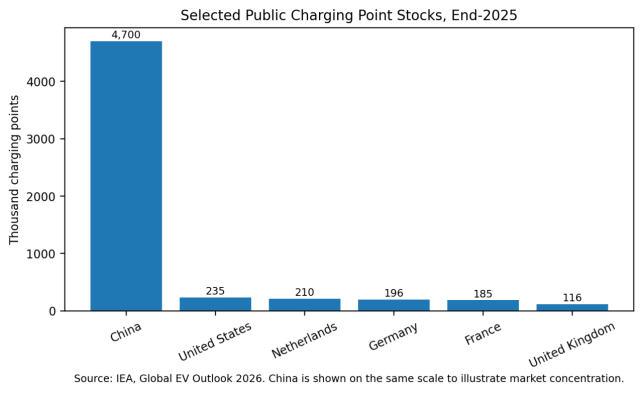
Figure 3. Selected public charging networks at end-2025.
4. Technology Segmentation
|
Segment |
Typical Power |
Primary Use |
Advantages |
Key Constraints |
Main Buying Metric |
|
Home AC |
3-22 kW |
Residential |
Low equipment and grid cost |
Parking access, installation |
Safety, connectivity, total installed cost |
|
Public/destination AC |
7-22 kW |
Workplace, retail, hotels |
Uses long dwell time |
Low energy throughput per port |
Uptime, access control, software fee |
|
DC fast |
50-150 kW |
Urban, fleet, intercity |
Higher utilisation and turnover |
Grid and demand charges |
Delivered energy, uptime, efficiency |
|
Ultra-fast DC |
150-400 kW |
Highways, premium hubs |
Shorter sessions, future-ready |
High capex and grid capacity |
Peak utilisation, power sharing, redundancy |
|
Depot charging |
20-350 kW |
Buses, vans, trucks |
Predictable schedules |
Complex load management |
Fleet availability and energy cost |
|
Megawatt charging |
0.75-3+ MW |
Heavy-duty en-route |
Supports long-haul trucks |
Major grid and cooling needs |
Site power, utilisation, interoperability |
5. Price and Installed-Cost Economics
Charger hardware prices have generally declined over the past several years, particularly for standard AC products and modular DC cabinets. Scale manufacturing, semiconductor integration and competition from Chinese suppliers have reduced cost per kilowatt. Nevertheless, the final installed cost has not fallen at the same rate in many countries.
For an AC project, electrical panel upgrades, trenching, bollards, communications and labour can equal or exceed the wallbox price. For a fast-charging hub, utility interconnection, transformer, switchgear, civil works, permitting and site preparation can dominate the budget. A remote highway location may also require battery storage or a dedicated medium-voltage connection.
Price comparisons must therefore use a common scope: equipment-only, delivered-duty-paid, installed and commissioned, or full turnkey. The same rated charger can differ in cost because of output architecture, simultaneous charging, cable cooling, metering, payment terminal, screen, ingress protection, operating temperature, certification, warranty and software licence.
Indicative Installed-Cost Framework
|
Cost Block |
Typical Components |
Why It Varies |
Procurement Control |
|
Charging equipment |
Power modules, dispenser, cable, connector, controller |
Power, certification, redundancy, display and payment |
Standardise specifications and compare efficiency |
|
Electrical balance of plant |
Transformer, switchgear, panel, protection, cabling |
Existing site capacity and utility rules |
Complete load study before tender |
|
Civil and site works |
Trenching, foundations, bollards, canopy, signage |
Ground conditions, distance and accessibility |
Use site-specific bill of quantities |
|
Grid connection |
Utility study, service upgrade, meter, substation |
Queue, voltage level, network reinforcement |
Engage utility before equipment order |
|
Software and communications |
CSMS, payment, roaming, SIM/data, APIs |
Business model and integration depth |
Define OCPP, OCPI, uptime and data ownership |
|
Operations and maintenance |
Preventive service, spares, call centre, field repair |
Geographic coverage and SLA |
Price a multi-year service agreement |
|
Energy and demand charges |
Electricity, capacity tariff, peak demand |
Tariff structure and utilisation |
Use load management, storage and tariffs |
6. Business Models and Profitability
Public charging profitability is driven by utilisation, charging margin and fixed site cost. A charger with high rated power but few sessions can generate a poor return because depreciation, lease, software, maintenance and demand charges continue even when no energy is sold. Conversely, a lower-power site with steady fleet demand can be highly attractive.
Operators use several revenue models: per-kWh charging, per-minute charging, session fees, subscriptions, parking revenue, retail cross-sales, fleet contracts and advertising. Regulation increasingly favours transparent per-kWh pricing and ad-hoc payment. The commercial model should match local electricity tariffs and customer behaviour.
Fleet depots offer stronger demand visibility. The operator can forecast vehicle arrival, dwell time and energy required, then minimise peak demand through managed charging. Public highway sites have higher revenue potential but require traffic, amenities and enough chargers to avoid queues. Destination charging may be justified by customer retention even when direct charging margin is low.
Battery storage can reduce grid-upgrade requirements and peak charges, but it introduces additional capital cost, degradation and control complexity. Solar generation improves sustainability and can offset daytime energy, although its contribution is limited relative to the instantaneous demand of ultra-fast charging.
7. Charging Capacity, Not Just Charger Count
Counting ports alone can misrepresent network adequacy. The IEA estimates average public charging capacity of about 4.5 kW per electric light-duty vehicle globally in 2025. China was close to 6 kW per EV, the European Union around 3 kW, the United States slightly above 1.5 kW and Korea above 9 kW.
A market with many 7 kW AC points can have fewer usable charging opportunities for long-distance travel than a smaller network of high-power hubs. Conversely, replacing all AC charging with ultra-fast equipment would be economically inefficient because most vehicles remain parked for long periods. The optimal mix depends on housing, travel patterns, fleet composition, electricity tariffs and road geography.
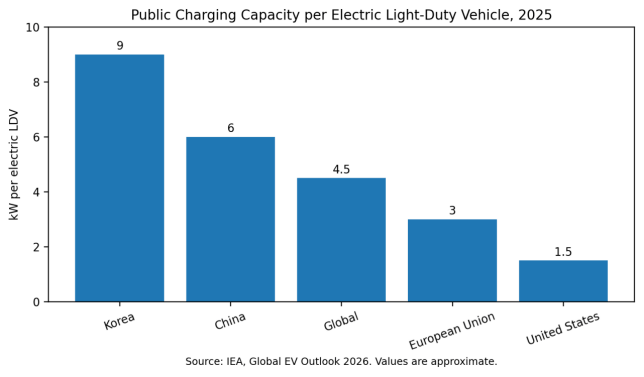
Figure 4. Public charging capacity per electric light-duty vehicle.
8. Supply Chain and International Trade
The charging equipment supply chain includes silicon and silicon-carbide power semiconductors, control boards, relays, contactors, meters, fans or liquid-cooling systems, connectors, cables, touchscreens and metal enclosures. Power-module availability and certification can influence lead time, but the industry is less constrained than transformers or grid switchgear because modular components are produced at scale.
China is the largest hardware manufacturing base and a major exporter of AC chargers, DC cabinets and power modules. European and North American markets remain accessible but require product redesign and certification. Connector standards, grid codes, payment rules, cybersecurity and localisation can be more significant barriers than tariffs.
International buyers should confirm whether a supplier owns the core power module and software stack or assembles third-party components. They should also assess firmware update policy, cloud hosting, API availability, spare-part continuity and the ability to provide remote diagnostics. A low-price charger can become stranded if its backend service is discontinued or its protocol implementation is incomplete.
9. Standards and Compliance
|
Standard/Protocol |
Role |
Procurement Significance |
|
IEC 61851 |
Conductive charging system requirements used in many international markets |
Verify applicable version, certification, interoperability testing and local regulatory acceptance. |
|
IEC 62196 |
Plugs, socket-outlets, vehicle connectors and inlets |
Verify applicable version, certification, interoperability testing and local regulatory acceptance. |
|
CCS Combo 2 |
Dominant DC connector for Europe and many global markets |
Verify applicable version, certification, interoperability testing and local regulatory acceptance. |
|
SAE J3400 |
North American Charging Standard transition in the United States and Canada |
Verify applicable version, certification, interoperability testing and local regulatory acceptance. |
|
CHAdeMO |
Legacy and selected Asian applications; declining in many passenger-car markets |
Verify applicable version, certification, interoperability testing and local regulatory acceptance. |
|
GB/T |
Chinese national charging interface and communication standards |
Verify applicable version, certification, interoperability testing and local regulatory acceptance. |
|
OCPP |
Open protocol connecting chargers to charging-management systems |
Verify applicable version, certification, interoperability testing and local regulatory acceptance. |
|
OCPI |
Roaming and information exchange between charging-service platforms |
Verify applicable version, certification, interoperability testing and local regulatory acceptance. |
|
ISO 15118 |
Vehicle-to-charger communication, Plug & Charge and bidirectional functions |
Verify applicable version, certification, interoperability testing and local regulatory acceptance. |
10. Competitive Landscape
The industry includes electrical-equipment groups, dedicated charger manufacturers, automakers, oil and fuel retailers, utilities, charging-network operators and software platforms. Competitive advantage differs by segment. Hardware groups benefit from power-electronics engineering and distribution channels; operators control sites and customers; automakers can integrate navigation and payment; utilities control grid planning; software providers enable roaming and energy management.
The market is shifting from single-product competition to integrated delivery. Hardware margins are under pressure, especially in AC charging and standard DC cabinets. Value is migrating toward site development, grid services, software subscriptions, uptime guarantees, fleet optimisation and energy trading.
Consolidation is likely among charging operators with low utilisation or high capital requirements. Equipment vendors with weak service networks may also struggle as customers demand multi-year warranties and rapid field repair. Scale alone is insufficient: suppliers must balance cost, compliance, reliability and local support.
11. Procurement Recommendations
Define the use case before selecting power: Specify vehicle dwell time, battery size, daily energy and traffic rather than buying the highest kW rating.
Separate hardware and site costs: Request transparent pricing for charger, transformer, switchgear, civil works, utility connection, software and service.
Verify interoperability: Require tested OCPP implementation, roaming interfaces, payment compliance and vehicle compatibility.
Evaluate uptime architecture: Assess module redundancy, remote reset, diagnostic data, spare parts and field-service response.
Model electricity tariffs: Include demand charges, time-of-use rates, power factor and potential storage in the business case.
Check environmental suitability: Confirm temperature, altitude, humidity, salt spray, dust, flood and vandalism requirements.
Secure data and cybersecurity: Define data ownership, cloud location, access control, encryption, patching and incident response.
Use lifecycle cost: Compare efficiency, maintenance, software fees, warranty, expected utilisation and replacement risk.
Plan connector transition: In North America, consider mixed J3400/CCS deployment; elsewhere confirm CCS2, GB/T or local requirements.
Engage the utility early: Grid study and service upgrade timing can determine the project schedule more than charger delivery.
12. Market Outlook to 2035
Under current policies, the IEA expects China’s public charging stock to approach 18 million points by 2035, nearly four times the 2025 level. Europe is projected to exceed 4.3 million public points, while the United States rises from about 235,000 to more than 420,000. These figures indicate continued deployment but also a gradual increase in vehicles served per point as charger speed and utilisation improve.
Fast and ultra-fast charging will gain share, particularly on highways and for commercial fleets. The IEA projects more than 10 million public fast and ultra-fast chargers worldwide by 2035 under current policies. Heavy-duty charging will create a second growth wave, although depot charging will remain much larger than public truck charging.
The market outlook is positive, but revenue growth will not be evenly distributed. Hardware commoditisation will continue in standard products. Grid connection, software, operations and energy services will capture a growing share of project value. Markets with rapid EV imports but limited infrastructure can grow quickly, while mature markets will focus on reliability, capacity upgrades and replacement of first-generation equipment.
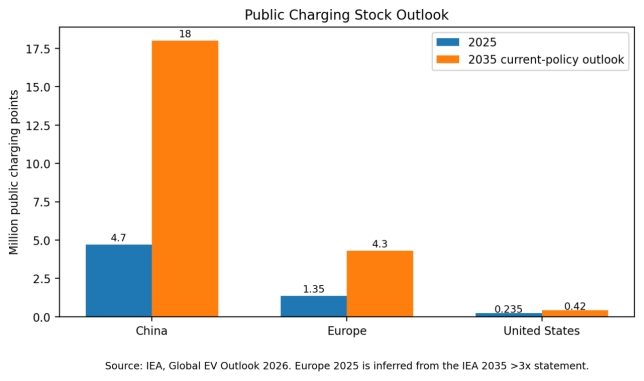
Figure 5. Selected public charging stock outlook to 2035.
Conclusion
The global EV charging infrastructure market is expanding from an equipment category into a core component of the electricity and transport systems. Deployment is supported by more than 20 million annual electric-car sales, rising fleet electrification and stronger infrastructure regulation. China provides manufacturing scale, Europe provides regulatory momentum, and the United States offers a large but structurally different opportunity shaped by home charging and corridor demand.
The commercial challenge is no longer whether chargers will be installed, but where, at what power, with what utilisation and under which grid conditions. Hardware price remains important, yet lifecycle economics depend on interconnection, energy tariffs, uptime, software and service. Buyers that focus only on equipment price risk selecting the wrong power level, underestimating site cost or creating an unreliable network.
For manufacturers and project developers, the strongest strategy is to combine efficient and standards-compliant hardware with local engineering, interoperable software, transparent payment, remote monitoring and rapid maintenance. The market will continue to grow, but durable value will concentrate in solutions that deliver usable energy reliably rather than simply adding charge-point counts.