1. Global Market Size and Growth
Public market estimates differ substantially because some studies cover only stationary industrial air compressors, while others include portable equipment, gas compressors, oil-and-gas process units, or broader end-use categories. Four industrial-focused public summaries place the 2025 market at approximately USD 19.0-20.1 billion. A broader Grand View Research definition reports USD 27.8 billion. For planning purposes, the industrial-air-compressor market should be treated as a roughly USD 20 billion market in 2025, with a broader addressable air-compressor universe in the high-USD-20-billion range.
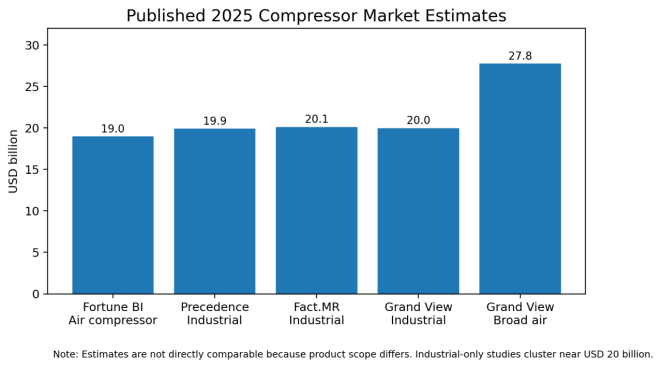
Figure 1. Published 2025 Compressor Market Estimates
Source: Grand View Research; Fortune Business Insights; Precedence Research; Fact.MR. Values shown exactly as published in accessible summaries.
Forecasts are more consistent than absolute market values. Public projections generally indicate annual growth of 4-5%, driven by industrial automation, infrastructure investment, oil and gas processing, stricter efficiency expectations, expansion of cooling, and replacement of aging installed equipment. The forecast range should still be treated cautiously because it reflects commercial market-research methodologies rather than a harmonized official statistical series.
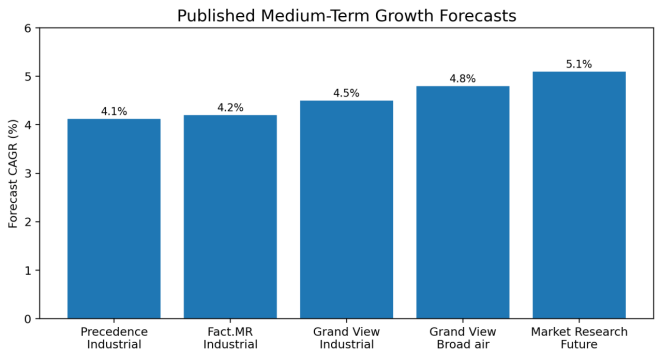
Figure 2. Published Medium-Term Compressor Market Growth Forecasts
Source: Accessible public summaries from Precedence Research, Fact.MR, Grand View Research and Market Research Future.
|
Market boundary |
Included equipment |
Typical size signal |
Analytical use |
|
Industrial air compressors |
Stationary screw, reciprocating, centrifugal, scroll and related air-treatment packages |
About USD 19-20bn in 2025 |
Best headline for factory compressed-air demand |
|
Broad air-compressor market |
Industrial plus wider portable and application coverage, depending on publisher |
Up to about USD 28bn in 2025 |
Useful as upper-bound addressable market |
|
Process gas compressors |
Engineered centrifugal, reciprocating, diaphragm and specialty-gas trains |
Often embedded in broader compressor or turbomachinery studies |
Analyze by project pipeline and end market rather than a single global number |
|
Refrigeration compressors |
HVAC, cold chain, appliances and industrial refrigeration |
Usually reported separately |
Treat as adjacent market because technology, channels and regulation differ |
2. Current Market Stage and Industry Financial Signal
Atlas Copco provides a useful, though not market-wide, indicator because Compressor Technique is one of the largest global businesses dedicated to air and gas compression. Its 2025 quarterly Compressor Technique revenue remained close to SEK 19-20 billion, broadly stable versus 2024. Operating margins remained exceptionally high at roughly 24-25%, confirming the economic value of brand, installed base, service, controls and product breadth. The modest softening from 2024 peaks also indicates that the market is mature and cyclical rather than uniformly accelerating.
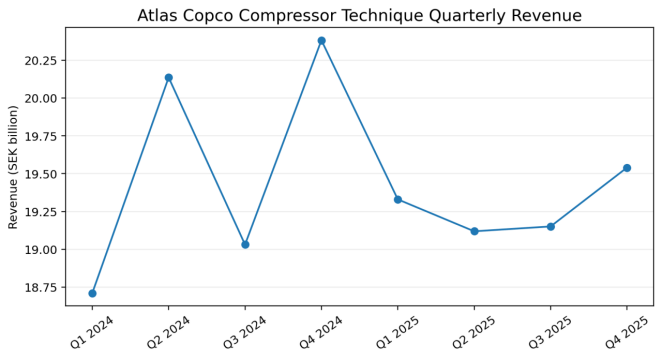
Figure 3. Atlas Copco Compressor Technique Quarterly Revenue
Source: Atlas Copco Annual Report 2025; SEK values converted from MSEK to SEK billion.
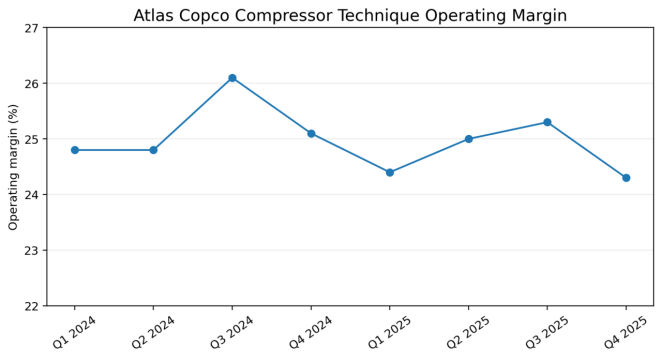
Figure 4. Atlas Copco Compressor Technique Operating Margin
Source: Atlas Copco Annual Report 2025.
3. Regional Market Structure
|
Region |
Demand profile |
Entry conditions |
Priority opportunities |
|
North America |
Large installed base; manufacturing, food, chemicals, energy and service demand |
Strong distributor/service expectations; tariffs and domestic sourcing can matter |
Oil-free systems, upgrades, connected controls, rentals and lifecycle service |
|
Europe |
Efficiency-led replacement; strict machinery, pressure-equipment and environmental compliance |
CE conformity, EN/ISO documentation, refrigerant and ecodesign rules in adjacent cooling markets |
Premium efficiency, heat recovery, low-noise and oil-free packages |
|
China |
Largest manufacturing ecosystem and intense price competition |
Local production and channel coverage are often decisive |
High-volume screw compressors, electronics-grade oil-free systems and export manufacturing |
|
India |
Rapid industrialization, infrastructure and localization push |
Price sensitivity plus need for local assembly and service |
Mid-market screw compressors, cement, steel, automotive and infrastructure |
|
Middle East |
Oil and gas, LNG, petrochemicals, water, hydrogen and mega-project demand |
Project qualification, EPC relationships and long tender cycles |
Engineered process gas, centrifugal, reciprocating and high-pressure packages |
|
Southeast Asia |
Fragmented but growing manufacturing base |
Country-specific standards, distributor quality and spare-parts logistics |
Electronics, food, palm oil, industrial parks and general manufacturing |
|
Latin America |
Mining, food, oil and gas and replacement demand |
Currency volatility, financing and import complexity |
Durable machines, service-led models, mining and process applications |
|
Africa |
Mining, energy, water and infrastructure needs, but uneven bankability |
Payment security, service reach and logistics are critical |
Mining, mobile/portable units, energy projects and localized service hubs |
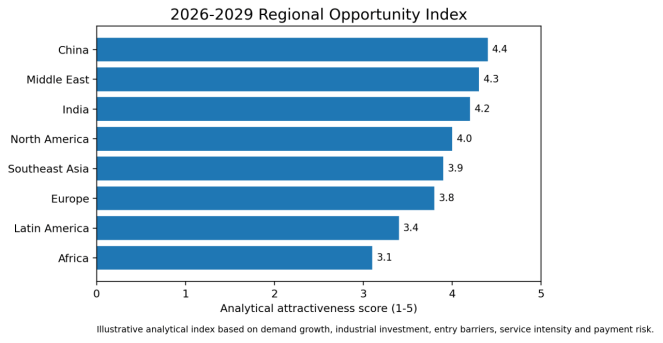
Figure 5. Regional Opportunity Index, 2026-2029
Source: Author analytical index; illustrative, not a measured market-share forecast.
Regional Interpretation
China remains the center of manufacturing scale and price formation. Its supplier base spans low-cost piston machines, mainstream screw compressors, oil-free equipment and increasingly sophisticated centrifugal and process systems. This supports export competitiveness but also compresses margins in standardized categories. India and Southeast Asia are attractive for incremental volume, although local service and distribution are essential because downtime risk outweighs small upfront price differences for many buyers.
The Middle East is strategically important for high-value engineered units. Oil and gas, LNG, petrochemicals, desalination, hydrogen and carbon-management projects generate demand for API-oriented centrifugal and reciprocating equipment, but opportunities are EPC- and qualification-led rather than simple catalogue exports. North America and Europe reward high efficiency, reliability and service, yet impose stronger documentation, product liability and compliance burdens.
4. Technology Roadmap and Product Evolution
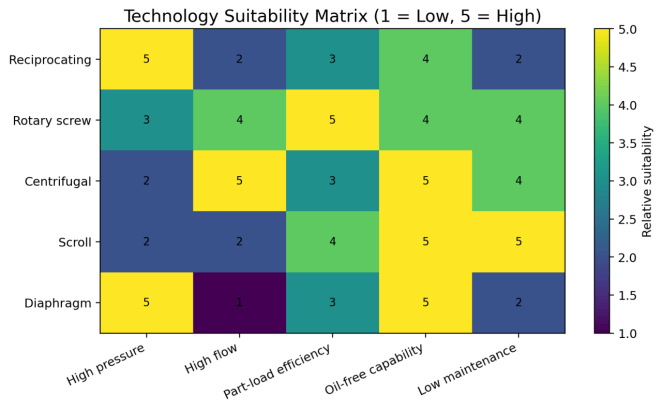
Figure 6. Compressor Technology Suitability Matrix
Source: Engineering synthesis for comparative analysis; application-specific design may differ.
|
Technology |
Best-fit duty |
Strengths |
Limitations / risks |
|
Reciprocating |
High pressure, lower flow, intermittent or flexible process duty |
High pressure ratio; proven gas handling; flexible staging |
Pulsation, vibration, maintenance intensity and larger footprint |
|
Rotary screw |
Continuous factory air and many medium-pressure duties |
Wide operating range; compact; strong part-load options with variable-speed drive |
Oil carryover risk in lubricated units; efficiency falls when poorly sized |
|
Centrifugal |
Large, steady flow in plants, pipelines and process services |
Oil-free compression path; high flow; low vibration; strong efficiency near design point |
Surge control, lower turndown and high engineering complexity |
|
Scroll |
Small oil-free systems, laboratories, medical and light industrial duty |
Quiet, compact and low maintenance |
Limited flow and pressure range |
|
Diaphragm |
Hydrogen, toxic, high-purity and leak-sensitive gases |
Hermetic separation and very low contamination |
Lower capacity, specialized maintenance and higher unit cost |
Key Technology Directions
- Variable-speed drives and multi-compressor sequencing to improve part-load efficiency.
- Integrated dryers, filters, heat recovery and energy-management controls rather than stand-alone compressor sales.
- Oil-free certification and contamination control for pharmaceuticals, food, electronics and medical applications.
- Permanent-magnet motors, improved air ends, low-loss valves and advanced impeller design.
- Remote monitoring, predictive maintenance and outcome-based service contracts.
- Hydrogen-compatible sealing, materials and high-pressure architectures; CO2 compression optimized for dense-phase transport and carbon capture.
- Electrification of large process trains where grid capacity and project economics support electric drives.
5. Cost and Price Trends
Compressor procurement prices are shaped by power rating, pressure ratio, flow, gas composition, metallurgy, oil-free requirement, hazardous-area classification, driver type, controls, treatment equipment, noise limits and contractual testing. Standard industrial screw compressors are increasingly commoditized, while engineered gas compressors retain substantial design and project premiums. Buyers should avoid comparing equipment-only ex-works quotations with packaged, tested, delivered, installed or commissioned systems.
Electricity normally dominates lifecycle economics. The U.S. Department of Energy states that compressed-air systems offer significant energy-saving potential and notes that more than 80% of input energy can be lost as heat. This does not mean 80% of a buyer’s cost is automatically wasted; rather, it highlights why system design, leak reduction, pressure optimization, heat recovery and correct part-load control are central to total cost of ownership.
|
Cost driver |
Effect on equipment price |
Effect on lifecycle cost |
Buyer response |
|
Motor and air-end efficiency |
Higher-efficiency packages usually carry a premium |
Can materially reduce annual electricity use |
Model full-load and part-load kWh under actual duty cycle |
|
Variable-speed drive |
Raises initial cost and control complexity |
Usually beneficial under variable demand; may be unnecessary at stable base load |
Compare specific power across the full operating map |
|
Oil-free architecture |
Higher capital cost and tighter tolerances |
Avoids contamination risk and downstream treatment cost |
Use only where process purity justifies premium |
|
Dryers and filtration |
Adds package cost, pressure drop and maintenance |
Reduces moisture/contamination risk but consumes energy |
Specify required dew point and air quality, not excessive treatment |
|
Local service and spares |
May raise quoted price |
Reduces downtime and emergency logistics cost |
Evaluate response time, parts stock and technician competence |
|
Tariffs and freight |
Can materially change delivered price |
Raises inventory and replacement-part cost |
Compare landed and supported cost, not FOB price alone |
|
Project gas composition |
Special materials, seals and testing increase price |
Reliability and safety dominate economics |
Require gas analysis, corrosion review and performance guarantees |
6. Value Chain and Supply Structure
The value chain begins with castings, forgings, motors, bearings, valves, rotors, impellers, seals, controls and power electronics. Midstream suppliers assemble air ends and complete packages, while downstream value is captured through engineering, distribution, installation, commissioning, service, overhaul, rentals and energy optimization. Standard components are increasingly sourced globally, but final package design, control logic, testing and service remain important differentiators.
|
Value-chain segment |
Competitive intensity |
Bargaining power trend |
Opportunity |
|
Standard piston and small screw machines |
Very high |
Shifting toward buyers and distributors |
Scale, private label and low-cost channels |
|
Premium rotary screw and oil-free air |
High but differentiated |
Stable for strong brands with service coverage |
Efficiency, controls, food/pharma/electronics qualification |
|
Centrifugal and process gas packages |
Moderate; qualification-heavy |
Supplier power remains stronger |
Engineering, project references and long-term service |
|
Controls and digital optimization |
Growing competition |
Increasing strategic value |
Fleet optimization, predictive maintenance and energy reporting |
|
Aftermarket parts and service |
Fragmented but sticky |
Strong where installed-base access is controlled |
Service hubs, overhaul, audits and uptime contracts |
|
Hydrogen and CO2 compression |
Early and specialized |
Strong for validated technology |
High-pressure, leak-tight, materials and project integration expertise |
7. Competitive Landscape
The global market is led by diversified compression and industrial-technology groups, specialist process-compressor manufacturers and a large regional supplier base. Relevant global names include Atlas Copco, Ingersoll Rand, Kaeser, Hitachi Industrial Equipment Systems, Kobelco, ELGi, Sullair/Hitachi, Siemens Energy, Baker Hughes, Burckhardt Compression, MAN Energy Solutions, Howden/Chart Industries and numerous Chinese manufacturers. Competitive position varies sharply by product class; leadership in factory air does not automatically imply leadership in hydrogen, LNG, pipeline or refrigeration service.
Tier-one suppliers compete on verified performance, installed references, efficiency, global service, documentation, warranty and financing credibility. Tier-two suppliers can be highly competitive in standard machines, but buyers must verify specific power, free-air delivery, material quality, controls, noise, duty rating and service capacity. In engineered projects, bankability and execution history usually outweigh a low initial bid.
8. International Market Entry and Export Opportunities
- Direct export is most viable for standardized machines where a qualified local distributor can provide commissioning, warranty and spare parts.
- Local assembly becomes more important in India, China, the Middle East and markets with tariffs, local-content rules or public-procurement preferences.
- EPC partnerships are essential for process gas, LNG, petrochemical, hydrogen, CO2 and large centrifugal projects.
- SMEs can enter through air ends, filters, dryers, controls, heat-recovery modules, condition monitoring, specialty valves, skids and maintenance services.
- Export documentation should include verified ISO 1217 performance for displacement compressors where applicable, electrical and pressure-equipment compliance, hazardous-area documentation, material certificates, noise data and local-language manuals.
- A service center or parts hub often creates more competitive advantage than a small reduction in factory price.
9. Procurement and Project Implications
|
Procurement check |
Why it matters |
Minimum evidence |
|
Performance basis |
Flow and power claims vary with inlet conditions, pressure and test method |
Guaranteed free-air delivery, specific power and stated ISO/API test basis |
|
Duty profile |
Oversized machines waste power and cycle excessively |
Hourly or seasonal demand profile and turndown analysis |
|
Air/gas quality |
Oil, water and particles can damage product or process |
Required purity class, dew point and filtration design |
|
Energy model |
Purchase price may be a small part of lifecycle cost |
Annual kWh model under actual load and electricity tariff |
|
Reliability and maintainability |
Downtime can exceed energy savings or price difference |
Mean-time data, service intervals, spare-parts list and access plan |
|
Scope boundary |
Quotes may omit dryers, controls, coolers, installation or testing |
Detailed battery limits and exclusions |
|
Warranty and guarantees |
Poorly drafted guarantees are difficult to enforce |
Guaranteed flow, power, vibration, oil carryover, availability and remedies |
|
Local service |
Remote support alone may be inadequate |
Named technicians, response time, stock location and escalation procedure |
Recommended Bid Evaluation Logic
A robust evaluation should weight lifecycle electricity cost, guaranteed performance, service availability, expected downtime, spares, compliance and scope completeness rather than awarding solely on initial price. For large systems, bidders should provide a normalized specific-power curve, not only a full-load point. For process gas systems, the evaluation must also cover gas composition, molecular weight range, suction conditions, anti-surge or capacity control, materials, seal system, torsional analysis, pulsation analysis where relevant, and performance-test methodology.
10. Risks and Mitigation
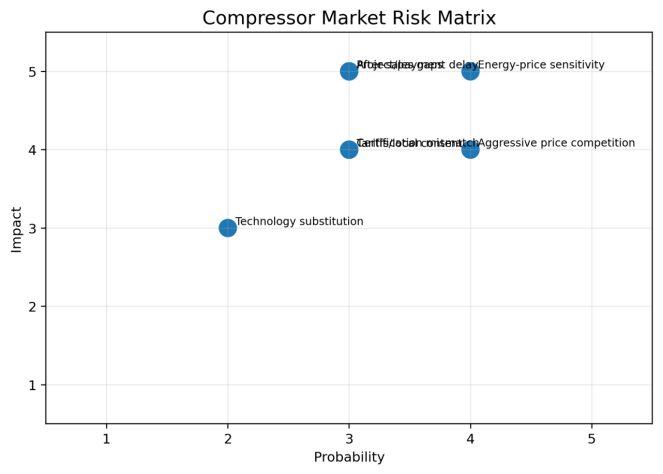
Figure 7. Compressor Market Risk Matrix
Source: Author assessment; qualitative and illustrative.
|
Risk |
Exposure |
Mitigation |
|
Energy-price volatility |
Changes lifecycle payback and buyer urgency |
Use multiple tariff scenarios and guaranteed specific power |
|
Aggressive bidding |
Can reduce quality, documentation and service provision |
Use technical pass/fail gates and lifecycle scoring |
|
Trade barriers and local content |
Raises landed cost and can exclude imports |
Local assembly, regional sourcing and distributor partnerships |
|
Certification mismatch |
Can delay customs clearance or commissioning |
Confirm standards and conformity route before order |
|
After-sales weakness |
Creates long downtime and reputational damage |
Contractual response times, parts stock and training |
|
Project delay and payment risk |
Especially relevant to large EPC and emerging markets |
Milestone payments, guarantees, export credit and counterparty checks |
|
Hydrogen/CO2 technology risk |
New duty conditions and evolving project designs |
Pilot references, materials validation and conservative guarantees |
11. Conclusion and Outlook
The global compressor market is expected to continue expanding at a moderate pace through the late 2020s, supported by industrial investment, equipment replacement, cooling demand, automation and new gas-handling applications. Growth quality is changing: standardized machines will remain volume-heavy but margin-sensitive, while value shifts toward energy efficiency, oil-free operation, controls, service and engineered gas compression.
Asia-Pacific will remain the largest production and consumption base. China will continue to influence global supply and pricing, while India and Southeast Asia provide attractive growth for localized suppliers. The Middle East offers high-value opportunities in oil and gas, petrochemicals, LNG, water, hydrogen and carbon management, but suppliers must navigate long project cycles and demanding qualification. North America and Europe remain important for premium upgrades, efficiency, digital service and replacement demand.
The best-positioned companies will combine credible efficiency data, application engineering, regional service, digital optimization and disciplined channel strategy. Buyers should prioritize verified performance and lifecycle economics. Suppliers that compete only on upfront price will face increasing pressure; those that control the installed-base relationship and solve energy, uptime and process-risk problems should retain stronger profitability.