China's Sulfur Imports Plunge 57.7% in H1 2026, Prices Surge 148%
en.Wedoany.com Reported - In the first half of 2026, China's sulfur market experienced a complete transmission chain of sharp import declines, price surges, output drops, and export stagnation. Data from the National Bureau of Statistics and China Customs show that domestic sulfuric acid production faces cost pressures, with regional divergence intensifying.
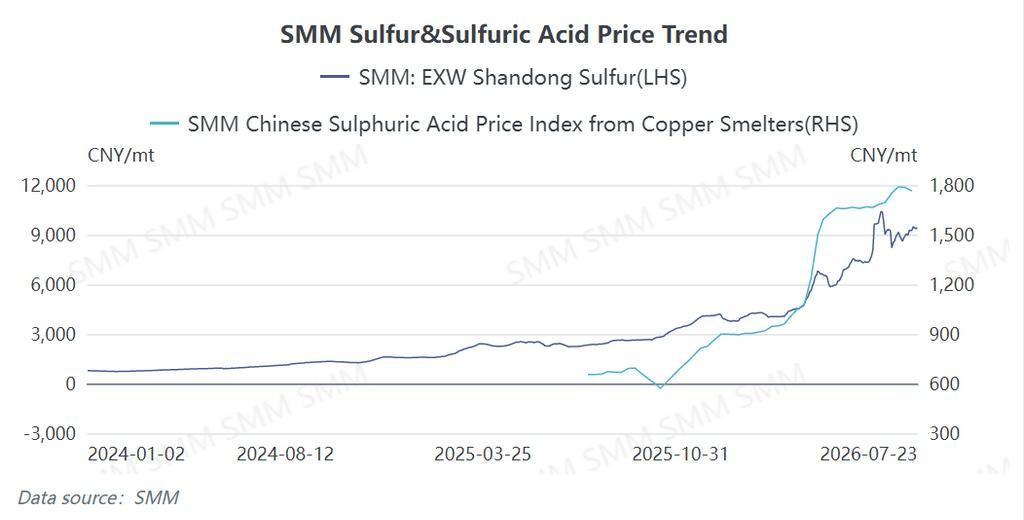
In terms of prices, sulfur first rose and then fell, with sulfuric acid lagging behind. The SMM sulfur price (ex-tank in Shandong) started at 4,180 yuan/ton at the beginning of the year, going through five stages: a mild start, a turning point in March, acceleration in April-May, a peak in June, and a pullback in July. Prices fluctuated in the 4,000-4,200 yuan/ton range in January-February. Geopolitical tensions fully erupted in March, pushing prices from 4,150 yuan/ton to 6,090 yuan/ton. The price center shifted upward to 6,500-7,800 yuan/ton in April-May. On June 16, prices hit a historical high of 10,353.5 yuan/ton, up 148% from the beginning of the year. On July 23, prices closed at 9,428.5 yuan/ton, about 1,000 yuan/ton lower than the peak. The SMM copper smelting acid index rose from 919.5 yuan/ton at the start of the year, rapidly climbing to 1,235.5 yuan/ton in March driven by the sulfur surge, reaching 1,657 yuan/ton in April, maintaining a 1,650-1,750 yuan/ton range in May-June, hitting 1,789 yuan/ton in early July, and then retreating to 1,763 yuan/ton. Sulfuric acid rose by about 92%, less than half of sulfur's increase, reflecting the cost advantage of smelting acid over sulfur-burning acid.
In terms of output, national production fell 1.6% year-on-year, with regional divergence intensifying. According to the National Bureau of Statistics, China's cumulative sulfuric acid production (100% H₂SO₄ basis) from January to May 2026 was 44.293 million tons, down 1.6% year-on-year. The cumulative growth rate dropped from 6.2% in March to -2.2% in April and -1.6% in May. May output was approximately 7.216 million tons, down about 19.4% year-on-year. By region, the top five producing provinces were Yunnan (6.6809 million tons), Shandong (3.665 million tons), Anhui (3.5935 million tons), Guizhou (2.9048 million tons), and Hubei (2.7395 million tons). Anhui benefited from new smelting acid capacity, growing 20% year-on-year, the largest increase among provinces. Hubei fell 53% year-on-year, mainly due to low phosphate fertilizer operating rates and maintenance shutdowns. Yunnan saw a slight decline of 0.7%, while Guizhou fell 6.8%. Changes in Inner Mongolia, Sichuan, and Jiangxi were relatively small. Against the backdrop of historically high sulfur prices, smelting acid (a byproduct of copper and zinc smelting) has a clear cost advantage over sulfur-burning acid. Provinces with large copper smelting bases (such as Anhui) saw output growth, while regions with a higher share of sulfur-burning acid capacity (Hubei, Guizhou, Yunnan) reduced output under cost pressure.
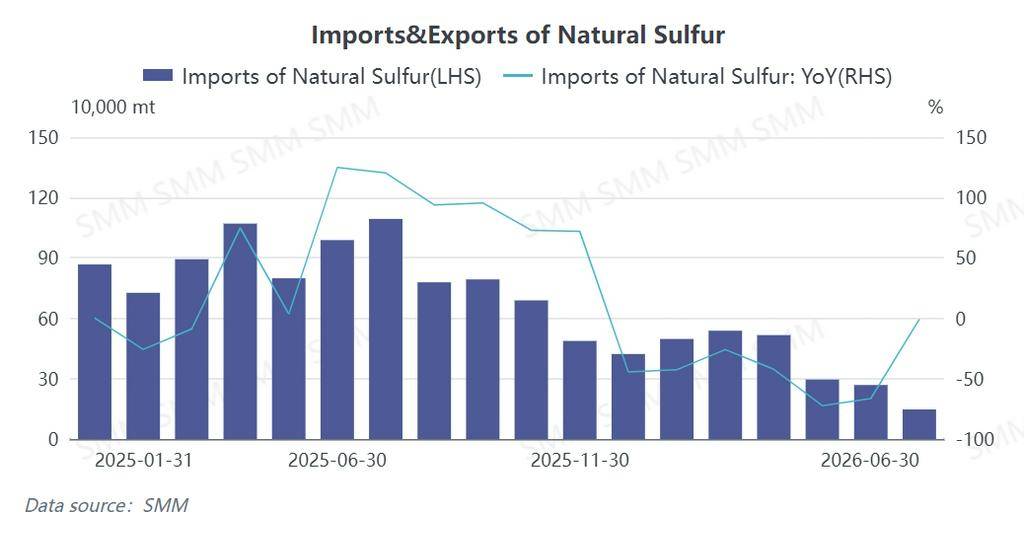
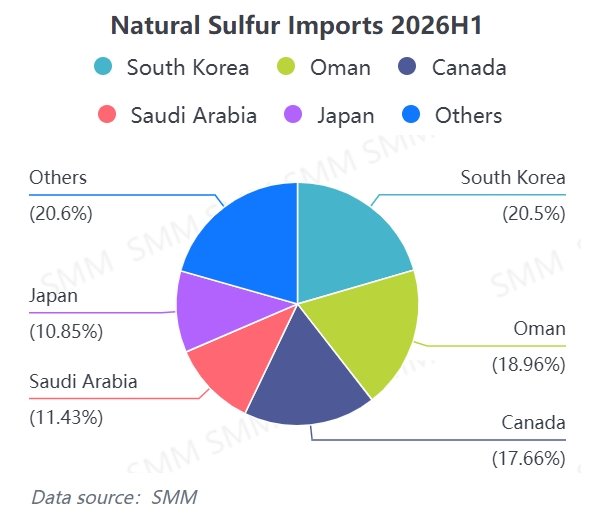
In sulfur trade, imports halved, and supply sources were reshaped. Customs data show that China's natural sulfur imports from January to June 2026 were 497,200 tons, 538,100 tons, 516,300 tons, 295,500 tons, 268,300 tons, and 147,000 tons respectively, totaling approximately 2.262 million tons in the first half. Including refined sulfur, the comparable figure for H1 2025 was about 5.345 million tons, a year-on-year decline of about 57.7% in 2026. Average monthly imports were about 517,000 tons in January-March, plummeting 43% month-on-month in April, and further dropping to about 200,000 tons in May-June. The 147,000 tons in June was one of the lowest monthly levels in recent years. The import source landscape underwent fundamental changes. Comparing January and June: total imports from five Middle Eastern countries (UAE, Saudi Arabia, Kuwait, Qatar, Oman) fell from 202,500 tons to 7,700 tons, with the share dropping from 40.7% to 5.2%. Canadian exports to China fell from 97,300 tons in January to 57,600 tons in June, but its share rose to 39.2%, making it the largest supplier in June. In the first half, Canada exported about 341,200 tons to China, accounting for 15% of total imports. South Korean exports to China fell from 118,500 tons in January to 43,300 tons in June. Kazakhstan had no exports from January to May, exporting only 3,100 tons in June. For refined sulfur (purity ≥99.95%), total imports in the first half were about 363.9 tons, with Canada accounting for about 77%. Refined sulfur exports surged in May-June (160 tons and 121.2 tons respectively). The month-on-month decline in natural sulfur imports corroborated the gradual rise in domestic sulfur prices: when imports remained above 500,000 tons per month in January-March, domestic prices fluctuated in the 4,000-6,000 yuan/ton range; when imports fell to 295,500 tons in April, prices broke through 6,500 yuan/ton; when imports dropped to about 200,000 tons in May-June, prices soared to 7,500-7,800 yuan/ton, subsequently breaking through the 10,000 yuan/ton mark.
In sulfuric acid trade, imports were negligible, and exports fell to zero in June. China's sulfuric acid imports in the first half of 2026 were extremely low: 17,200 tons, 9,400 tons, 900 tons, 17,100 tons, 900 tons, and 17,900 tons respectively, averaging less than 12,000 tons per month, almost negligible compared to domestic monthly output of about 7 million tons. Exports showed a pattern of "high first, then collapse." January exports peaked at 242,500 tons, maintained at 116,000-143,000 tons per month in February-May (average about 135,000 tons per month), with cumulative exports from January to May totaling about 784,000 tons (average 157,000 tons per month), before plunging to 980.12 tons in June, a month-on-month decline of over 99%. This directly resulted from the official suspension of ordinary sulfuric acid exports starting May 1. The main receiving countries from January to May were Chile (total 295,300 tons, accounting for 37.7% of the period's total), Indonesia (about 219,300 tons), India (about 99,600 tons in Q1), and Saudi Arabia (about 101,500 tons from February to April). Exports to all major destinations were zero in June.
In summary, key data for China's sulfur market in the first half of 2026 are as follows: natural sulfur imports fell from 497,200 tons in January to 147,000 tons in June, with a combined year-on-year decline of about 57.7% for natural and refined sulfur; the Middle East share dropped from nearly 40% to 5%; national sulfuric acid output from January to May fell 1.6% year-on-year, with significant declines in traditional phosphate fertilizer-producing provinces (Hubei, Guizhou, Yunnan) and growth in smelting acid-concentrated regions like Anhui; sulfuric acid exports nearly stalled in June, with about 100,000-150,000 tons per month returning to the domestic market; sulfur prices surged from 4,180 yuan/ton at the start of the year to a June peak of 10,353.5 yuan/ton, while the copper smelting acid index rose about 92%. Looking ahead to the second half, shipping progress in the Strait of Hormuz and the pace of sulfur capacity expansion remain the core variables determining sulfur supply and price direction. If supply-side pressure persists, the tight situation in the domestic sulfur market is unlikely to reverse in the short term, and the sulfuric acid industry will continue to face high-level volatility driven by cost pressures and weak demand absorption, with regional divergence persisting.
Related Products

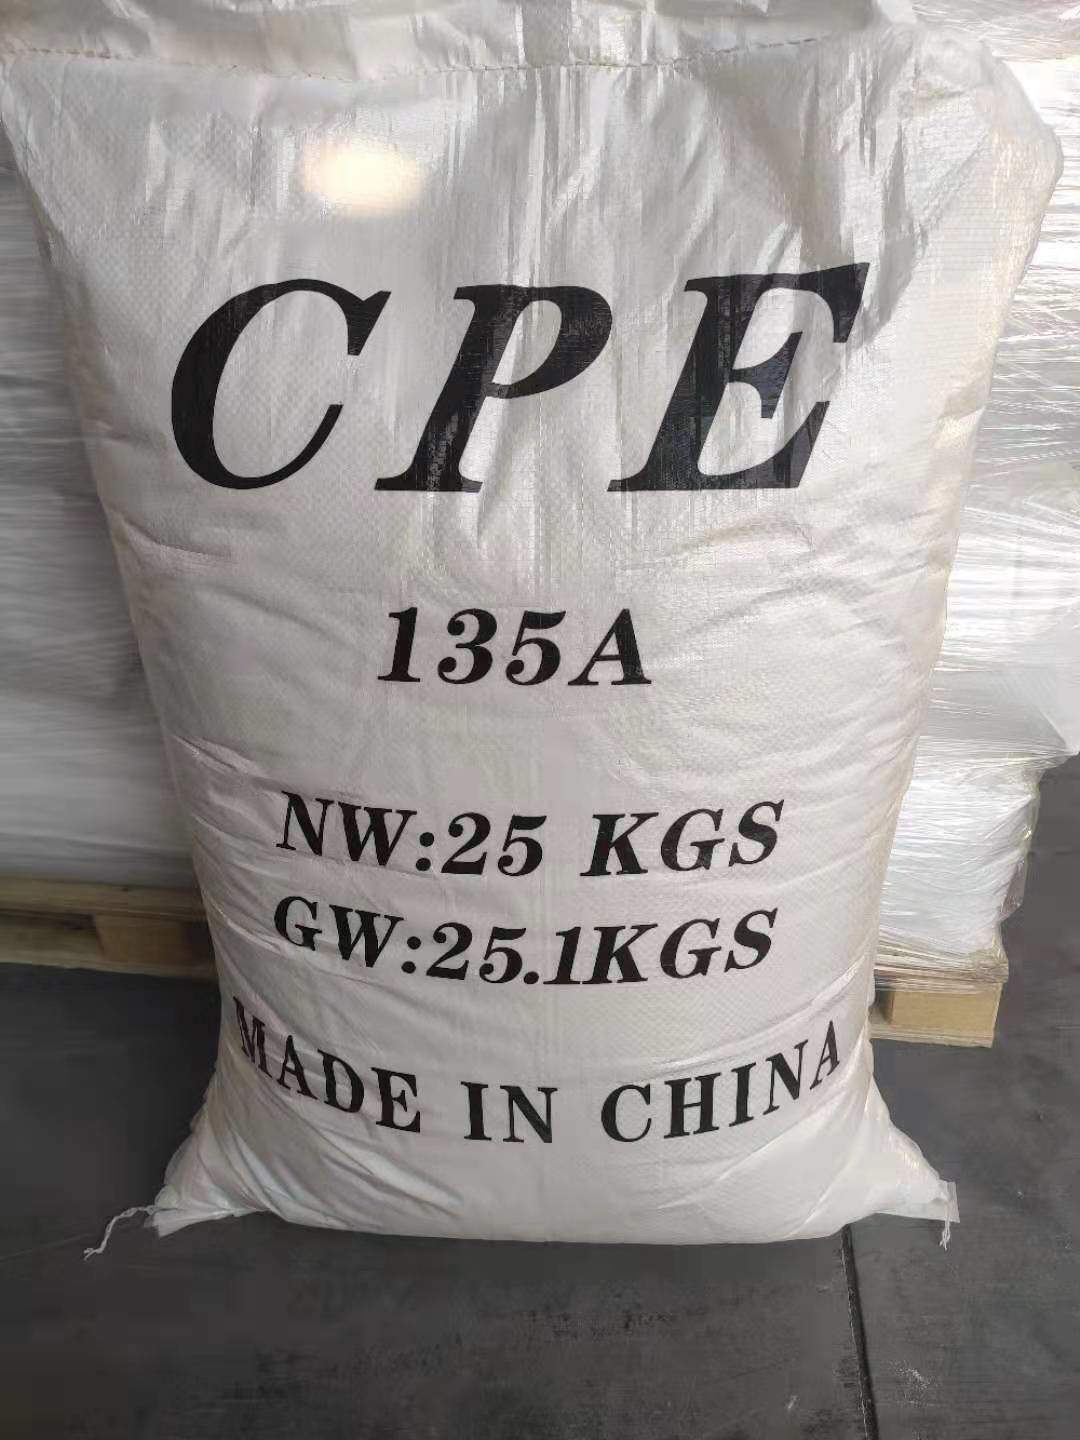
PVC Impact-Modified Chlorinated Polyethylene
Gansu Jinchuan Hengxin Polymer Technology Co., Ltd.
Steel Pipes for Refining and Coal Chemical Industries
YANGZHOU LONTRIN ENERGY EQUIPMENT CO.,LTD.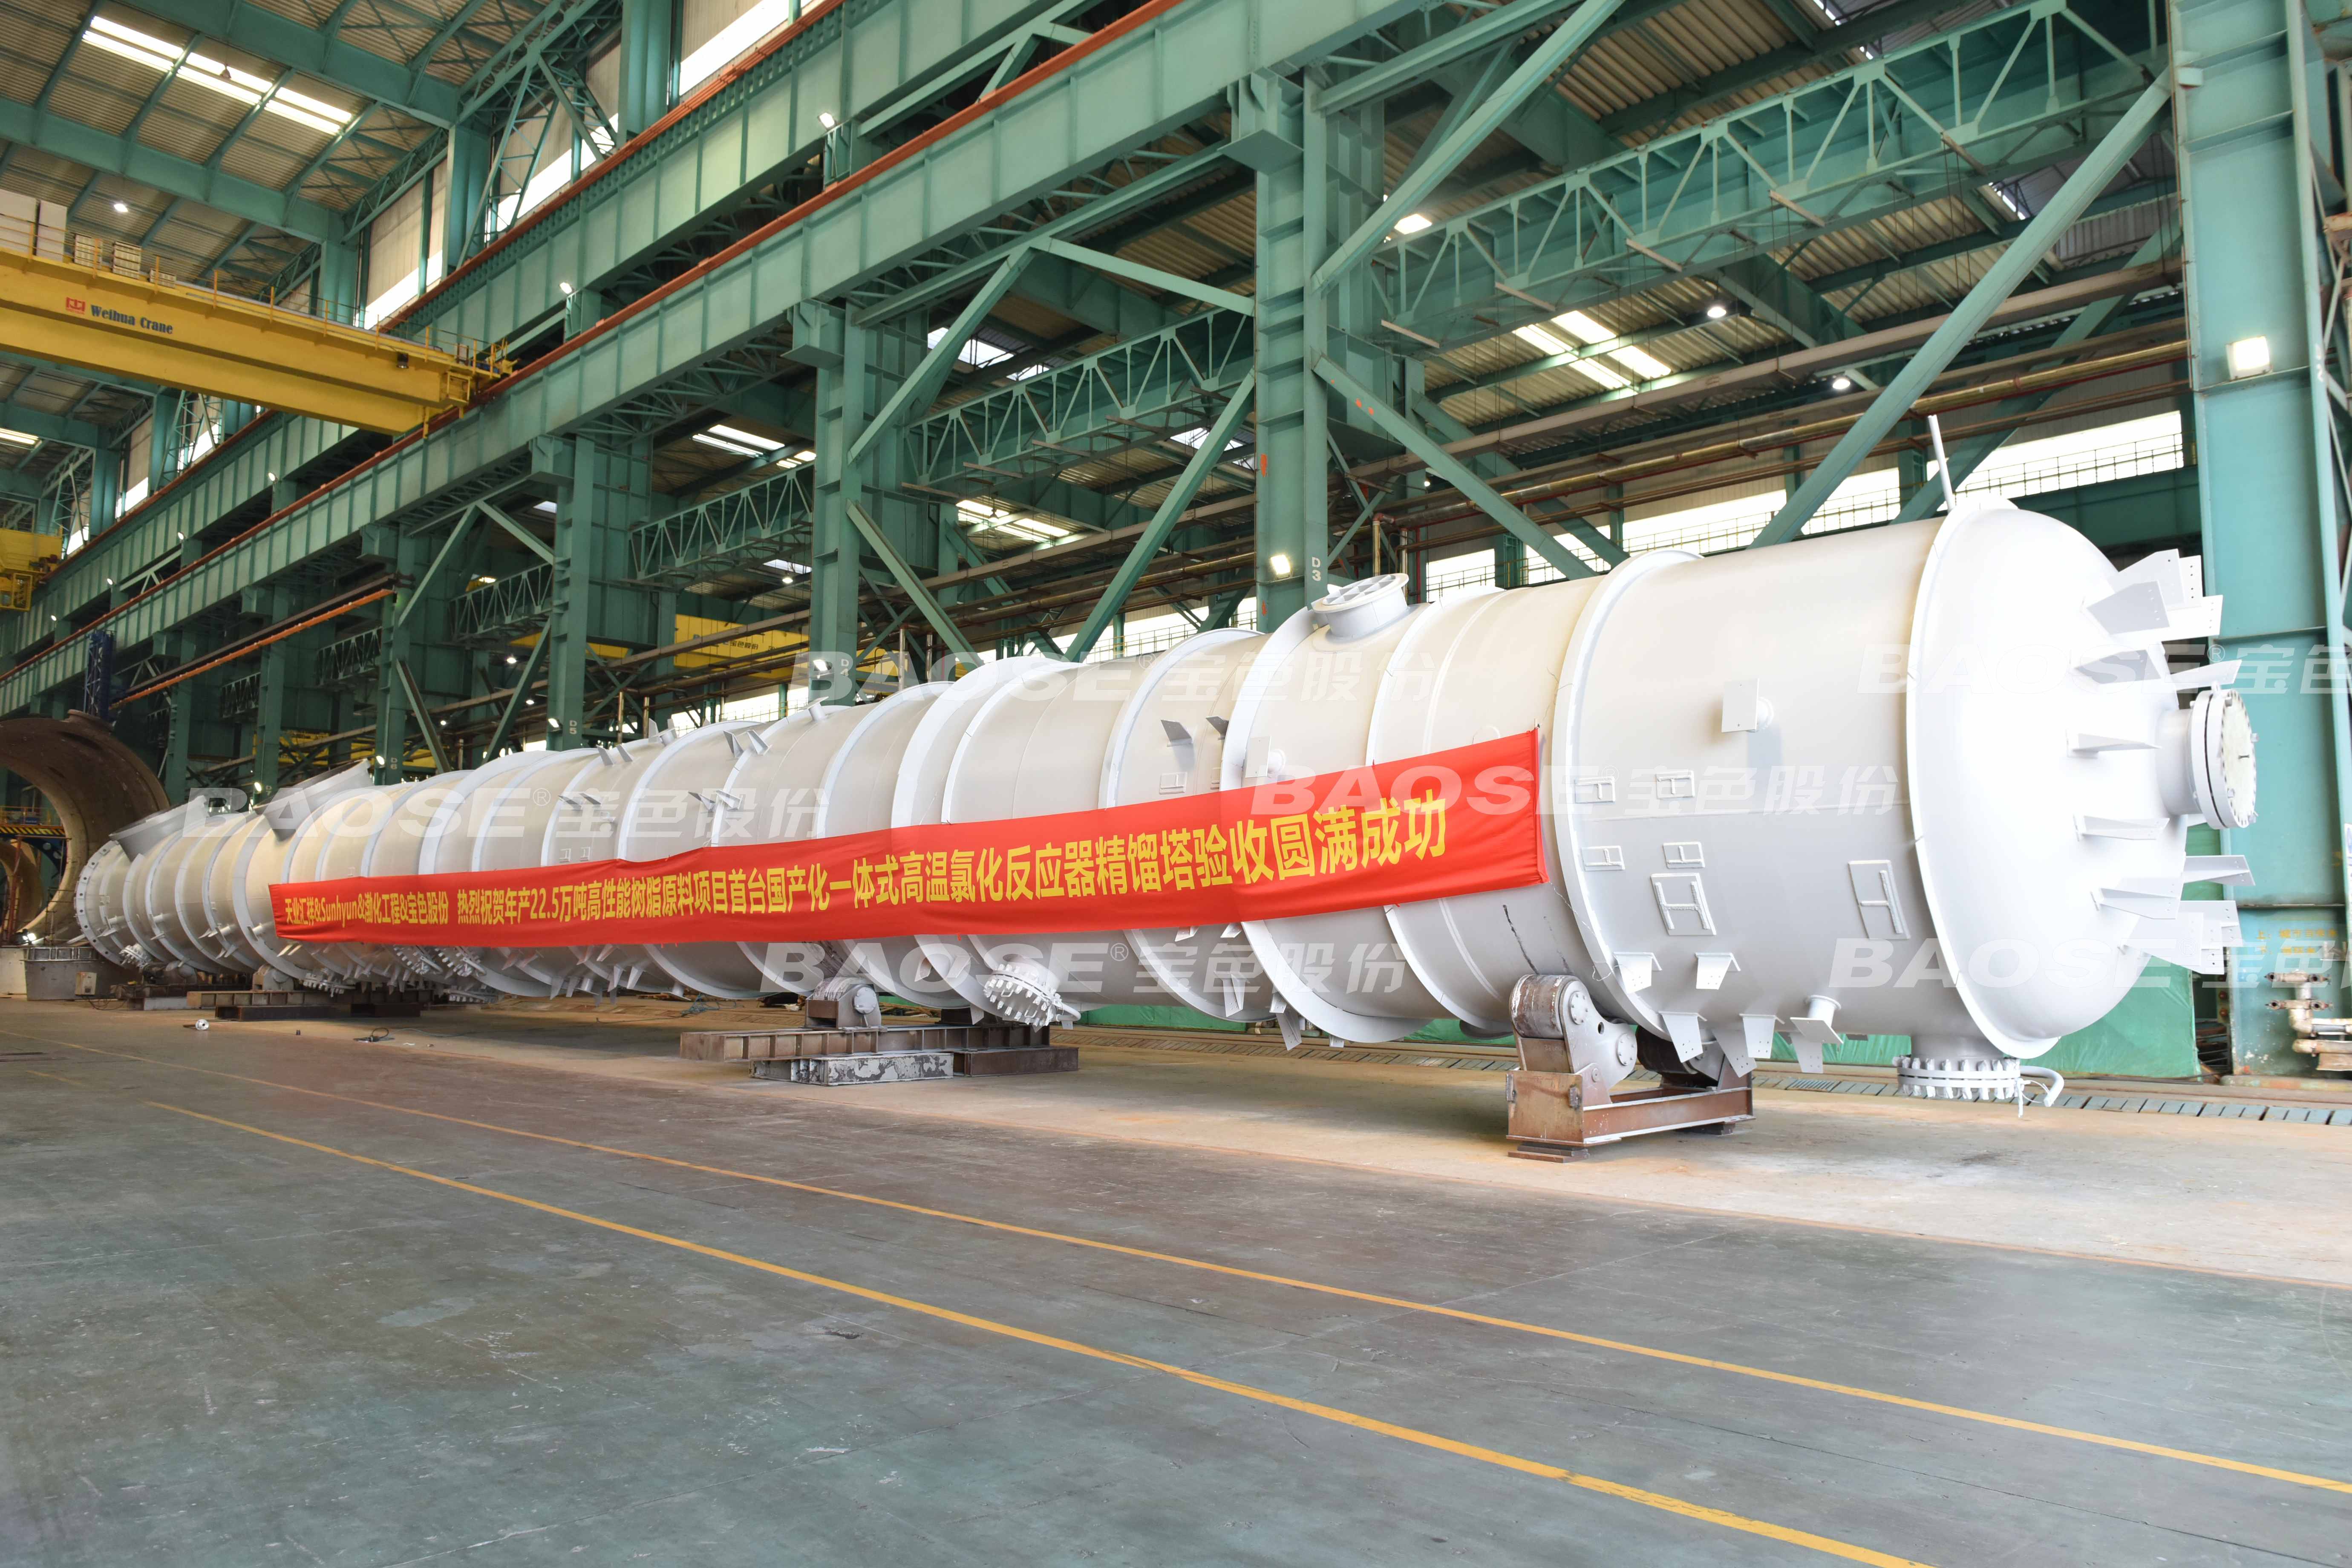
Integrated High-Temperature Chlorination Reactor Rectification Column
Nanjing Baose Co., Ltd.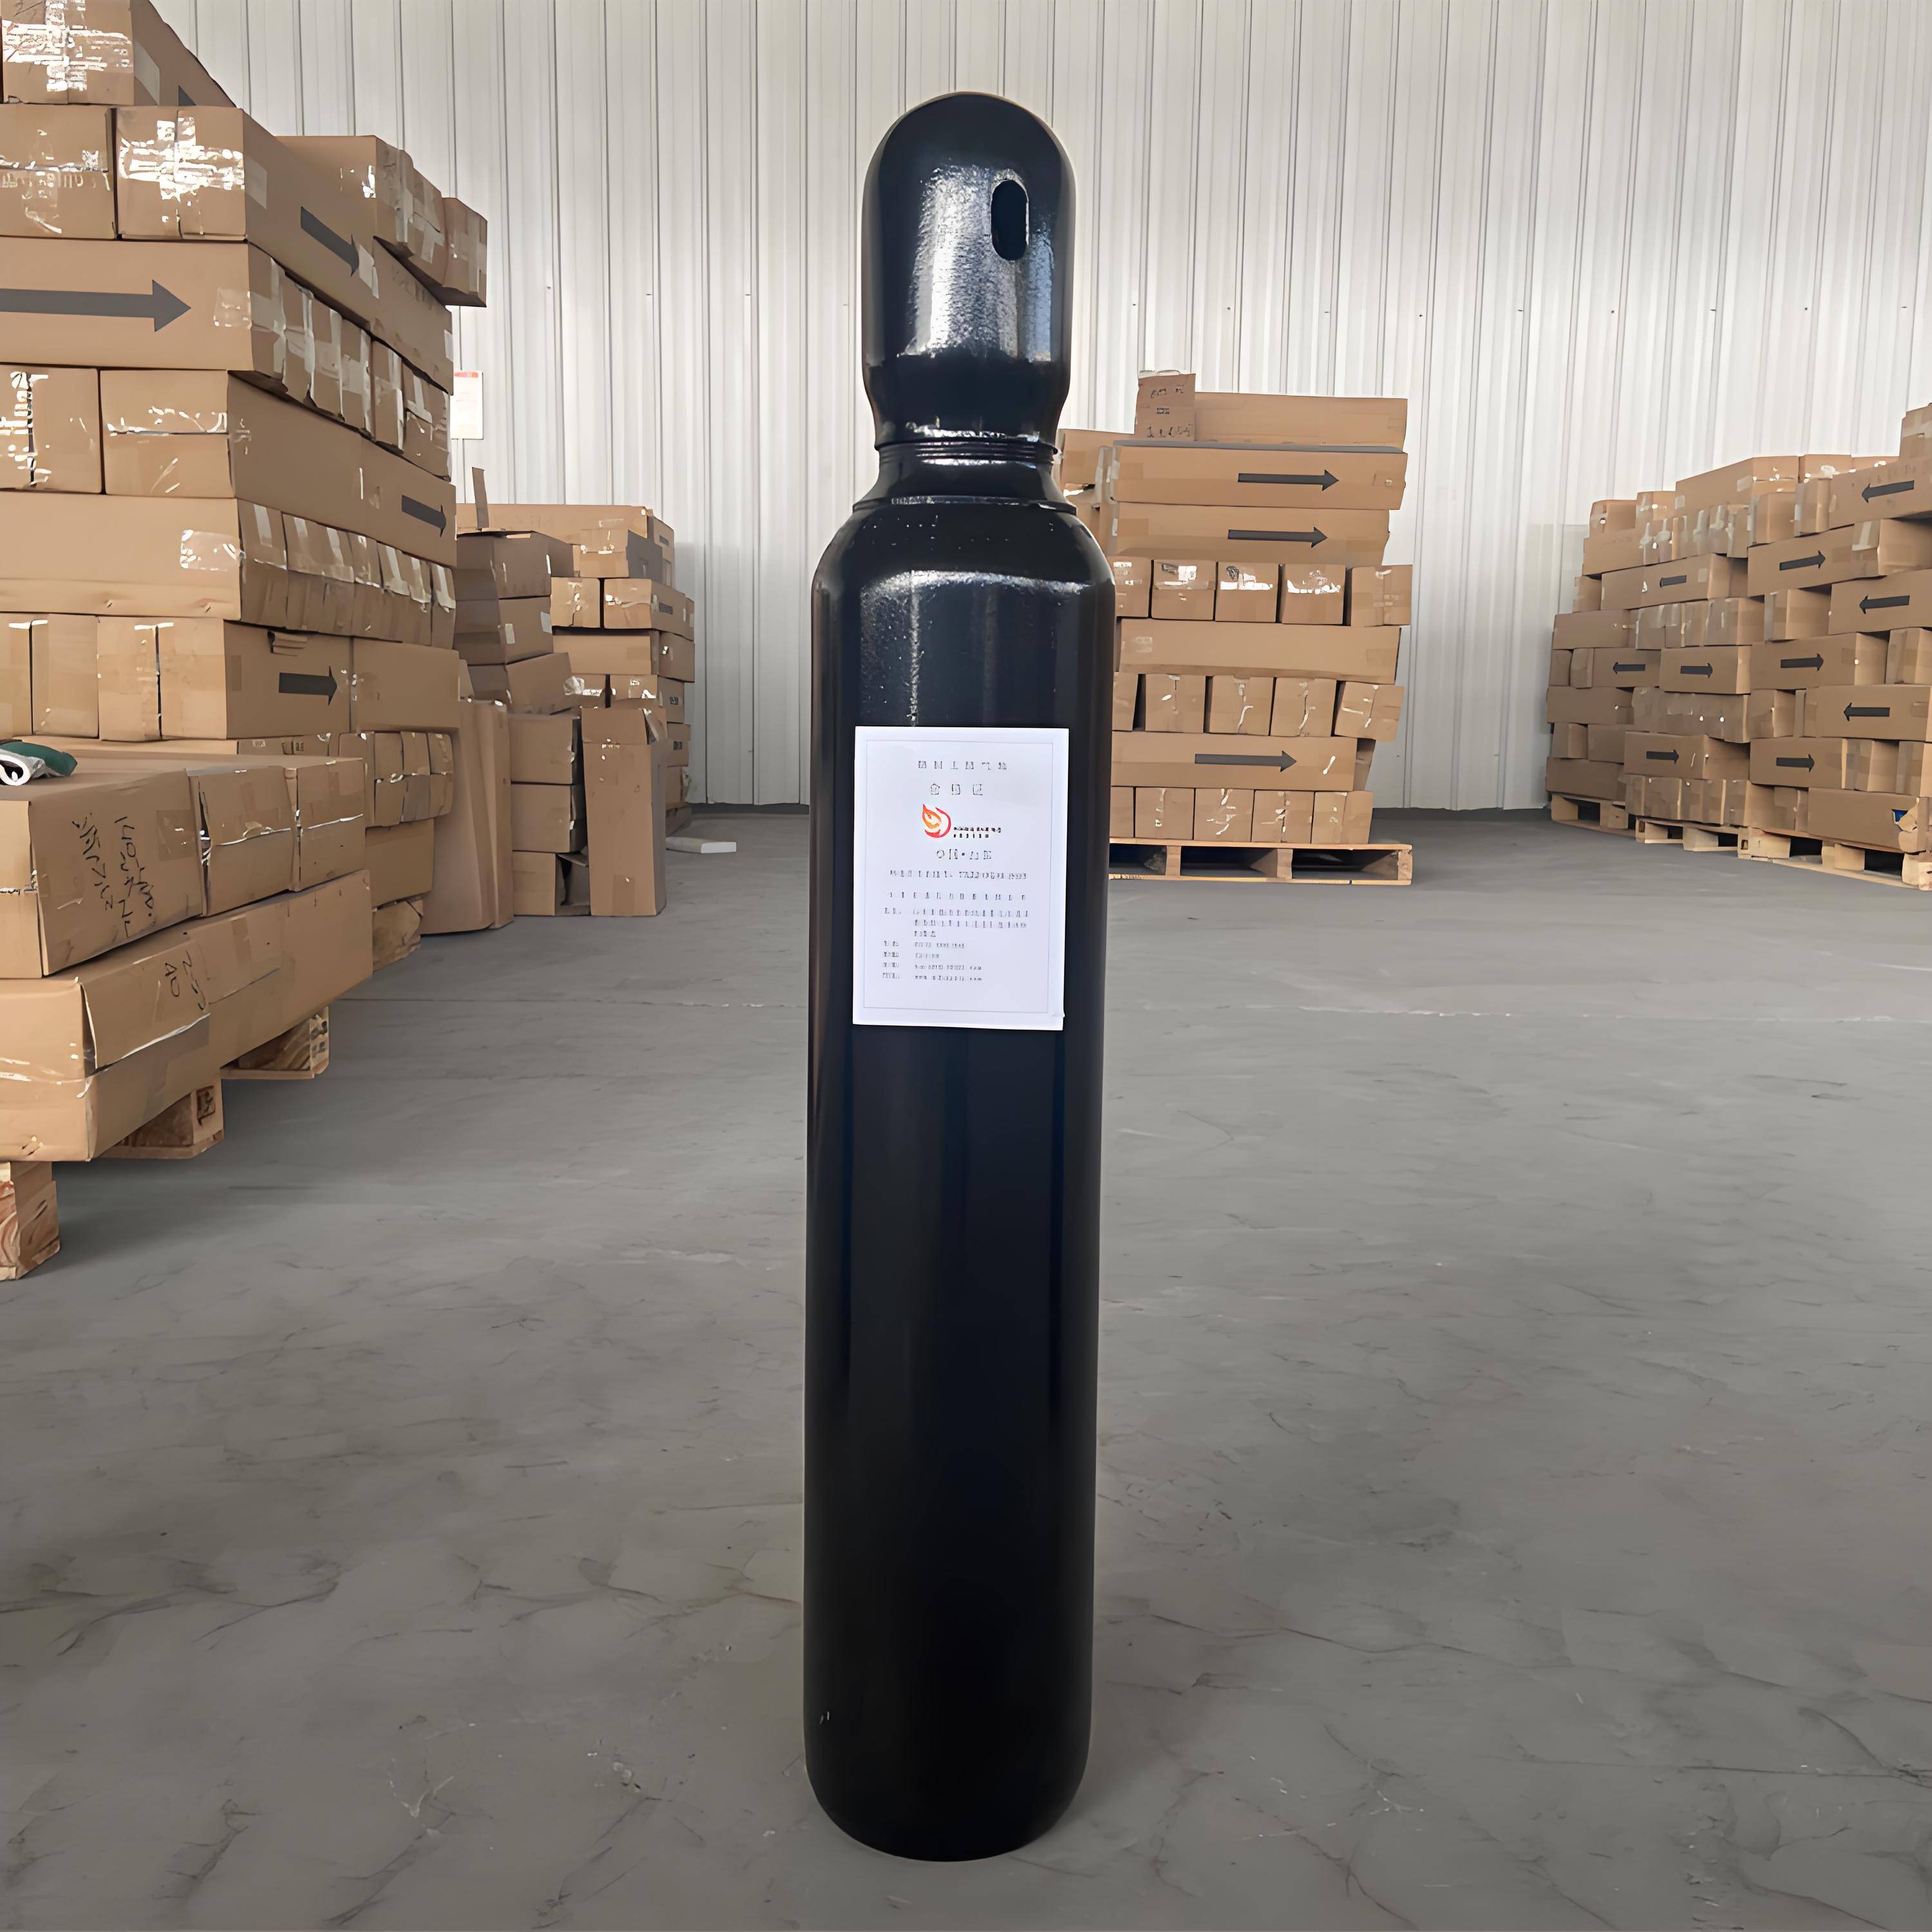
Nitrogen Export, Nitrogen Manufacturer, High-purity Nitrogen Supplier
Foshan Yuexin Industrial Gas Co., Ltd.
CAP1400 main feedwater flow nozzle flowmeter.
Jiangsu Hongda Instrument Technology Co., LTD.
High Thermal Conductivity Encapsulating Resin
Nantong BESALL Sealing Technology Company.,Limited