Executive Summary
Reclaimed water reuse equipment is moving from an optional tertiary-treatment add-on to a strategic water-supply asset. Municipal utilities, semiconductor fabs, data centres, power plants, refineries, food processors and commercial districts increasingly evaluate treated wastewater as a dependable feedstock rather than a disposal stream. The commercial market is therefore expanding at the intersection of wastewater compliance, water security and industrial continuity.
Published estimates place the global water recycle and reuse market at roughly USD 17.6-29.8 billion in 2024-2025, depending on whether the study includes only equipment and system integration or also broader technologies, services and commercial applications. Forecasts converge on strong high-single-digit to low-double-digit growth, but they should not be treated as directly comparable. The defensible conclusion is that the addressable equipment market is substantial and expanding faster than the broader conventional water and wastewater equipment sector.
The strongest opportunities are not created by water scarcity alone. A project becomes investable when the avoided cost of freshwater purchase, wastewater discharge, production curtailment or drought exposure exceeds the lifecycle cost of treatment, storage and distribution. This explains why industrial reuse often supports stronger margins than basic municipal irrigation schemes, even when plant flow is smaller.
|
Finding |
Assessment |
|
Market growth |
Most recent published forecasts imply approximately 8-12% annual growth, but scope differences produce wide market-size ranges. |
|
Technology centre |
Filtration and membrane systems capture the largest equipment value because reuse specifications increasingly require stable turbidity, salinity and microbial barriers. |
|
Highest-value applications |
High-purity industrial process water, data-centre cooling, semiconductor and power applications support the strongest engineering content. |
|
Municipal opportunity |
Large volumes and policy support make municipal reuse the largest repeatable project pool, although tariffs and distribution networks constrain returns. |
|
Regional outlook |
Asia-Pacific leads in scale; North America leads in advanced reuse regulation and project finance; the Middle East leads in water-security urgency. |
|
Key risk |
Projects fail when equipment is selected before the source-water variability, end-use standard, concentrate route and distribution economics are fixed. |
|
Strategic implication |
Suppliers should sell guaranteed water quality and recovery, not isolated components. |
1. Scope and Market Definition
This report uses the term reclaimed water reuse equipment for treatment and handling systems that convert secondary municipal effluent, industrial wastewater or other non-traditional sources into water suitable for a defined beneficial use. The equipment boundary begins with polishing and conditioning and ends with treated-water storage, pumping, monitoring and controls. It does not automatically include the upstream sewer network, primary wastewater plant or downstream customer distribution network.
The market must be distinguished from three adjacent categories. First, wastewater treatment equipment is designed primarily to meet discharge limits. Second, water reuse equipment is designed around an end-use specification. Third, zero-liquid-discharge systems add concentration and solids recovery where no liquid discharge is allowed. Many projects combine these layers, but their economics, equipment intensity and supplier groups differ.
|
Market layer |
Included in this report |
Boundary issue |
|
Tertiary filtration |
Media filtration, disc filters, cloth media, microfiltration and ultrafiltration |
May be counted inside a wastewater-plant upgrade rather than a reuse project. |
|
Membrane desalting |
Nanofiltration, reverse osmosis, membrane cleaning and pressure systems |
Not required for all non-potable reuse applications. |
|
Disinfection and oxidation |
UV, chlorination, ozone and advanced oxidation |
Barrier requirements depend on intended use and local regulation. |
|
Balance of plant |
Pumps, tanks, valves, chemical dosing, instrumentation and automation |
Often purchased through an EPC package rather than as standalone products. |
|
Distribution interface |
Treated-water pumping and storage within the plant boundary |
Long-distance purple-pipe networks are excluded from narrow equipment market estimates. |
|
Services |
Commissioning, monitoring, membrane replacement and performance contracts |
Some market studies include services, creating larger revenue estimates. |
2. Global Market Size and Forecast
The market is statistically fragmented because research firms define water recycle and reuse differently. Grand View Research estimates USD 17.57 billion in 2024 and USD 30.56 billion by 2030. MarketsandMarkets estimates USD 17.89 billion in 2025 and USD 29.61 billion by 2030. Fortune Business Insights reports a broader USD 29.79 billion base in 2025 and USD 58.13 billion by 2034. The difference is too large to be explained by timing alone and indicates different treatment of services, commercial systems and technology categories.[1][2][3]
|
Source |
Base year / value |
Forecast |
Reported CAGR |
Interpretation |
|
Grand View Research |
2024: USD 17.57 bn |
2030: USD 30.56 bn |
9.7% (2025-2030) |
Equipment-oriented recycle and reuse market; filtration is a major segment. |
|
MarketsandMarkets |
2025: USD 17.89 bn |
2030: USD 29.61 bn |
10.6% |
Includes municipal, industrial and agricultural source-water applications. |
|
Fortune Business Insights |
2025: USD 29.79 bn |
2034: USD 58.13 bn |
7.7% |
Broader technology and end-user scope; not directly comparable with narrower estimates. |
|
Grand View Research: broader equipment market |
2025: USD 71.01 bn |
2033: USD 106.39 bn |
5.3% |
Water and wastewater treatment equipment benchmark; reuse is a faster-growing subset. |
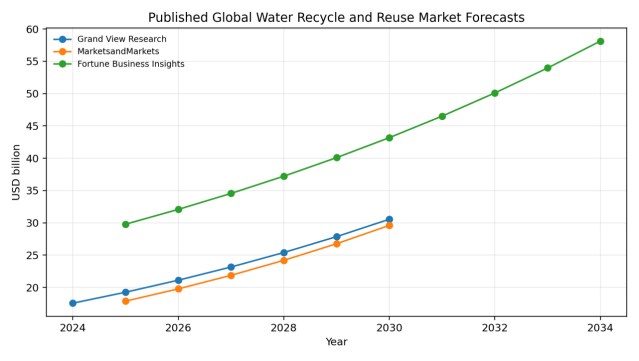
Figure 1. Published global water recycle and reuse market forecasts
Source: Grand View Research, MarketsandMarkets and Fortune Business Insights. Curves are calculated from published endpoints; scopes differ and values are not additive.
A practical 2026 market view is therefore a range rather than a single point estimate. The narrower global market for equipment, packaged systems and directly associated integration is likely in the high-teens to low-twenties billions of US dollars. Broader definitions that include services, decentralized commercial systems and advanced technology packages can support a market near USD 30 billion. For supplier strategy, the growth rate and revenue-pool mix are more useful than false precision in the base-year total.
2.1 Revenue pools inside the market
|
Revenue pool |
Typical content |
Growth quality |
|
Core process equipment |
Filters, membranes, UV, ozone, dosing, pumps and tanks |
High volume but component pricing pressure is significant. |
|
Packaged reuse plants |
Containerized or skid-mounted integrated systems |
Attractive in industrial and decentralized municipal applications. |
|
Large EPC systems |
Civil works, process integration, distribution interface and commissioning |
Large contract values; margin depends on risk allocation. |
|
Aftermarket |
Membranes, lamps, chemicals, cartridges, spare parts and field service |
Recurring and defensible where installed-base access is strong. |
|
Digital and performance services |
Monitoring, predictive maintenance, water-quality assurance and water-as-a-service |
Smaller today but strategically important for lifecycle revenue. |
3. Demand Base and Structural Drivers
The reuse market begins with wastewater availability, but the addressable volume depends on collection, safe treatment and proximity to users. The United Nations reports that 56% of domestic wastewater was safely treated in 2022. The WHO/UN-Water 2024 update estimates that 42% of household wastewater was not safely treated, representing approximately 113 billion cubic metres released with inadequate or no treatment. For industrial wastewater, countries reporting data treated 38% and safely treated only 27%, but coverage is incomplete.[4][5][6]
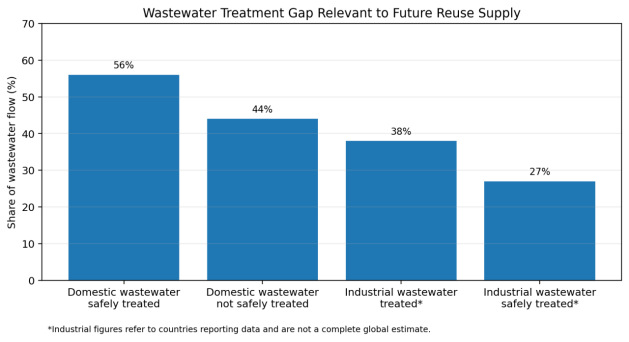
Figure 2. Wastewater treatment gap relevant to future reuse supply
Source: United Nations SDG 6 reporting and UN-Water/WHO 2024 update. Industrial figures cover reporting countries and are not a complete global estimate.
This gap creates a two-stage opportunity. In lower-income and fast-urbanizing regions, the first investment priority remains collection and safe treatment. In more mature systems, the next capital cycle is tertiary treatment and reuse. Suppliers that can integrate both stages have broader reach, while specialists in advanced reuse should target locations where secondary effluent already exists and water scarcity or industrial demand justifies additional treatment.
3.1 Water security and production continuity
Industrial buyers increasingly value reuse as insurance against production interruption. Semiconductor, battery, pharmaceutical, power, refining, mining and food plants may face constraints even where annual freshwater supply appears adequate, because peak demand, drought restrictions or local permit conditions limit expansion. Water reuse can decouple production growth from freshwater withdrawal and discharge capacity.
The 2026 US EPA Water Reuse Action Plan 2.0 places renewed emphasis on industrial and data-centre cooling applications, indicating that technology-sector water demand is becoming a policy and infrastructure issue rather than only a corporate sustainability target.[8]
3.2 Regulation shifts reuse from voluntary to planned infrastructure
The European Union's Regulation (EU) 2020/741 has applied since 26 June 2023 and establishes minimum requirements and risk-management obligations for reuse of treated urban wastewater in agricultural irrigation. It creates a common quality and permitting framework, although member states retain flexibility and industrial or urban reuse remains governed through other national rules.[9]
California's recycled-water policy illustrates how long-term volume targets create a project pipeline. State planning documents reference a baseline of 714,000 acre-feet in 2015 and goals of 1.5 million acre-feet by 2020 and 2.5 million acre-feet by 2030. Actual delivery depends on local projects and funding, but the target provides a clear demand signal for treatment and distribution equipment.[13]
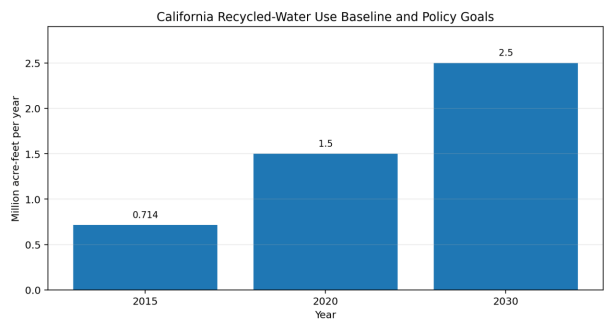
Figure 3. California recycled-water use baseline and policy goals
Source: California Department of Water Resources, Municipal Recycled Water Resource Management Strategy. Values are policy targets, not confirmed achieved volumes.
4. Technology Landscape
Reclaimed-water plants should be designed from the end use backward. Irrigation may require robust filtration and disinfection, while boiler makeup, semiconductor rinsing or potable reuse requires progressively stronger barriers for dissolved salts, trace organics, pathogens and process-specific contaminants. The commercial advantage lies in selecting the least-complex train that can consistently meet the required quality.
|
Technology |
Primary function |
Best-fit applications |
Commercial limitation |
|
Coagulation / clarification |
Remove suspended solids, colloids and some phosphorus |
Variable industrial water, high-turbidity municipal effluent |
Chemical sludge and dosing sensitivity. |
|
Media, disc and cloth filtration |
Turbidity and particle polishing |
Irrigation, cooling, pretreatment |
Limited removal of dissolved salts and trace organics. |
|
Microfiltration / ultrafiltration |
Stable particle and microbial barrier |
RO pretreatment, high-grade non-potable and potable reuse |
Fouling control and periodic cleaning are essential. |
|
Nanofiltration / reverse osmosis |
Remove dissolved salts, hardness and many trace contaminants |
High-purity industrial, groundwater recharge and potable reuse |
Concentrate disposal and energy demand. |
|
UV / chlorination |
Microbial inactivation and residual control |
Most reuse applications |
Water quality and by-product constraints affect dose. |
|
Ozone / advanced oxidation |
Destroy trace organic compounds and strengthen multiple-barrier design |
Potable reuse and sensitive industrial applications |
Higher capital, energy and validation burden. |
|
Activated carbon / biofiltration |
Adsorb or biologically remove organics |
Taste, odour, micropollutant and industrial polishing |
Media replacement and biological stability. |
|
EDI / ion exchange |
High-purity polishing |
Electronics, pharmaceutical and boiler applications |
Sensitive to pretreatment and feed-water chemistry. |
4.1 Filtration and membrane systems
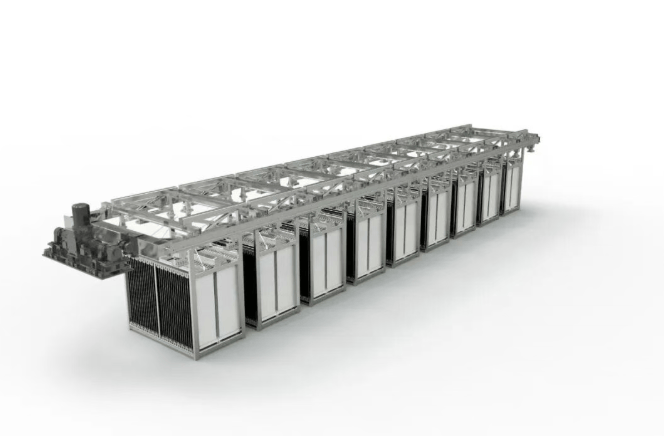
Modern filtration systems form the equipment core of most reuse trains. Disc and cloth-media filters provide economical solids polishing; microfiltration and ultrafiltration provide a more reliable barrier before reverse osmosis. Supplier differentiation comes from flux stability, backwash efficiency, chemical-cleaning frequency, membrane integrity testing and the ability to handle seasonal source-water variation.
Water treatment membrane technology is central to high-grade reuse because it converts variable secondary effluent into a more predictable feed for downstream desalting and disinfection. Polymeric hollow-fibre UF remains widely used, while ceramic membranes can be attractive in abrasive, oily or high-temperature industrial streams where higher capital cost is offset by durability.
4.2 Reverse osmosis and concentrate management
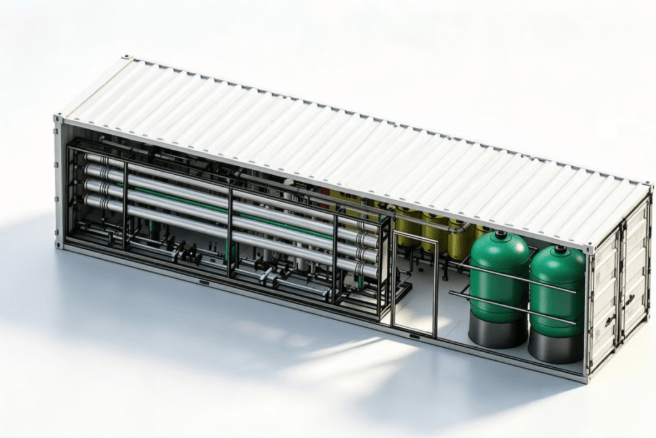
Reverse osmosis technology is the main barrier for total dissolved solids, hardness, many trace organics and ionic contaminants. It is not automatically required for irrigation or many cooling applications, and adding RO where the end use does not need desalting can destroy project economics. Where RO is required, recovery, antiscalant strategy, clean-in-place design and concentrate routing must be specified before procurement.
4.3 Disinfection and validated barriers
Water disinfection technology is increasingly procured as a validated barrier rather than a simple equipment item. UV dose delivery depends on transmittance, lamp ageing and fouling; chlorine performance depends on contact time and demand; ozone and advanced oxidation require control of oxidation by-products and energy use. Potable reuse projects demand continuous monitoring and documented response protocols.
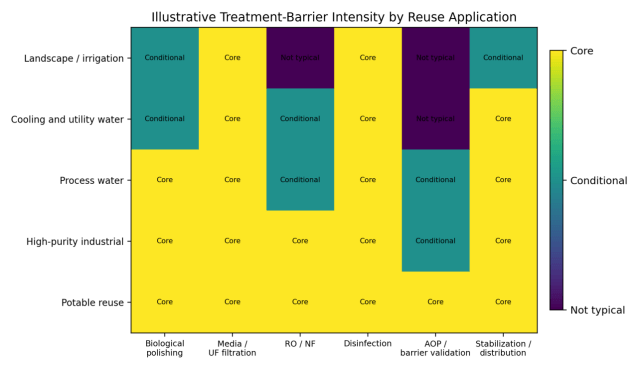
Figure 4. Illustrative treatment-barrier intensity by reuse application
Source: Wedoany synthesis based on US EPA water-reuse guidance, EU risk-management requirements and established municipal/industrial treatment trains. This is a design-screening framework, not a universal standard.
5. Process Economics and Lifecycle Cost
A reuse project's economics are governed by four linked systems: treatment, conveyance, storage and the avoided cost of the alternative water source. Equipment suppliers often focus on treatment cost while the customer faces a distribution-dominated project. The EU Joint Research Centre found that agricultural-reuse treatment can be approximately EUR 0.08/m3 in lower-intensity cases and rise toward EUR 0.23-0.30/m3 with more stringent requirements, while total costs commonly approach or exceed EUR 0.50/m3 because pumping and infrastructure dominate. Median pumping energy in the analysed European cases was about 0.5 kWh/m3.[10]
|
Cost driver |
Effect on CAPEX / OPEX |
Procurement implication |
|
Source-water variability |
Drives equalization, chemical dosing, membrane area and cleaning frequency |
Use at least 12 months of water-quality data where possible. |
|
Required end-use quality |
Determines barrier count, RO need and validation burden |
Specify water quality at the point of use, not only plant outlet. |
|
Plant scale and utilization |
Low utilization increases unit cost and damages membrane economics |
Model seasonal demand and minimum turndown. |
|
Distribution distance and elevation |
Can exceed treatment energy and civil cost |
Include pumping and purple-pipe infrastructure in the business case. |
|
Concentrate and residuals |
RO reject, backwash water and chemical sludge create disposal cost |
Secure a permitted route before technology selection. |
|
Energy and chemical prices |
Affect RO, ozone, UV, pumping and cleaning |
Tender lifecycle consumption guarantees, not only nameplate power. |
|
Automation and operator capability |
Poor control causes off-spec water and asset underutilization |
Match control complexity to staffing and remote support. |
The avoided-cost benchmark differs by region. California analysis notes that recycled-water programmes can exceed USD 2,200 per acre-foot and seawater desalination can exceed USD 2,800 per acre-foot, while conventional imported or surface-water supplies may be cheaper when available. Reuse nevertheless remains attractive where it provides local drought resilience, reduces discharge fees or unlocks industrial expansion.[18]
6. End-Use Industry Analysis
|
End use |
Typical reclaimed-water requirement |
Equipment opportunity |
Market quality |
|
Municipal irrigation and urban non-potable |
Low turbidity, controlled pathogens, residual disinfectant |
Filtration, UV/chlorine, pumps, storage and distribution controls |
Large volume, price-sensitive and policy-dependent. |
|
Industrial cooling |
Low suspended solids, biological stability, controlled hardness and corrosion |
Filtration, softening, RO where needed, dosing and monitoring |
Strong repeat demand and retrofit opportunity. |
|
Boiler and process makeup |
Low hardness, silica and conductivity |
UF/RO, EDI or ion exchange, degassing and chemical control |
High equipment intensity and service revenue. |
|
Semiconductor and electronics |
Very low ions, particles, organics and microbes |
Multi-pass RO, UF, EDI, UV oxidation and online analytics |
High-value, qualification-intensive and concentrated among specialists. |
|
Food, beverage and pharmaceuticals |
Application-specific microbial and chemical quality |
Membrane, UV, ozone, hygienic design and validation |
Good margin where regulatory and brand risk justify redundancy. |
|
Mining and metals |
Variable salinity, metals and suspended solids |
Clarification, membranes, ion removal and brine management |
Large technical need but project and commodity-cycle risk. |
|
Data centres |
Stable cooling-water chemistry and low biological risk |
Filtration, softening, disinfection, controls and redundancy |
Rapidly emerging but site-specific; reuse may avoid local freshwater constraints. |
|
Potable reuse |
Multiple validated barriers and continuous assurance |
MF/UF, RO, UV/AOP, stabilization and advanced monitoring |
High capital and engineering value; long permitting and public-engagement cycle. |
Industrial projects are usually more fragmented than municipal schemes but can support faster decisions and higher equipment value per cubic metre. Xylem identifies industrial reuse benefits including reduced freshwater cost, reduced wastewater flow and a smaller water footprint; integrated supplier cases combine clarification, media filtration, activated carbon, RO and EDI, illustrating the importance of source-specific process design rather than standard packages.[15]
7. Regional Market Outlook
|
Region |
Demand profile |
Policy / market signal |
Supplier implication |
|
Asia-Pacific |
Largest combination of urban wastewater, industrial expansion and water-stressed manufacturing clusters |
Singapore NEWater, Chinese industrial reuse, Indian urban reuse policies and Australian drought resilience |
Offer scalable municipal systems and high-purity industrial packages; local service is essential. |
|
North America |
Advanced potable reuse, industrial reuse and data-centre cooling |
EPA WRAP 2.0, California targets and state-level regulations |
Strong opportunity for validated equipment, digital assurance and lifecycle contracts. |
|
Europe |
Agricultural reuse, industrial circular water and micropollutant control |
EU 2020/741 risk-based framework; possible expansion of reuse standards under policy debate |
Compliance documentation and energy efficiency are decisive. |
|
Middle East |
Water-security-driven municipal and industrial reuse |
High desalination dependence and national wastewater-reuse targets |
Large EPC opportunity; salinity, heat and distribution economics require robust design. |
|
Latin America |
Mining, industrial clusters and water-stressed cities |
Uneven regulation and utility finance |
Modular systems and private industrial projects often move faster than municipal programmes. |
|
Africa |
Large treatment gap and selective industrial reuse |
Infrastructure finance and urbanization |
Pair reuse equipment with basic treatment and concessional-finance structures. |
7.1 Asia-Pacific
Asia-Pacific combines the largest equipment volume with the widest range of project maturity. Singapore operates four NEWater plants and uses advanced membrane treatment to produce high-grade reclaimed water. Its current water demand is about 440 million gallons per day and could almost double by 2065; NEWater and desalination are expected to supply the majority of future demand.[11][12] This creates a reference model for industrial-grade reuse, although not every market can support the same treatment intensity or tariff structure.
7.2 North America
North America is commercially important for advanced reuse regulation, project finance and digital monitoring. California, Arizona, Texas, Florida and other water-stressed regions are expanding non-potable and potable reuse. The 2026 US federal action plan highlights industrial, energy and technology applications, while state rules continue to determine treatment validation and permitting.
7.3 Europe and the Middle East
Europe's opportunity is driven by drought, agricultural irrigation, industrial circularity and increasingly stringent wastewater standards. The Middle East has a stronger water-security case and frequently treats reuse as part of integrated desalination-wastewater portfolios. European projects emphasize risk management and lifecycle emissions; Middle Eastern projects often emphasize scale, reliability and distribution to large users.
8. Competitive Landscape and Business Models
The market is fragmented across global water companies, membrane manufacturers, disinfection specialists, automation suppliers, EPC contractors and regional package-system companies. No reliable public source provides a consistent global market-share table for reclaimed-water equipment alone. Competitive analysis should therefore focus on installed references, technology ownership, service coverage and ability to guarantee the complete water-quality envelope.
|
Company / group |
Relevant position |
Strength |
Strategic constraint |
|
Veolia Water Technologies |
Large municipal and industrial treatment integrator |
Broad process portfolio, operations experience and global references |
Complex organization and project selectivity. |
|
Xylem |
Treatment, pumps, UV/ozone, analytics and system solutions |
Strong equipment breadth and installed-base service capability |
Must integrate third-party membrane and process elements in some trains. |
|
DuPont Water Solutions |
RO, NF, UF and ion-exchange materials |
Membrane portfolio, design tools and global channel reach |
Primarily technology supplier rather than full civil/EPC provider. |
|
Toray |
RO, UF and MBR membrane supplier |
Strong membrane technology and industrial/municipal references |
Value capture depends on system partners and replacement cycle. |
|
Pentair |
Filtration, membranes and water-treatment components |
Component breadth and decentralized-system channels |
Less dominant in very large municipal EPC projects. |
|
Kubota |
MBR and decentralized wastewater treatment |
Compact biological treatment and reuse-compatible effluent |
Regional strength varies; downstream polishing often requires partners. |
|
Regional EPC and package-system suppliers |
Customized industrial and municipal systems |
Local cost, permitting knowledge and fast delivery |
Reference depth, guarantees and long-term service can be inconsistent. |
8.1 Business-model evolution
Traditional equipment sales are shifting toward design-build-operate, water-as-a-service and performance-based contracts. These models can accelerate customer adoption by transferring capital and operating risk, but suppliers must price feed-water variability, membrane replacement, energy escalation and offtake risk. The strongest providers combine process guarantees with remote monitoring, spare-parts logistics and operator training.
9. Procurement Specification and Project Risk
A reclaimed-water system should be tendered as a guaranteed process train. Flow alone is insufficient because equipment size and performance depend on suspended solids, salinity, hardness, silica, organic load, pathogens, temperature and seasonal variability. The tender should define both average and worst-case feed conditions, the required water quality at the point of use and the permitted residual streams.
|
Procurement KPI |
Why it matters |
Required tender evidence |
|
Guaranteed net product flow |
Backwash, cleaning and reject reduce deliverable water |
Net flow at defined feed quality and availability. |
|
Recovery rate |
Determines freshwater offset and residual volume |
Guaranteed annual average and minimum recovery. |
|
Product-water quality |
Protects end-use equipment and regulatory compliance |
Parameter-by-parameter guarantee at design and upset conditions. |
|
Specific energy consumption |
Major lifecycle cost for pumping, RO, UV and ozone |
kWh/m3 at defined flow, salinity and fouling state. |
|
Chemical consumption |
Impacts cost, logistics and environmental footprint |
Annual consumption at specified feed-water envelope. |
|
Membrane and consumable life |
Drives aftermarket cost and downtime |
Replacement assumptions, warranty and cleaning protocol. |
|
Availability and redundancy |
Reuse water often becomes production-critical |
N+1 philosophy, bypass conditions and maintenance plan. |
|
Water-quality monitoring system |
Continuous assurance is essential for higher-risk reuse |
Sensor list, calibration, alarms, data retention and automatic diversion logic. |
|
Concentrate / residual route |
Can determine project feasibility |
Mass balance, permits and disposal or recovery plan. |
For advanced systems, the water quality monitoring system should be treated as a process barrier rather than an accessory. Online turbidity, conductivity, UV transmittance, oxidation-reduction potential, chlorine residual and integrity indicators should trigger automatic diversion when critical limits are exceeded.
|
Risk |
Failure mechanism |
Mitigation |
|
Feed-water mismatch |
Actual salinity, organics or solids exceed the design basis |
Pilot testing, conservative envelope and equalization. |
|
Offtake shortfall |
Customer demand is seasonal or below design flow |
Phased capacity, storage and flexible turndown. |
|
Concentrate constraint |
No permitted outlet for RO reject or backwash residuals |
Resolve mass balance and disposal before final design. |
|
Biological instability |
Regrowth in storage and distribution |
Residual disinfectant, nutrient control and hydraulic management. |
|
Membrane fouling |
Higher pressure, lower recovery and frequent cleaning |
Pretreatment, monitoring and enforceable cleaning assumptions. |
|
Public acceptance |
Potable or urban reuse projects face opposition |
Transparent risk communication, demonstration and independent validation. |
|
Operator capability |
Complex system is run below design performance |
Automation, training, remote support and simplified maintenance. |
|
Contractual guarantee gap |
Vendor excludes difficult feed conditions or downstream quality |
Integrated responsibility matrix and performance testing protocol. |
10. Outlook to 2034
The market outlook is positive but increasingly segmented. Basic non-potable reuse will expand through standardized filtration and disinfection packages, while high-value growth will come from membrane-intensive industrial and potable systems. The fastest equipment growth is likely in modular UF/RO trains, high-recovery membrane designs, validated UV/AOP barriers, online water-quality analytics and controls that reduce operator dependence.
Three forces will determine whether published double-digit forecasts are achieved. First, utilities and industries must secure distribution and offtake, not only treatment capacity. Second, concentrate and emerging-contaminant rules must remain technically and economically manageable. Third, project finance must recognize the resilience value of local water supply, not judge reuse only against the short-run tariff of conventional freshwater.
|
Scenario |
2026-2034 conditions |
Market outcome |
|
Base case |
Steady regulation, industrial water constraints and gradual municipal investment |
High-single-digit to low-double-digit growth; membranes and monitoring outperform. |
|
Acceleration |
More severe drought, rapid data-centre/semiconductor expansion and supportive reuse tariffs |
Broader adoption of industrial reuse and advanced municipal projects; service contracts scale. |
|
Constraint case |
Weak utility finance, slow permitting, public resistance and unresolved concentrate disposal |
Growth concentrates in private industrial projects and water-stressed premium markets. |
Conclusion
Reclaimed water reuse equipment is becoming a core part of global water infrastructure, but the market cannot be understood as a single standard product category. Its value is created by matching source water, treatment barriers, end-use quality, residual management and distribution economics. This makes the sector attractive to suppliers with process integration and lifecycle service capability, while exposing commodity equipment vendors to pricing pressure.
The commercial priority is to target projects where water reuse solves an expensive operational constraint: freshwater scarcity, discharge limits, production expansion or resilience. In those settings, customers are willing to pay for guaranteed recovery, stable water quality and long-term availability. The market will reward systems that are fit-for-purpose, measurable and supportable—not simply those with the most treatment stages.
Sources and Statistical Notes
[1] Grand View Research, Water Recycle & Reuse Market Size, Industry Report, 2030
[2] MarketsandMarkets, Water Recycle and Reuse Market - Global Forecast to 2030
[3] Fortune Business Insights, Water Recycle and Reuse Market Size and Forecast, 2034
[4] United Nations DESA, Sustainable Development Goal 6
[5] WHO / UN-Water, Progress on the Proportion of Domestic and Industrial Wastewater Flows Safely Treated, 2024
[6] UN-Water, Progress on Wastewater Treatment - 2024 Update
[7] US EPA, Water Reuse and Recycling
[8] US EPA, Water Reuse Action Plan 2.0, April 2026
[9] European Union, Regulation (EU) 2020/741 on Minimum Requirements for Water Reuse
[10] European Commission Joint Research Centre, The Potential of Water Reuse for Agricultural Irrigation in the EU
[11] PUB Singapore, NEWater
[12] PUB Singapore, Singapore Water Loop and Demand Outlook
[13] California Department of Water Resources, Municipal Recycled Water Resource Management Strategy
[14] Xylem, Water Reuse Systems
[15] Xylem, Industrial Water Recycle and Reuse
[16] Toray Membrane, RO, NF, UF and MBR Technologies
[17] Grand View Research, Water and Wastewater Treatment Equipment Market
[18] California Department of Water Resources, The Economy of the State Water Project
[19] European Commission Joint Research Centre, Water-Energy Nexus in Europe
[20] PUB Singapore / DNV, Second Party Opinion and Water-Treatment Energy Metrics
Statistical note: Market forecasts use different boundaries and should not be added or treated as a single consensus series. Where endpoints were used to draw annual curves, intermediate values were calculated using the reported compound annual growth rate. Policy targets are identified as targets rather than achieved volumes.
Product-link note: The five embedded Wedoany product links were selected from the supplied English product-tag mapping table and distributed only where the corresponding equipment or technology is discussed. No link was inserted where the article lacked a natural keyword match.
Related Products

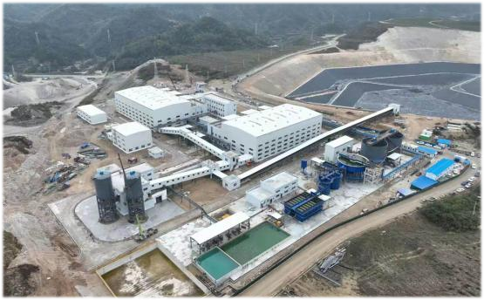
Yingping Mining Section Open-pit Tailings Backfill Treatment of Goaf Ecological Restoration EPC Project
China Bluestar Lehigh Engineering Corporation
Forest and Grassland Heat Source Infrared Monitor
China Huayun Meteorological Technology Group Co., Ltd.
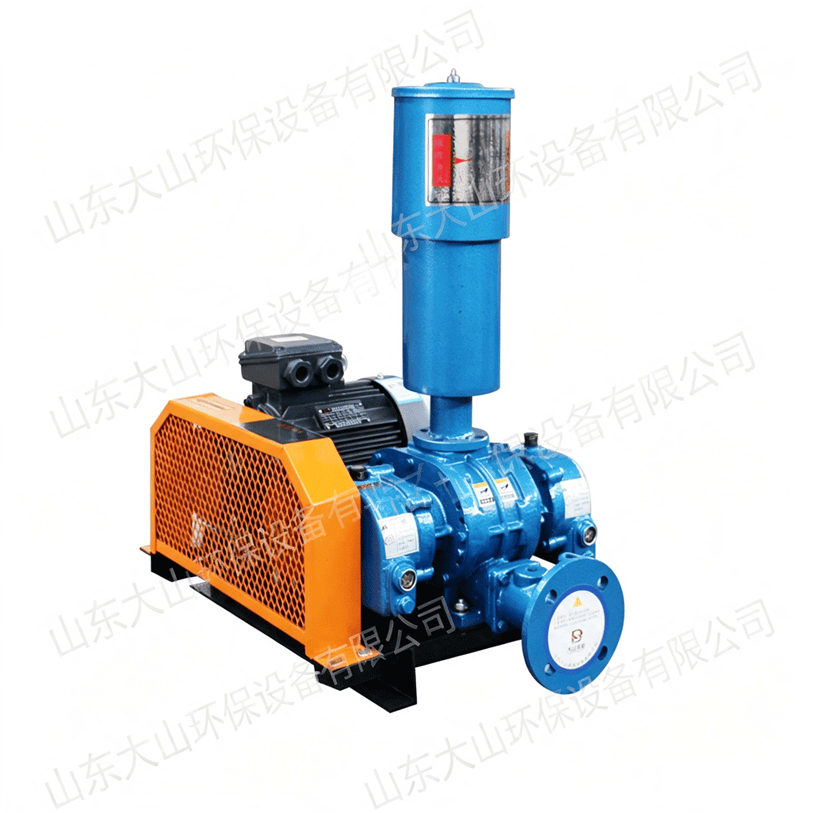
Roots Blower Aquaculture Bottom Aerator Microporous Aeration Tube Compatible Three-Lobe High Pressure Energy-Saving Oxygenation
Shandong Dashan Environmental Protection Equipment Co., Ltd.
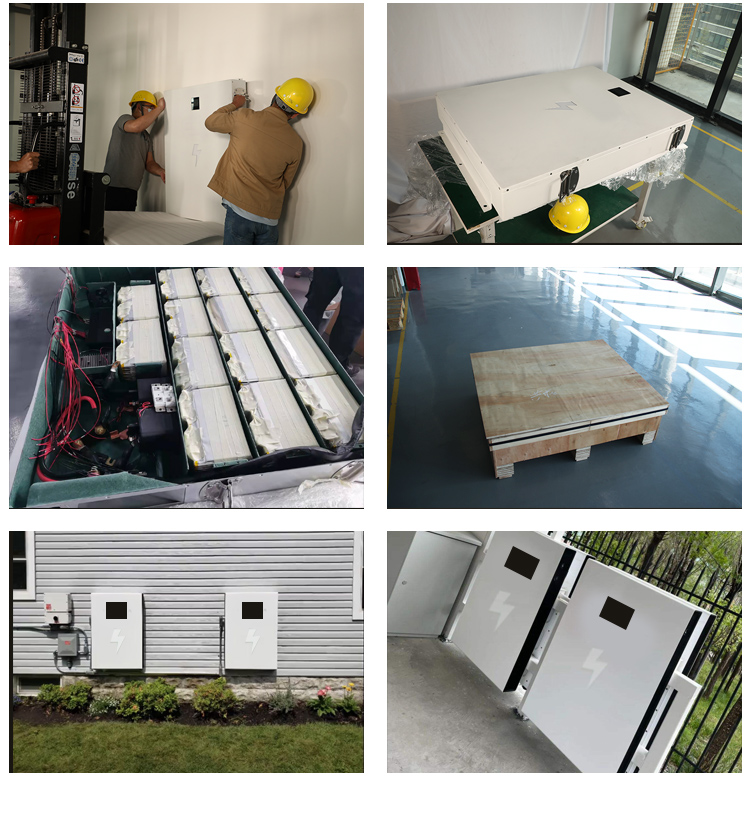
Safe, efficient, intelligent energy storage, creating smart homes and making life more convenient# Home Energy Storage # Supercapacitors # Energy Storage # Wall Mounted # Safe Electricity Use
Gonghe Power Co.,LTD