1. Executive Summary
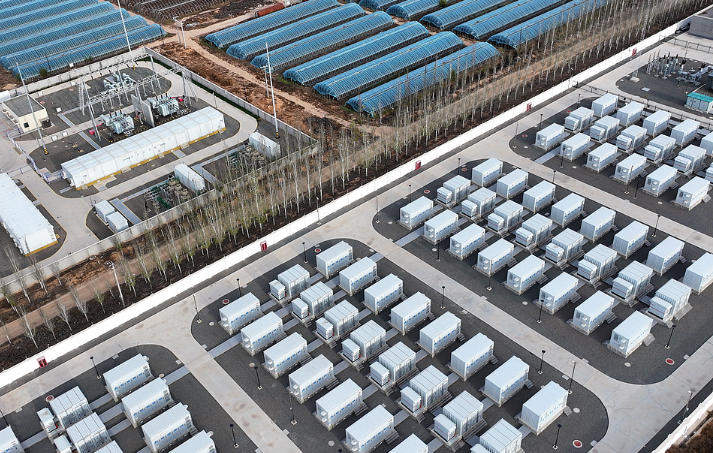
The global energy storage system market entered a new scale-up phase in 2025. Battery storage additions reached approximately 108 GW worldwide, about 40% higher than in 2024, making battery storage the fastest-growing power technology. Utility-scale projects accounted for roughly four-fifths of additions. At the same time, lithium-iron-phosphate (LFP) chemistry represented around 90% of new battery deployments, reinforcing its position as the default chemistry for stationary storage.
The commercial meaning of this growth is more important than the headline capacity number. Storage is moving from a policy-supported renewable add-on toward a core grid asset used for capacity, congestion relief, reserve services, renewable firming, energy arbitrage and customer resilience. The market is therefore broadening from battery cells and containers to complete systems that integrate power conversion systems, energy management software, thermal management, fire protection, transformers, switchgear, controls and long-term service.
Price declines remain a major demand catalyst. The International Energy Agency reported that average battery pack prices fell by around 20% in 2024 and by a further 8% in 2025. IRENA estimated that total installed utility-scale battery storage costs reached about USD 192/kWh in 2024, 93% below 2010 levels. However, lower equipment prices do not automatically produce bankable projects: grid connection, permitting, financing, warranties, degradation assumptions, safety compliance and revenue-stack design increasingly determine project value. [3][4]
Key Findings
- Global battery storage additions reached about 108 GW in 2025, up approximately 40% year on year.
- Utility-scale storage represented around 87 GW, or roughly 81% of global additions in 2025.
- LFP accounted for about 90% of stationary battery deployments, reflecting cost, safety and cycle-life advantages.
- Battery storage prices continued to decline, but project economics increasingly depend on grid access, utilization and revenue certainty rather than hardware cost alone.
- China remains the largest manufacturing and deployment center; the United States, Europe and Australia are major high-value project markets, while India, the Middle East, Southeast Asia and Latin America are emerging growth regions.
- Lithium-ion dominates 1-4 hour applications, but pumped hydro, flow batteries, thermal storage, compressed-air systems and hydrogen-based storage retain advantages for longer durations or specific system needs.
- The competitive boundary is shifting from cell supply toward system integration, software, safety engineering, grid-forming capability, financing support and long-term service.
- Main risks include price compression, interconnection delays, fire-safety failures, trade restrictions, revenue uncertainty and supply-chain concentration.
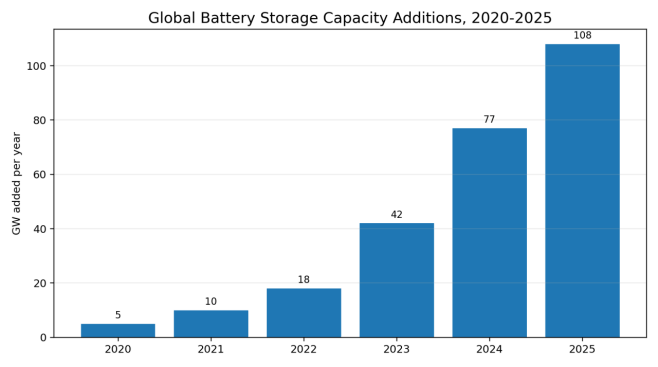
Figure 1. Global battery storage capacity additions, 2020-2025. 2023-2025 values are based on IEA releases; earlier values are rounded from the IEA series for trend illustration.
2. Market Definition and Scope
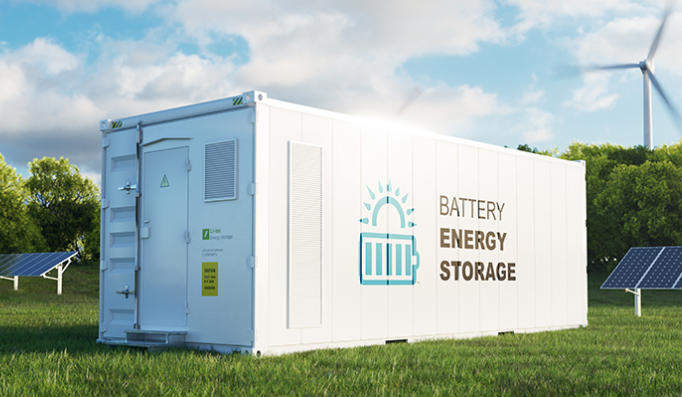
An energy storage system stores energy and releases it later in a controlled form. In power markets, the product is not simply a battery. A bankable battery energy storage system (BESS) normally includes cells, modules, racks, containers or cabinets, a battery management system, power conversion system, energy management system, HVAC or liquid cooling, fire detection and suppression, transformers, medium-voltage switchgear, protection equipment, communications and supervisory controls.
This report covers grid-scale, commercial and industrial, residential and selected long-duration storage systems. It treats pumped-storage hydropower as a major competing and complementary technology, while focusing commercial analysis on electrochemical BESS because this segment is expanding fastest and has the most active global supply chain.
|
Segment |
Typical size |
Primary use cases |
Typical duration |
|
Utility-scale BESS |
10 MW to >1 GW |
Energy shifting, ancillary services, capacity, congestion relief |
1-8 hours |
|
Commercial & industrial |
100 kW to 50 MW |
Demand-charge reduction, resilience, solar self-consumption |
1-6 hours |
|
Residential |
5-30 kWh |
Backup, rooftop solar optimization, retail tariff arbitrage |
2-12 hours |
|
Long-duration storage |
Project dependent |
Multi-hour to multi-day balancing, firm capacity |
8-100+ hours |
|
Pumped-storage hydropower |
100 MW to multi-GW |
Bulk shifting, reserves, inertia, system stability |
6-24+ hours |
3. Global Deployment and Market Stage
Battery storage deployment has accelerated much faster than conventional generation technologies. The IEA recorded 42 GW of new global battery storage in 2023. Additions increased to roughly 77 GW in 2024 and 108 GW in 2025. Installed capacity in 2025 was eleven times the 2021 level. [1][2]
The market is transitioning through three simultaneous stages. First, mature markets are moving toward merchant or partially merchant revenue models. Second, emerging markets are procuring storage through solar-plus-storage tenders, capacity auctions and utility contracts. Third, industrial and data-center customers are purchasing storage for resilience, power quality and emissions management, creating demand for higher availability and more sophisticated control software.
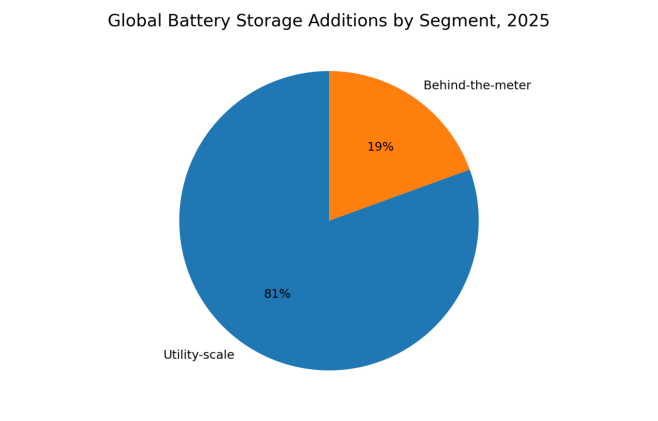
Figure 2. Global battery storage additions by segment, 2025. Utility-scale additions were approximately 87 GW; the remainder was mainly behind-the-meter storage.
4. Demand Drivers
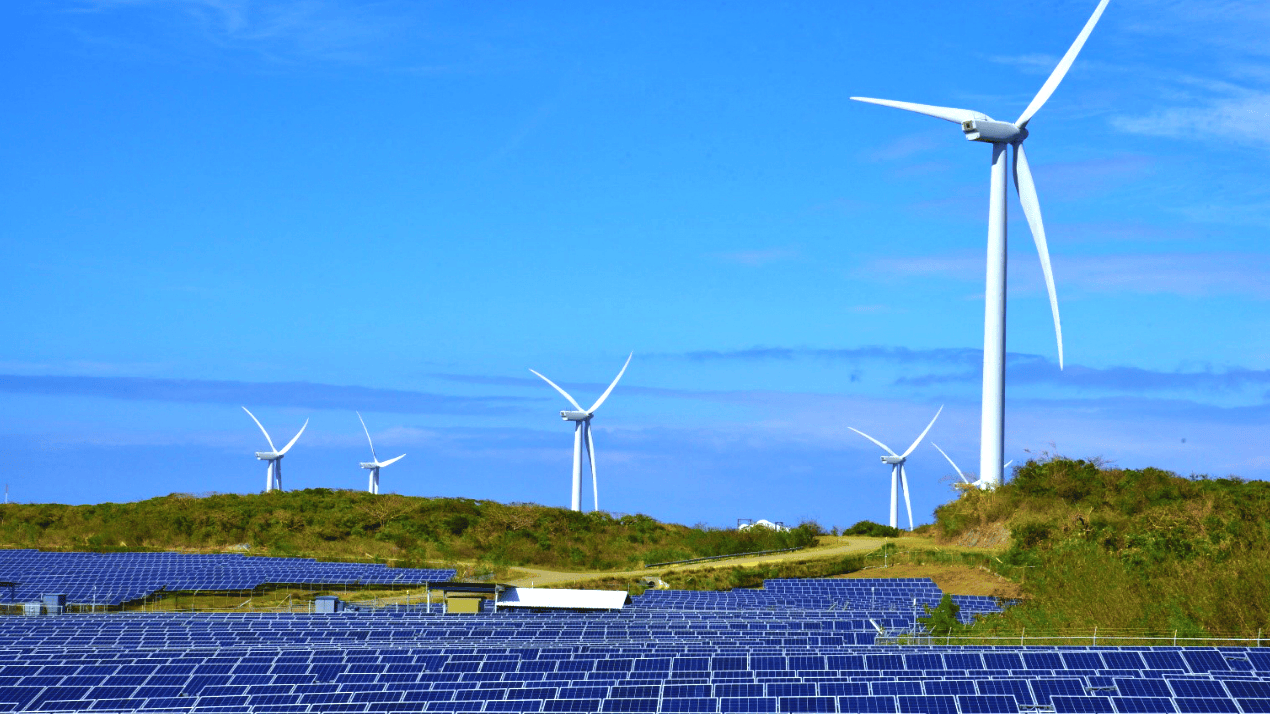
4.1 Renewable Energy Integration
Solar and wind generation are growing faster than many grids can be reinforced. Storage absorbs excess renewable output, reduces curtailment, shifts electricity into higher-value hours and provides rapid balancing. The IEA reported record renewable capacity additions of about 800 GW in 2025, with solar representing 75%. This scale of variable generation materially increases the need for short-duration flexibility. [6]
4.2 Grid Congestion and Connection Constraints
Storage can defer some network upgrades, relieve local congestion and support weak grids. It does not replace transmission, but can improve asset utilization where new lines face long permitting and construction schedules. Grid-forming inverters are becoming more valuable as synchronous generation declines in some systems.
4.3 Capacity and Reliability
As coal and gas plants retire, storage is increasingly procured as a capacity resource. The economic value depends on discharge duration, expected peak shape, accreditation rules and availability during stressed hours. Four-hour lithium-ion systems are common in current capacity markets, but higher renewable shares can increase the need for longer-duration solutions.
4.4 Data Centers and Industrial Loads
Rapid load growth from data centers, semiconductor plants, electrified industrial processes and EV charging hubs is creating new demand for on-site flexibility. Storage can support peak shaving, backup, power quality and participation in demand-response programs, although it must be coordinated with generators, UPS systems and site protection schemes.
5. Regional Market Analysis
|
Region |
Market position |
Primary growth drivers |
Key constraints |
|
China |
Largest deployment and manufacturing center |
Renewable build-out, provincial mandates, grid balancing, low-cost supply chain |
Price pressure, utilization and revenue-model quality |
|
United States |
Large high-value utility-scale market |
Tax incentives, capacity needs, solar-plus-storage, merchant revenues |
Interconnection queues, trade rules, permitting, fire codes |
|
Europe |
Fast-growing but fragmented |
Energy security, renewable integration, balancing markets, capacity mechanisms |
Country-by-country regulation, grid fees, revenue cannibalization |
|
Australia |
Highly active storage market |
High solar penetration, weak-grid needs, frequency services, capacity procurement |
Network congestion and changing ancillary-service prices |
|
India |
Early scale-up with large potential |
Solar tenders, peak demand, grid modernization, domestic manufacturing policy |
Financing, DISCOM credit risk, procurement complexity |
|
Middle East |
Rapidly emerging project market |
Very low-cost solar, round-the-clock renewable tenders, industrial growth |
High-temperature design, bankability and local-content rules |
|
Southeast Asia |
Selective growth |
Island grids, industrial power quality, renewable integration |
Regulatory fragmentation and utility market structure |
|
Latin America |
Strong country-specific opportunities |
Solar growth, mining loads, isolated systems, capacity needs |
Currency risk, permitting and policy volatility |
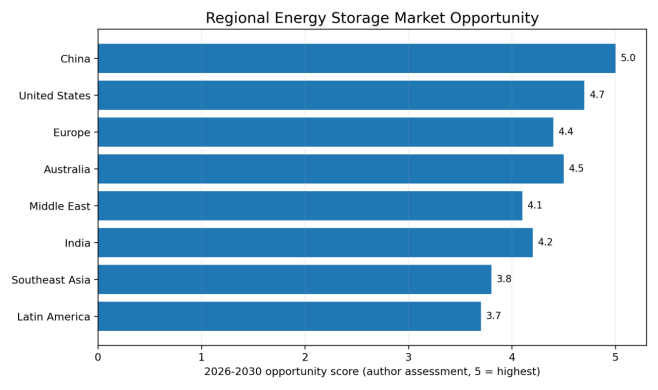
Figure 3. Regional market opportunity assessment for 2026-2030. Scores are the author’s analytical assessment based on deployment momentum, policy support, project pipeline, power-system need and market accessibility.
China
China combines the world’s deepest battery supply chain with the largest domestic deployment base. Competition has reduced system prices and accelerated product standardization. The main market question is shifting from how much capacity is installed to how efficiently assets are dispatched and monetized. Suppliers increasingly compete on turnkey delivery, cell-to-system integration, high-voltage architecture, thermal management, fire separation, grid-forming functions and lifecycle guarantees.
United States
The United States remains one of the most attractive project-value markets because storage can participate in energy, ancillary-service and capacity markets. Demand is concentrated in California, Texas and other high-renewable or capacity-constrained regions. Project developers must manage interconnection queues, tax-credit qualification, domestic-content considerations, changing import rules and increasingly strict local fire-safety reviews.
Europe
European growth is broadening from the United Kingdom and Germany to Italy, Spain, the Netherlands, Greece, Poland and other markets. Revenue models vary widely. Some markets are still led by frequency services; others are moving toward wholesale arbitrage, capacity mechanisms, congestion management and co-location with renewable generation. Market fragmentation rewards developers and suppliers with strong regulatory and trading expertise.
India, Middle East and Other Emerging Markets
Emerging markets increasingly procure storage through utility tenders rather than merchant investment. Solar-plus-storage and round-the-clock renewable contracts are common entry points. Winning bids require more than low equipment prices: bankable degradation curves, high-temperature performance, availability guarantees, local service, financing support and grid-code compliance are decisive.
6. Technology and Product Evolution
Lithium-ion batteries dominate short-duration storage because they benefit from mass manufacturing, high round-trip efficiency, modular deployment and a mature supplier base. LFP has become the preferred stationary chemistry because it generally offers lower cost, longer cycle life and better thermal stability than nickel-rich alternatives, though energy density is lower. The IEA estimated that LFP represented around 90% of battery storage deployments in 2025. [1]
|
Technology |
Strengths |
Limitations |
Best-fit applications |
|
LFP lithium-ion |
Low cost, mature supply chain, strong cycle life, high efficiency |
Fire-protection requirements, degradation, typically short-to-medium duration |
1-6 hour grid, C&I and residential storage |
|
Sodium-ion |
Lower exposure to lithium and nickel, potential low-temperature and safety benefits |
Early commercialization, lower energy density, limited bankability record |
Cost-sensitive stationary storage, selected climates |
|
Flow battery |
Independent power and energy sizing, long cycle life, low fire risk |
Higher balance-of-plant complexity, lower efficiency and energy density |
6-12+ hour stationary storage |
|
Pumped hydro |
Very large scale, long life, inertia and grid services |
Geographic constraints, long development period, high civil-work risk |
Bulk and long-duration grid storage |
|
Thermal storage |
Low-cost storage medium, integration with heat and power loads |
Application-specific conversion losses and siting needs |
Industrial heat, district energy, concentrating solar |
|
Hydrogen-based |
Multi-day or seasonal potential, cross-sector use |
Low round-trip efficiency, infrastructure and cost challenges |
Very long duration and strategic reserves |
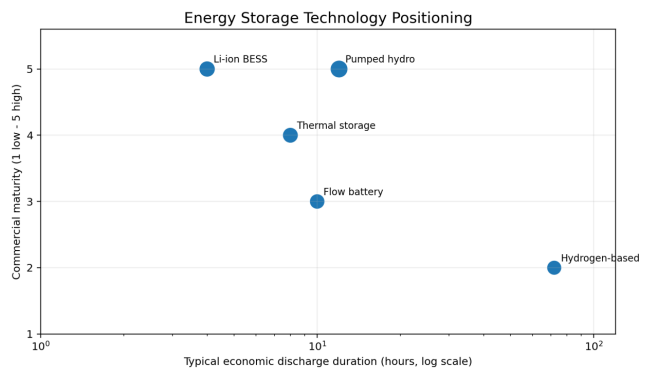
Figure 4. Indicative positioning of major energy storage technologies by discharge duration and commercial maturity. Values are representative rather than universal.
Product Evolution
- Higher-capacity cells and more compact container designs are reducing balance-of-system cost and site footprint.
- Liquid cooling is replacing air cooling in many large systems because it can improve temperature uniformity and usable life.
- AC-block and DC-block architectures are becoming increasingly standardized, simplifying procurement but increasing pressure on differentiated integration value.
- Grid-forming controls, black-start capability and advanced plant controllers are becoming important in weak grids and high-renewable systems.
- Safety design is moving toward multi-layer detection, propagation resistance, gas management, compartmentalization and remote isolation.
- Digital platforms increasingly optimize dispatch across energy, capacity and ancillary-service markets while monitoring degradation and warranty limits.
7. Cost and Pricing Trends
Battery cost reduction has been the strongest market accelerator. According to the IEA, average battery pack prices fell about 20% in 2024 and another 8% in 2025. The agency also noted that average BESS prices in 2025 had fallen to roughly one-third of their 2020 level. IRENA estimated a utility-scale installed cost of USD 192/kWh in 2024, representing a 93% decline from 2010. [3][4][7]
These figures should not be treated as universal turnkey quotations. Project cost varies by duration, interconnection voltage, local labor, transformer and switchgear requirements, fire standards, warranty terms, land, taxes, local content and financing. A low DC-container price can coexist with a much higher all-in project cost.
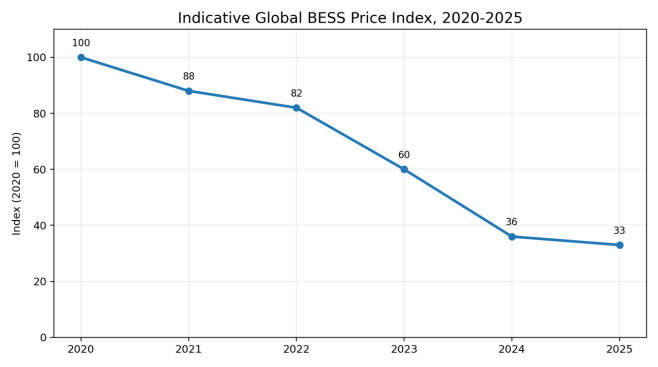
Figure 5. Indicative global BESS price index, 2020-2025. The 2025 endpoint reflects the IEA statement that average BESS prices fell to about one-third of 2020 levels; intermediate values are illustrative.
|
Cost component |
Typical commercial issue |
Procurement implication |
|
Battery cells and modules |
Chemistry, cycle life, degradation, origin and warranty |
Compare warranted usable energy, not only nameplate kWh |
|
Power conversion system |
Efficiency, overload, grid-code and grid-forming functions |
Specify operating modes and fault behavior |
|
Balance of plant |
Transformer, MV switchgear, cables, civil works and auxiliaries |
Site-specific design can dominate cost variance |
|
Thermal and fire systems |
Climate conditions, code compliance, propagation control |
Require test evidence and emergency-response design |
|
Software and controls |
Dispatch optimization, cybersecurity and interoperability |
Define data ownership, interfaces and update obligations |
|
Service and augmentation |
Availability guarantees, replacement strategy and spare parts |
Evaluate lifetime cost and supplier credit quality |
8. Supply Chain and Competitive Landscape
The stationary storage supply chain is concentrated in battery cells but more fragmented in integration, power electronics, software and project delivery. Major battery manufacturers, inverter suppliers, electrical-equipment companies, renewable developers, engineering contractors and specialist integrators compete across overlapping portions of the value chain.
The most defensible positions are moving away from simple container assembly. Competitive advantages increasingly include access to bankable cells, tested system architecture, certified safety performance, grid-code expertise, dispatch software, project financing support, global service networks and the ability to provide long-term performance guarantees.
|
Competitive layer |
Representative capabilities |
Main source of differentiation |
|
Cell manufacturers |
Chemistry, scale, manufacturing yield, warranties |
Cost, cycle life, safety and bankability |
|
System integrators |
Architecture, controls, thermal/fire design, commissioning |
Turnkey performance and project execution |
|
PCS and electrical suppliers |
Inverters, transformers, switchgear, protection |
Grid compliance, efficiency, reliability and service |
|
Developers and IPPs |
Site origination, permitting, market participation, financing |
Pipeline, revenue optimization and capital access |
|
Software providers |
Forecasting, bidding, dispatch and asset analytics |
Revenue uplift, interoperability and degradation control |
|
EPC and service companies |
Construction, commissioning, maintenance and augmentation |
Local delivery capability and lifecycle support |
9. Procurement and Project Economics
Storage procurement should be based on delivered services and lifetime economics rather than the lowest upfront price. The decisive metric is often not USD/kWh of nameplate capacity, but the cost of warranted usable energy, expected annual gross margin and risk-adjusted project return.
- Define the required service stack before selecting duration and chemistry.
- Compare beginning-of-life and end-of-life usable energy, efficiency and auxiliary consumption.
- Model degradation under the expected dispatch profile rather than a generic cycle assumption.
- Check warranty exclusions, throughput limits, temperature windows and state-of-charge constraints.
- Confirm compliance with local grid codes, fire codes, transport rules and cybersecurity requirements.
- Review supplier bankability, parent guarantees, insurance acceptance, spare-parts strategy and augmentation plan.
- Include grid connection, network charges, curtailment, availability penalties and market-price cannibalization in the financial model.
10. Market Opportunities
|
Opportunity |
Why it matters |
Most suitable suppliers |
|
Turnkey utility-scale BESS |
Largest near-term deployment segment |
Bankable integrators, PCS providers, EPCs and electrical suppliers |
|
Solar-plus-storage projects |
Common procurement model in emerging markets |
Developers, module/inverter/storage packages and financing partners |
|
C&I resilience and peak management |
Growing power-quality and tariff-management need |
Distributed-energy integrators and energy-service companies |
|
Grid-forming and weak-grid applications |
Higher renewable penetration increases stability needs |
Advanced PCS, controls and protection suppliers |
|
Long-duration storage |
Renewable systems require longer balancing as penetration rises |
Flow, thermal, pumped-hydro and emerging technology providers |
|
Safety and lifecycle services |
Larger fleets increase inspection, analytics and augmentation demand |
Testing, monitoring, fire-safety and O&M specialists |
11. Risks and Constraints
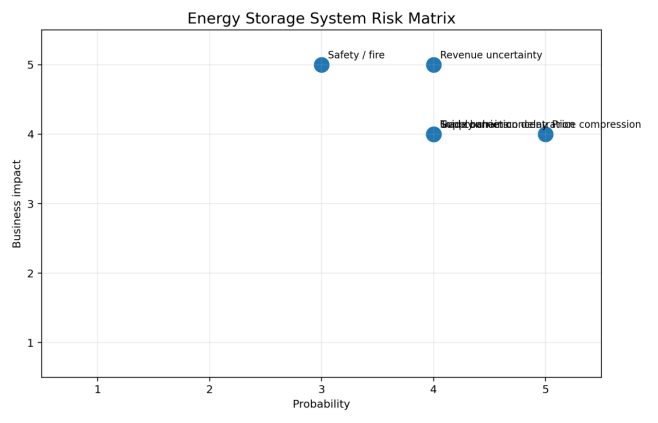
Figure 6. Energy storage system risk matrix. Ratings are an analytical assessment for global suppliers and project developers.
Price compression is a near-term commercial risk because manufacturing capacity has expanded faster than demand in some supply-chain segments. Rapid product change can also create warranty and spare-part risks. Integrators that compete only on initial price may face margin pressure and higher exposure to performance claims.
Grid connection is frequently the critical-path risk. Storage projects may be technically fast to build but delayed by network studies, substation upgrades, land approvals and queue reform. Fire incidents can cause project shutdowns, insurance restrictions and stricter local permitting. Trade measures and local-content rules can reshape sourcing decisions even where one supply region remains structurally cheaper.
12. Outlook to 2030
The IEA has concluded that global power-sector storage must expand more than six-fold by 2030 to support the renewable-energy goals agreed at COP28. Battery storage is expected to provide most of the near-term increase because it can be deployed quickly and at multiple scales. [8]
The market through 2030 is likely to develop along five lines. First, annual battery additions will remain high but growth rates will vary with grid connection and market design. Second, two-to-four-hour LFP systems will retain the largest share, while longer-duration procurement grows from a smaller base. Third, system prices will continue to face downward pressure, though the pace of decline should moderate as cells become a smaller share of total installed cost. Fourth, safety certification, software, grid-forming controls and lifecycle services will become more valuable. Fifth, regional supply-chain policy will create parallel product configurations and sourcing strategies for North America, Europe, China and emerging markets.
13. Strategic Conclusions
The global energy storage system market is no longer defined by whether deployment will occur, but by where projects can secure grid access, stable revenue and bankable long-term performance. Hardware commoditization will continue, especially in standardized lithium-ion systems. However, commoditization at the component level increases the value of integration, project design, safety engineering, software and service.
For manufacturers and suppliers, the most attractive strategy is not to pursue every region with the same product. Successful market entry requires a region-specific combination of certification, grid-code compliance, climate adaptation, local service, warranty design and commercial partnerships. For buyers, the lowest quoted price should be treated as only one input. The strongest projects optimize total lifecycle value, availability, safety and revenue certainty.